US PROGRAMMATIC DIGITAL DISPLAY AD SPENDING, PART 2 - eMarketer
←
→
Page content transcription
If your browser does not render page correctly, please read the page content below

US PROGRAMMATIC DIGITAL
DISPLAY AD SPENDING, PART 2
The vast majority (83.5%) of US digital display ad dollars are transacted using
programmatic technology today. This eMarketer Report, part 2 of 2, features our
forecast for US programmatic digital display ad spending* through 2021, and
provides context for how the market is growing on mobile and video.
*This forecast was completed in October 2019 and does not include impacts of the coronavirus pandemic.
Our forecasts are for the full year, and there is still a strong possibility that the virus could be contained in the
coming months, allowing for a rebound in H2 2020. In most countries we forecast, the bulk of ad spending
takes place during the latter part of the year for the holiday season. We will continue to monitor the situation
and revise our numbers semiannually as we get a better understanding of the long-term impact of COVID-19
on the global economy.

                                                                                                               presented by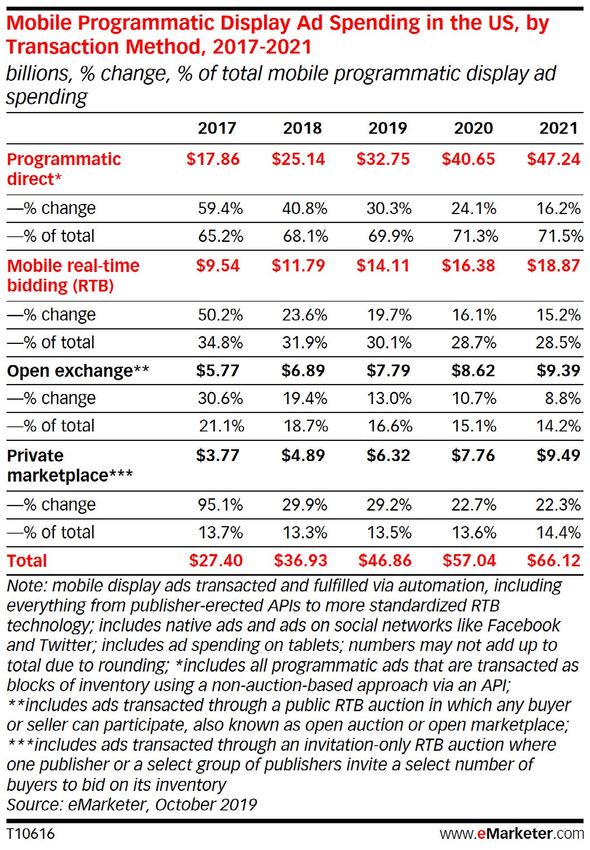
Dear eMarketer Reader,

eMarketer is pleased to make this report, US Programmatic Digital Display
Ad Spending (Part 2), available to our readers.

This report is a great example of eMarketer data and insights that explores
our forecast for US programmatic digital display ad spending through 2021, and
provides context for how the market is growing on mobile and video.

We invite you to learn more about eMarketer’s approach to research and why
we are considered the industry standard by the world’s leading brands, media
companies and agencies.

We thank you for your interest in our report and Publishers Clearing House for
making it possible to offer it to you today.

Best Regards,

 Nancy Taffera-Santos
Nancy Taffera-Santos
SVP, Media Solutions & Strategy, eMarketer

                                             eMarketer, Inc.             www.emarketer.com
                                             11 Times Square, Floor 14   nancyts@emarketer.com
                                             New York, NY 10036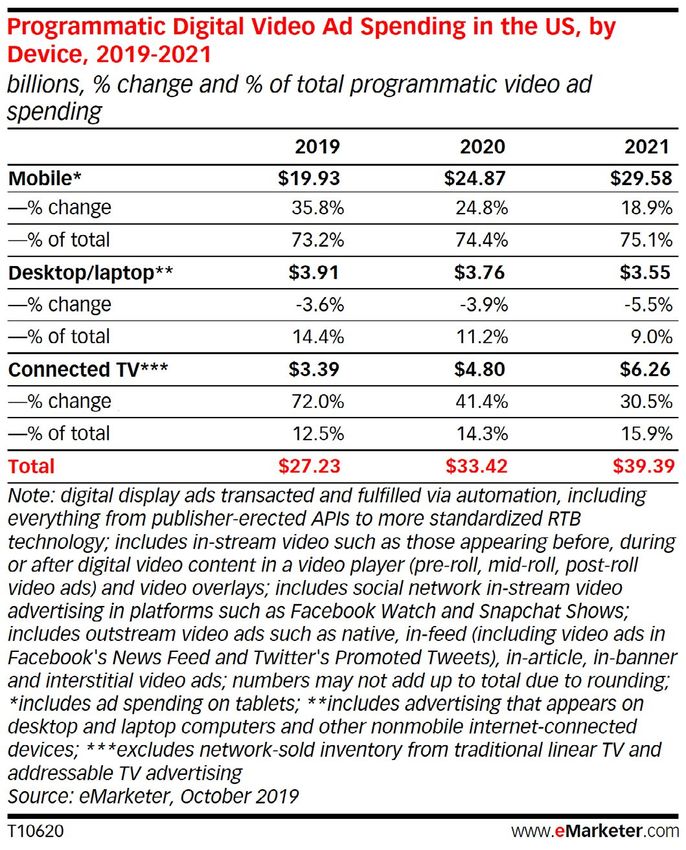
US PROGRAMMATIC DIGITAL DISPLAY AD SPENDING: CONNECTED TV AD
 DOLLARS WILL SURPASS DESKTOP BY 2021
The vast majority (83.5%) of US digital display ad dollars are transacted using programmatic technology today.

The triopoly now accounts for a significant share of
programmatic display ad dollars in the US. So do the
social networks.
More than half of the $57.30 billion US advertisers
spend on programmatic digital display ads this year
goes to social networks—companies that lean heavily
on automation and data-driven technology to grant
advertisers audience scale and precision. Facebook’s ad
revenues contribute significantly to the social network
share, as well as the triopoly’s share. Combined, the US
programmatic digital display ad revenues of the triopoly
(Google, Facebook and Amazon) also account for half of
the programmatic display ad market.

While the vast majority of mobile display ad dollars
transact programmatically, some programmatic
practices are still developing.
This year, $46.86 billion, or 88.7% of all US mobile display
ad dollars, will transact via automated means. While
programmatic is well-established in areas like social and
mobile web, practices including in-app bidding, private
marketplaces (PMPs) and other programmatic tactics
are only now ramping up in certain parts of the in-app
space. Moving forward, in-app ad opportunities will prove        KEY STAT: By 2021, US digital display advertisers will
increasingly important as limitations to third-party tracking    invest nearly $80 billion in programmatic advertising.
plague desktop and mobile web advertisers.

Video continues to account for a significant share of
the market, with practically half of all programmatic
ad dollars in the US coming from video by 2021.                      CONTENTS
Video is one of the fastest-growing digital display ad           2    US Programmatic Digital Display Ad Spending: Connected
formats, and our new connected TV breakout confirms                   TV Ad Dollars Will Surpass Desktop by 2021
that more than one in 10 programmatic video ad dollars
                                                                 4    Programmatic Digital Display Ad Spending Outlook
already goes to connected TV. Over the next 24 months,
connected TV will grab video ad spending share from              6    Mobile Programmatic Ad Spending
desktop, as it makes its march to $6.26 billion by 2021.         8    Programmatic Digital Video Ad Spending
At that time, programmatic ads delivered to connected
                                                                 14 Key Takeaways
TVs will account for 15.9% of total programmatic video,
compared with just 9.0% for desktop and laptop.                  14 eMarketer Interviews
                                                                 16 Read Next
WHAT’S IN THIS REPORT? This report presents our
updated forecast for US programmatic digital display ad          16 Editorial and Production Contributors
spending through 2021. It provides context for how the
programmatic market is growing across transaction types,
formats and devices.

    US PROGRAMMATIC DIGITAL DISPLAY AD SPENDING   PRESENTED BY                        ©2020 EMARKETER INC. ALL RIGHTS RESERVED   2
What’s Inside:                                                     Defining Programmatic Advertising
This report explores how much US ad buyers will invest             eMarketer defines programmatic advertising as an
in programmatic advertising through 2021, highlighting             automated, technology-driven method of buying, selling or
critical trends and influences. It includes eMarketer              fulfilling digital display ad placements.
estimates for the following areas:                                 Real-Time Bidding (RTB): Auction-based approach used to
■■   Total US Programmatic Digital Display Ad Spending             buy or sell impression-level inventory. Auctions can either
                                                                   be public or private.
■■   US Mobile Programmatic Display Ad Spending
                                                                   Programmatic Direct: Non-auction-based approach to
■■   US Mobile Programmatic Display Ad Spending, by
                                                                   buying or selling ad inventory, not at the impression
     Transaction Method
                                                                   level. Programmatic direct deals can be orchestrated via
■■   US Programmatic Digital Video Ad Spending                     preexisting RTB technology, through publisher-owned APIs
                                                                   such as on social sites or via self-service user interface
■■   US Programmatic Digital Video Ad Spending, by Device
                                                                   or deal discovery tools. Programmatic direct deals
■■   US Programmatic Connected TV Ad Spending                      specify a fixed price and may or may not guarantee fixed
                                                                   inventory amounts.

Behind the Numbers                                                 Open Exchange: Public RTB auction open to all buyers and
                                                                   sellers; also called an open auction or open marketplace.
eMarketer’s forecasts and estimates are based on
an analysis of quantitative and qualitative data from              Private Marketplace: Auction owned by a single publisher
research firms, government agencies, media firms and               or a small group of publishers and open only to a select
public companies, plus interviews with top executives              number of invited buyers; also called a private exchange,
at publishers, ad buyers and agencies. Data is weighted            private auction or PMP. These are typically executed via
based on methodology and soundness. Each eMarketer                 normal RTB technology and may include a deal ID, a tag
forecast fits within the larger matrix of all its forecasts,       that notifies the auction that a specific buyer has some sort
with the same assumptions and general framework used               of preferential treatment, whether in price or priority.
to project figures in a wide variety of areas. Regular             Programmatic Guaranteed: Upfront commitment to
re-evaluation of available data means the forecasts reflect        both CPM price and inventory amount secured via
the latest business developments, technology trends and            programmatic pipes between one buyer and one seller;
economic changes.                                                  also called programmatic reserved, forward market or
                                                                   just “upfronts.”
                                                                   Preferred Deal: Upfront commitment to inventory price but
                                                                   not inventory amount between one buyer and one seller;
                                                                   also called private access or first right of refusal.

      US PROGRAMMATIC DIGITAL DISPLAY AD SPENDING   PRESENTED BY                       ©2020 EMARKETER INC. ALL RIGHTS RESERVED   3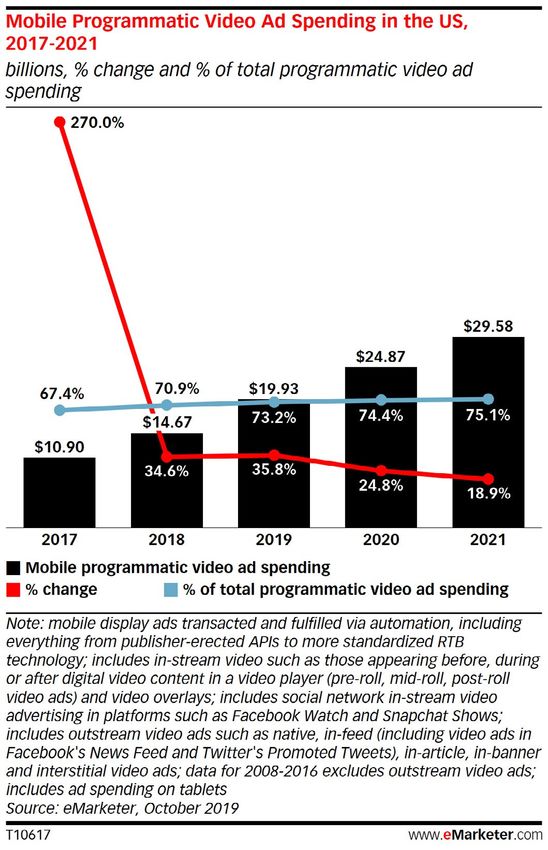
PROGRAMMATIC DIGITAL DISPLAY                                    Our ability to break out Amazon ad revenues by format
                                                                 in our October 2019 US ad spending forecast meant
 AD SPENDING OUTLOOK                                             a reclassification of a significant number of digital ad
                                                                 dollars away from display and into search. This newly
Over the next 24 months, an incremental $22 billion              lowered topline amount for US digital display ad spending
will enter the programmatic digital display                      was then the foundation of the latest programmatic
advertising market as advertisers continue to rely               forecast, which in turn lowered the total dollar amount for
on automation to power their banner, video, social,              programmatic digital display ad spending.
native and even connected TV ad buys. By 2021,
86.5% of all US digital display ad dollars, or nearly            For our complete US Amazon advertising forecast, read
$80 billion, will transact programmatically.                     our November 2019 report, “Amazon Advertising 2019:
                                                                 Growth and Performance Are Strong at the No. 3 US
                                                                 Digital Ad Seller.”

                                                                 Greater insight into the connected TV space, and
                                                                 the revenues at companies such as Roku and Hulu
                                                                 in particular, allowed us to better forecast total ad
                                                                 spending for this channel. (We’ll share the programmatic
                                                                 estimates for US connected TV ad spending later.) With
                                                                 more visibility into the connected TV landscape—and
                                                                 specifically, our understanding that programmatic
                                                                 accounts for less ad spending than we previously
                                                                 thought—we had to adjust the programmatic portion
                                                                 of digital display downward to reflect dollars allocated
                                                                 to a market that is still largely transacted via traditional
                                                                 direct insertion orders (IOs). The result: We forecast US
                                                                 programmatic digital display ad spending will account for
                                                                 83.5% of total display ad dollars this year vs. the 84.9%
                                                                 previously forecast.

Our definition of programmatic display ad spending
considers all digital display ad dollars spent
programmatically on banners, rich media, video and
sponsorships across desktop, mobile devices such as
smartphones and tablets, and IP-connected TV and
over-the-top (OTT) devices. Social media and native ad
units are also included.

What’s changed: Our April 2019 forecast anticipated the
US programmatic digital display ad market would reach
$81.00 billion by 2021 and account for 87.5% of all digital
ad dollars. On both fronts, we’ve lowered our numbers
in the October 2019 forecast due to greater visibility
into Amazon’s ad revenues as well as the connected
TV landscape.

    US PROGRAMMATIC DIGITAL DISPLAY AD SPENDING   PRESENTED BY                       ©2020 EMARKETER INC. ALL RIGHTS RESERVED   4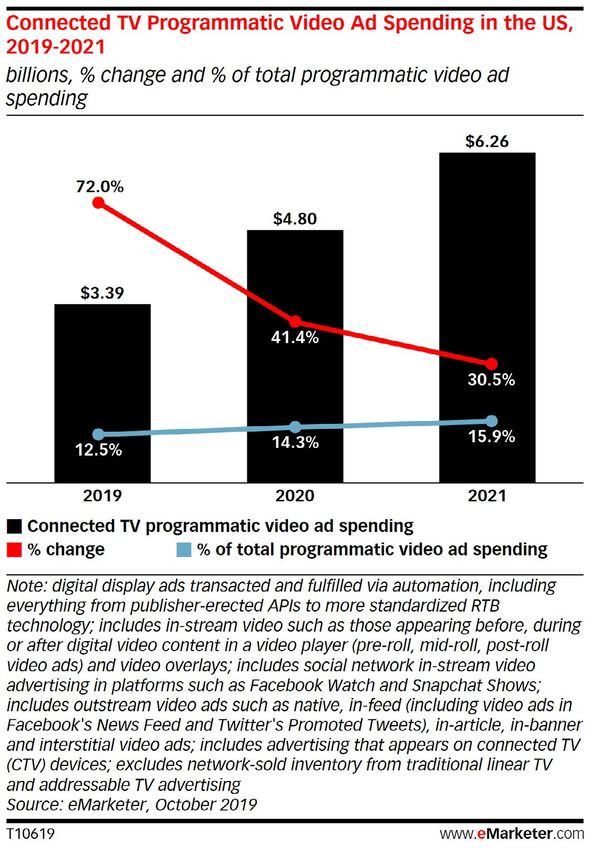
Nonetheless, the upward trajectory for programmatic                            This expectation, coupled with the better-than-expected
growth and penetration suggests a market that is mature                        H1 2019 revenues at the social networks we provide
but still advancing.                                                           estimates for (e.g., Facebook, Twitter, LinkedIn, Pinterest
                                                                               and Snapchat), caused us to raise our forecast for social
The duopoly—and now even the triopoly—accounts                                 as a portion of total programmatic digital display ad
for a majority of programmatic display investment. The                         spending. Our April 2019 forecast put social’s portion at
combined US programmatic digital display ad revenues                           51.3% for 2019; we’ve revised it upward to 56.3%. We
of Facebook, Google and Amazon will account for 62.0%                          now estimate social networks will account for 57.6% of all
of programmatic ad dollars this year. Share will rise to                       US programmatic digital display ad revenues by 2021.
64.2% by 2021. During this 24-month window, Amazon
will jump from No. 4 in terms of programmatic ad
revenues to No. 3, ahead of Verizon.

The Triopoly* Accounts for a Growing Share of
Programmatic Digital Display Ad Dollars in the US,
2019 & 2021
% of total programmatic digital display ad spending

         Other                                Other
         38.0%                                35.8%
                     Triopoly*                                Triopoly*
                     62.0%                                    64.2%

                 2019                                  2021
Note: digital display ads transacted and fulfilled via automation, including
everything from publisher-erected APIs to more standardized RTB
technology; includes native ads and ads on social networks like Facebook       A good portion of the remaining 48.7% of programmatic
and Twitter; includes advertising that appears on desktop/laptop
computers, mobile phones, tablets and other internet-connected devices;        ad dollars spent outside social networks goes to
*includes programmatic digital display ad revenues at Facebook, Google
and Amazon                                                                     programmatic fees also known as the “ad tech tax.”
Source: eMarketer, Oct 2019                                                    We estimate $10.35 billion, or 37.6% of all US nonsocial
250677                                                    www.eMarketer.com
                                                                               programmatic ad spending, goes to programmatic fees.
The triopoly’s advantages in rich data sets, audience reach                    By 2021, $13.63 billion will be spent on programmatic
and closed-loop measurement will continue to attract ad                        fees, however, total share of nonsocial programmatic
buyers to these properties. Such advantages will prove                         ad dollars spent on fees will fall slightly to 36.7%. This
especially attractive in the early days of the California                      speaks to a maturing marketplace and one continuing to
Consumer Privacy Act (CCPA) as ad buyers scramble to                           consolidate. It also emphasizes the effects of continued
ensure publishers and programmatic buying partners are                         transparency demands—and sophistication to act on
compliant and capable of honoring consent. We believe                          those insights, be it in the form of supply-path
the social networks, other walled gardens and premium                          optimization or fee negotiations with vendors and
large-scale publishers, all of which typically exclude                         other intermediaries.
unknown intermediaries, will be considered lower-risk
programmatic channels at first from a CCPA perspective.
The ability of these large, resource-rich companies to
more readily comply with the regulation will also serve to
ease ad buyers’ initial concerns.

     US PROGRAMMATIC DIGITAL DISPLAY AD SPENDING          PRESENTED BY                             ©2020 EMARKETER INC. ALL RIGHTS RESERVED   5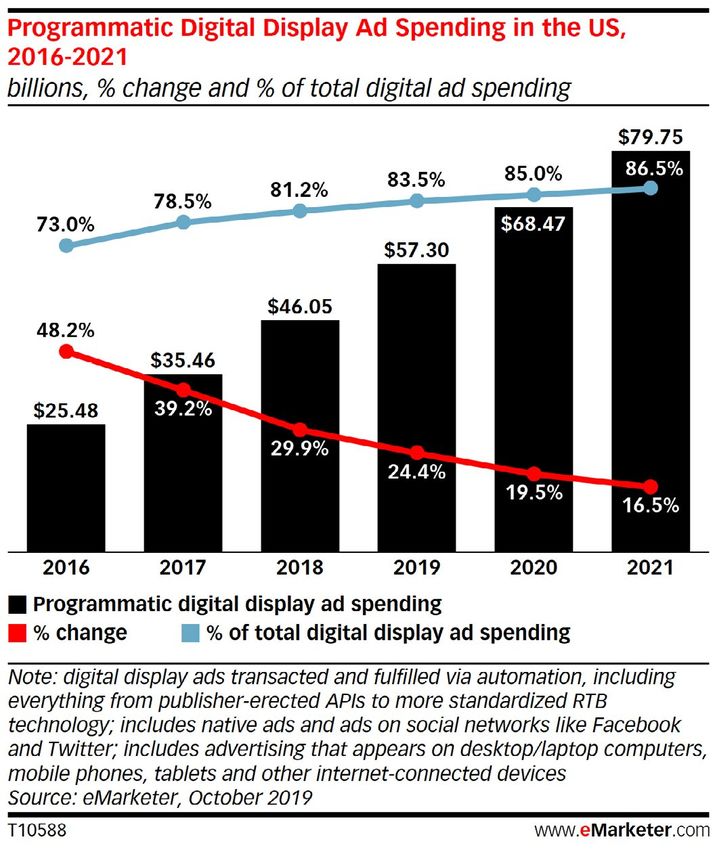
MOBILE PROGRAMMATIC
                                                                  AD SPENDING
                                                                 This year, more than four of every five programmatic
                                                                 digital display ad dollars will go to ads shown
                                                                 on mobile devices. Next year, mobile’s share of
                                                                 programmatic display ad spending will peak at 83.3%;
                                                                 in 2021, it will drop slightly to 82.9% as connected TV
                                                                 grabs a greater share of total programmatic ad dollars.

                                                                 Dollars allocated to mobile programmatic display in
                                                                 the US will reach $46.86 billion in 2019 and rise to
                                                                 $66.12 billion in 2021. At that time, programmatic
                                                                 will account for north of 90% of all US mobile display
                                                                 ad dollars.

For a more in-depth look at programmatic fees, read
our August 2019 report, “US Programmatic Fees 2019:
Concerns about the ‘Ad Tech Tax’ and Transparency Haven’t
Gone Away.”

While a mature landscape, there are areas of digital
display advertising where automation is still more the
exception than the rule, such as connected TV. Other
areas with ongoing industry challenges including data
privacy, changing auction dynamics and cross-device
identification and measurement continue to create
roadblocks to programmatic ad spending.

                                                                 What’s changed: Our positively adjusted outlook for
                                                                 many of the top social properties—for which the vast
                                                                 majority of ad inventory is delivered to mobile devices
                                                                 and via automated means—contributed to our revised
                                                                 estimate that more than nine in 10 mobile display ad
                                                                 dollars would transact programmatically (vs. the 89.8%
                                                                 noted in our April 2019 forecast). Also helping to raise
                                                                 programmatic’s portion of total mobile display ad
                                                                 spending were the continued shift to automation in the
                                                                 nonsocial in-app space and greater anticipated adoption of
                                                                 in-app bidding through the forecast period.

    US PROGRAMMATIC DIGITAL DISPLAY AD SPENDING   PRESENTED BY                       ©2020 EMARKETER INC. ALL RIGHTS RESERVED   6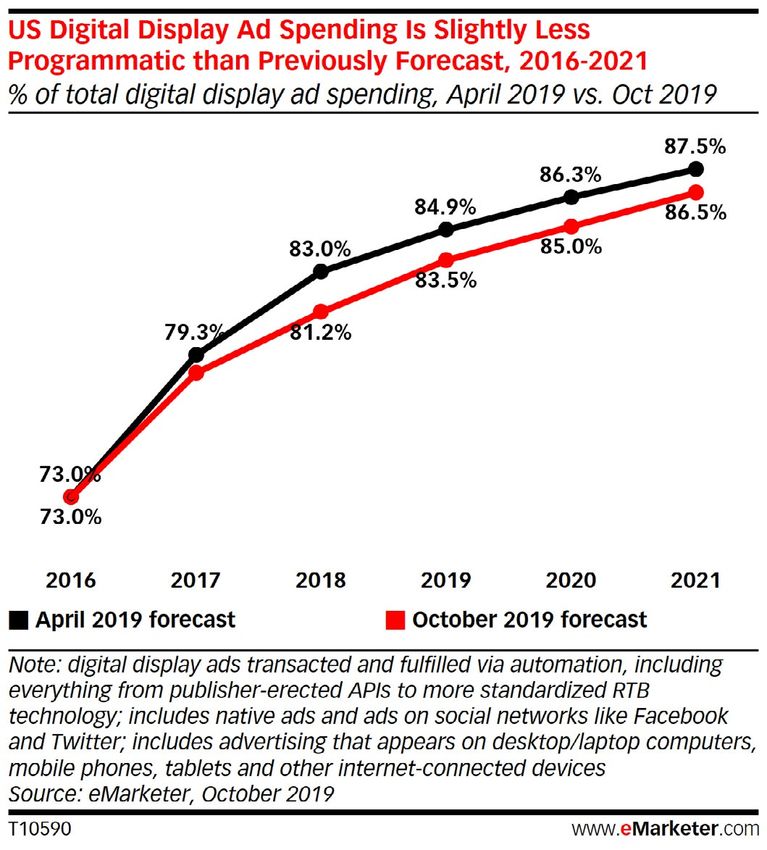
While the numbers might suggest a highly mature                  Programmatic sophistication among app developers is
market, mobile programmatic adoption and sophistication          also rising as many recognize the benefits of leveraging
is mixed. Within social networks—which comprise                  advanced or in-app bidding. While practices such as
a significant portion of the mobile ad landscape—                header bidding have been well-adopted for desktop and
programmatic practices are already advanced. On                  mobile web, greater numbers of in-app publishers and
the mobile web front, buyer and seller practices are             developers are now gravitating toward more equal access
well-established, but they are changing. Privacy settings        and unified auction setups.
and crackdowns on third-party tracking, particularly
within Apple’s Safari browser, are making it more difficult      “App developers are looking to bring in more demand
for buyers to measure and attribute performance. As a            because the more demand you bring in and the more
result, some buyers have begun shifting dollars out of           demand that connects directly with you without taking
mobile web; others will likely follow as the crackdown on        an SSP fee out of it, the better,” said Marc Grabowski,
third-party tracking persists.                                   executive vice president of global supply at Criteo. “A lot
                                                                 more developers are looking at bringing on that demand
Programmatic rollout in the nonsocial in-app space               directly, stripping the SSP fee and being able to have
has historically lagged mobile web. This is due to the           better match rates with the buyer.”
complexities of implementing the necessary tracking,
identification and verification software development             Regardless of the lingering shortcomings of
kits (SDKs) in-app, which has been an obstacle for               programmatic adoption in-app, our expectation is an even
brand spend.                                                     faster maturation of programmatic in-app within the next
                                                                 24 months, particularly as buyers shift ad dollars once
Lack of optimization and buying capabilities for                 destined for mobile web to the in-app arena. Already, we
performance-focused metrics such as cost-per-install             are hearing of buyers moving dollars out of areas that
(CPI) has also been a holdup for many buyers and app             have become harder to track, such as Safari web, thanks
developers trading on these metrics.                             to Apple’s Intelligent Tracking Prevention (ITP) 2.0, 2.1 and
                                                                 2.2 updates.
In the next 24 months, we anticipate advancements on all
fronts, helping to draw performance- and brand-focused           Because Safari and other browsers like Mozilla’s Firefox
buyers and sellers to programmatic in app. Strides are           make it more difficult to track via third-party tags,
already being made. As noted in our prior programmatic           advertisers are finding it more difficult to measure their
forecast report, many of the spending obstacles are              efforts. The result: Many are moving dollars to in-app
being addressed, enabling brands to pump dollars into            PMPs and private setups where more-persistent
the in-app space in areas like gaming, where audiences           identifiers can be used to target and measure. As Google
are scaled, and inventory is often brand safe. Naturally,        Chrome also addresses third-party tracking in the coming
a good portion of that inventory flows through PMPs              year, dollars will continue to shift to the in-app space, as
and guarantees.                                                  well as connected TV. But regardless of device, the deals
                                                                 are going to PMPs and guarantees.

                                                                 MOBILE PROGRAMMATIC AD SPENDING
                                                                 BY TRANSACTION TYPE
                                                                 Today, social networks comprise a significant portion of
                                                                 mobile programmatic display. Therefore, programmatic
                                                                 direct, which overwhelmingly includes social display,
                                                                 accounts for the lion’s share of mobile programmatic
                                                                 ad spending (69.9%). The continued health of social
                                                                 networks, coupled with greater availability of mobile OTT
                                                                 and other premium app inventory like rewarded video, will
                                                                 help programmatic direct’s share reach 71.5% by 2021.

    US PROGRAMMATIC DIGITAL DISPLAY AD SPENDING   PRESENTED BY                       ©2020 EMARKETER INC. ALL RIGHTS RESERVED   7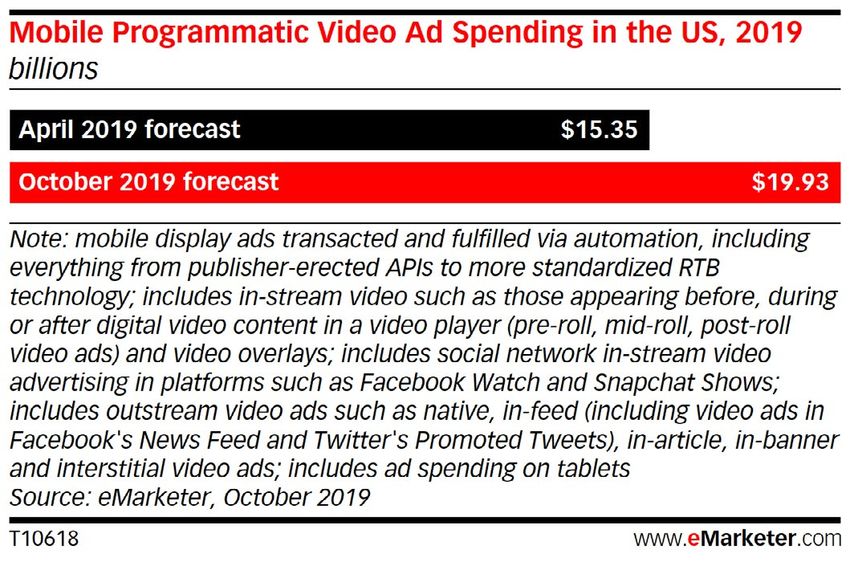
of total Facebook ad revenues is unlikely to change
                                                                 substantially). This shift inevitably lowered our PMP
                                                                 portion (where we had previously placed Facebook
                                                                 Advertising Network revenues). And with more dollars
                                                                 now allocated to programmatic direct, share was also
                                                                 pulled from overall RTB, which lowered open market
                                                                 spending as well.

                                                                 Mobile Programmatic Display Ad Spending in the US,
                                                                 by Transaction Method, 2019
                                                                 % of total, April 2019 forecast vs. Oct 2019 forecast
                                                                     Private marketplace***                   Private marketplace***
                                                                     17.0%                                    13.5%

                                                                                                           Open
                                                                   Open                                   exchange**
                                                                   exchange**                             16.6%
                                                                   21.6%
                                                                                                                     Programmatic
                                                                               Programmatic
                                                                                                                     direct*
                                                                               direct*
                                                                                                                     69.9%
                                                                               61.4%

                                                                          April 2019 forecast                  Oct 2019 forecast
                                                                 Note: mobile display ads transacted and fulfilled via automation, including
                                                                 everything from publisher-erected APIs to more standardized RTB
                                                                 technology; includes native ads and ads on social networks like Facebook
                                                                 and Twitter; includes ad spending on tablets; *includes all mobile
                                                                 programmatic ads that are transacted as blocks of inventory using a
                                                                 non-auction-based approach via an API; **includes ads transacted through
                                                                 a public RTB auction in which any buyer or seller can participate, also
                                                                 known as open auction or open marketplace; ***includes ads transacted
                                                                 through an invitation-only RTB auction where one publisher or a select
                                                                 group of publishers invite a select number of buyers to bid on its inventory
                                                                 Source: eMarketer, Oct 2019
                                                                 250678                                                   www.eMarketer.com
Mobile’s lag in programmatic adoption beyond the social
networks is more clearly visible when looking at open
vs. private marketplace investment. Whereas PMP ad
spending will overtake open exchange ad spending for              PROGRAMMATIC DIGITAL VIDEO
the broader programmatic category in 2020, this won’t             AD SPENDING
happen in mobile until 2021. Dollars allocated to PMPs
will outpace those to the open markets, but the PMPs are         Video accounts for a significant portion of
still coming into their own.
                                                                 programmatic display ad spending in the US. By 2021,
What’s changed: Those familiar with our April 2019               practically one of every two programmatic display ad
forecast might notice the portion specified for                  dollars will go to in-stream and out-stream video ads.
programmatic direct in this forecast is even higher
than previously predicted. Our upward revision to                Almost four of every five US digital video ad dollars
programmatic direct speaks to our optimistic outlook for         transacts programmatically. And by 2021, programmatic
social network ad spending, and the fact that we have            video advertising will be a nearly $40 billion business.
social growing at a faster rate than we had previously           Anticipated gains in connected TV, OTT, social video
forecast. It also reflects our expectations for gains in OTT     and in-app video formats, such as rewarded and
and other mobile video, which frequently transacts in            interstitial video, will all help drive investment during the
the form of guarantees. Our October 2019 forecast also           forecast period.
reflects a reclassification of programmatic ad revenues
for Facebook, in which dollars previously earmarked for
Facebook Audience Network, were shifted back to
on-property Facebook (our expectation being that in the
coming years, Facebook Advertising Network’s share

    US PROGRAMMATIC DIGITAL DISPLAY AD SPENDING   PRESENTED BY                            ©2020 EMARKETER INC. ALL RIGHTS RESERVED      8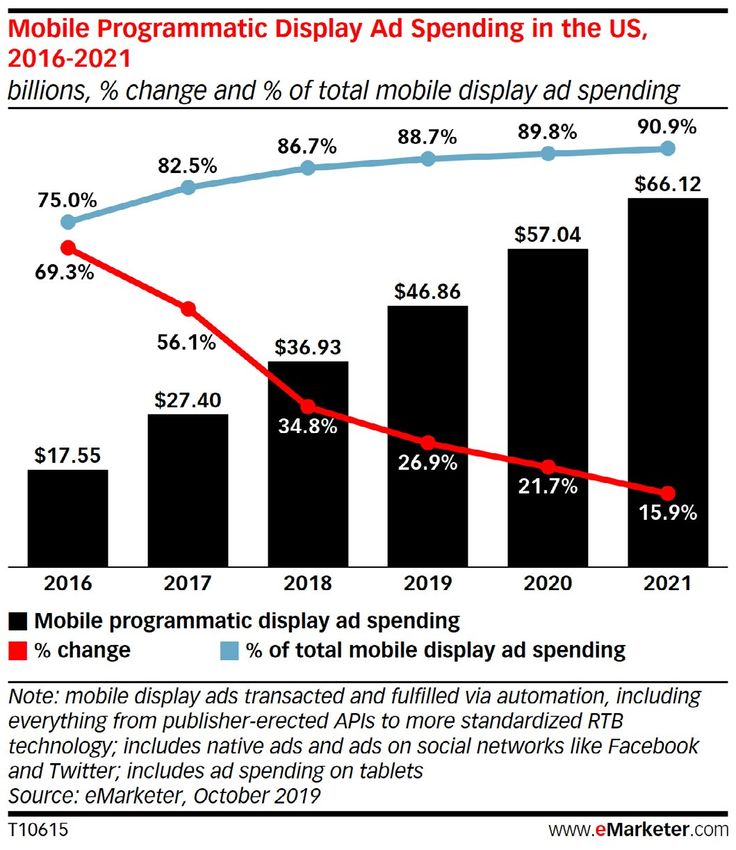
Regardless of this reallocation, programmatic video’s
                                                                growth remains strong, and its outlook is positive. Factors
                                                                expected to influence investment this year through
                                                                2021 include:

                                                                ■■   Sellers’ continued pivot to video. Publishers and app
                                                                     developers today know there’s an expanse of video
                                                                     ad formats beyond in-stream units, and they’re keen
                                                                     to incorporate them into their mix. Over the next 24
                                                                     months, formats such as rewarded video, interstitial
                                                                     video and other various forms of out-stream native
                                                                     ad units will make their way into the ecosystem,
                                                                     offering advertisers greater opportunities to reach their
                                                                     audiences via sight, sound and motion.

                                                                ■■   Growing levels of connected TV and OTT inventory.
                                                                     With several streaming services launching in the
                                                                     coming months, the availability of connected TV and
                                                                     OTT ad inventory will rise during the forecast window.
                                                                     While not all services will be ad-supported—at least at
                                                                     first—we expect to see a glut of inventory entering the
                                                                     programmatic space in 2020 and beyond.

                                                                ■■   Ongoing demand for social video. The social
                                                                     networks show no signs of backing off video, and
                                                                     advertisers do not either. Social’s contribution to the
                                                                     programmatic video landscape will be significant over
                                                                     the next 24 months.

What’s changed: Our April 2019 forecast showed a                ■■   Continued advancements in programmatic video
greater portion of video ads transacting programmatically            ad protocols and technologies. Many interviewed for
and slightly higher dollar amounts than our current                  this report acknowledged that improvements to areas
forecast. As noted above, greater visibility into the                such as dynamic video creative, RTB bidding protocols
connected TV landscape led us to reallocate some                     and even 5G would accelerate growth in the years to
programmatic video dollars back to nonprogrammatic                   come. While the effects of 5G may largely fall outside
video. It also gave us the ability to break out connected            the forecast period, many are laying the necessary
TV ad spending for programmatic video for the first time.            groundwork to capitalize on it when the time comes.
Those numbers appear on the next page.

   US PROGRAMMATIC DIGITAL DISPLAY AD SPENDING   PRESENTED BY                          ©2020 EMARKETER INC. ALL RIGHTS RESERVED   9
MARKETERS’ BLIND SPOT: AMERICA’S HEARTLAND
This article was contributed and sponsored by Publishers Clearing House.
Heather Macaulay The heartland is heterogeneous, inclusive of
radically different populations and ways of life.
Head of Marketing & Strategy
Depending where you look, America’s Heartland
Publishers Clearing may be rural or suburban, it may consist of old and
House Media young populations, and it is socially, ethnically, and
economically diverse. The heartland’s buying power
is massive, with more than 100 million people—
Marketers have more information on representing a third of the US—who stock their
consumers than ever before. We can pantries, fill their wardrobes, plan vacations, and
understand people based on their behavior, give holiday gifts.
psychographic attributes, payment history,
But there’s more to this region than the data reveals.
income, affinities, friends, location—the list
America’s Heartland is also a state of mind, in which
goes on. And yet, all the data in the world
patriotic and family-first people look for moments of
cannot supplant a true understanding of a
hope in everyday life. Heartland is love of family and
consumer’s real social and cultural context.
friends, of faith and country, of wellbeing and the
America is home to social and cultural contexts that outdoors, of deep and meaningful engagement with
differ in fundamental ways, none more basic than local communities. Heartland is also about finding a
the divide between cosmopolitan urban cores and good deal.
the vast rural and exurban heartland that stretches
For marketers, the best way to access America’s
between them. This difference between urban
Heartland is through a publisher that understands
America and America’s Heartland in many ways
both the data and the state of mind. With the
defines the patterns and identity of our country,
erosion of local news media and the saturation of
serving as a reliable indicator of our politics, our
social channels, independent digital publishers who
preferences, and our values.
have engaged in the heartland for decades have
It’s no secret that the vast majority of media buyers become its most reliable proxies.
live within the urban half of this divide, which means
Rather than relying on flat data or your assumptions
that advertising campaigns directed at America’s
alone, rely on these publishers. Marketers that
Heartland start at a fundamental disadvantage. For
address their blind spot for America’s Heartland
most digital media buyers, America’s Heartland is a
will gain loyal and valuable customers—but only by
blind spot. And as American communities heal from
approaching with dedication and authenticity.
the effects of COVID-19 in radically different ways,
this blind spot becomes more severe. Now is the
time to pay closer attention.
The data paints one picture. Heartland consumers are
more likely to own their homes, live in the town they
grew up in, and serve in the military. They represent a
wide range of incomes and educational backgrounds.
They spend time outdoors and have an affinity for
country music, car racing, and home construction.
US PROGRAMMATIC DIGITAL DISPLAY AD SPENDING PRESENTED BY ©2020 EMARKETER INC. ALL RIGHTS RESERVED 10PROGRAMMATIC VIDEO AD SPENDING
BY DEVICE
Most programmatic video ad spending goes to mobile
placements, and mobile will remain the primary
beneficiary of those dollars through 2021.
Of the remaining programmatic video ad dollars not
allocated to mobile this year, 53.6% will go to desktop
video ads, with 46.4% allocated to connected TV.
By 2021, spending earmarked for connected TV will
surpass desktop. At this time, connected TV ad dollars
will account for 15.9% of all US programmatic video
ad dollars.
Even as connected TV ad spending ramps up, mobile’s
share of programmatic video will continue to rise thanks
to anticipated gains in OTT, social and areas like rewarded
and interstitial video on mobile.
What’s changed: While we’ve always been bullish on
mobile video, we’re even more bullish on it with our
October 2019 forecast. The added $4.58 billion we’ve
given mobile video speaks to our optimistic outlook for
social video and OTT—and the better-than-expected
revenues from major players that we’ve seen in H1 2019.
US PROGRAMMATIC DIGITAL DISPLAY AD SPENDING PRESENTED BY ©2020 EMARKETER INC. ALL RIGHTS RESERVED 12Connected TV Factors expected to drive greater programmatic
connected TV ad adoption in the next 12 to 24
Over the next 24 months, advertisers will nearly double months include:
their annual investment in programmatic connected TV
video ads. This year, programmatic will account for just ■■ Anticipated advancements in verification,
fewer than half of all connected TV video ad dollars, or measurement and identity services within the
$3.39 billion. By 2021, that share will rise to 58.9%, connected TV and broader digital video landscape.
or $6.26 billion. Fraud has been a significant issue for connected TV
ads, particularly those accessed via the exchanges.
Verification services must improve if advertisers are
going to put more of their video (and TV) ad budgets
here. Many interviewed for this report said the same
of identity and measurement services, which various
industry organizations, coalitions and private parties are
hard at work to provide. While many issues are unlikely
to be fully resolved by 2021, strides will be made to
keep dollars moving and fix pressing issues, such as
frequency capping.
■■ Once again, privacy and third-party tracking
crackdowns are pushing dollars out of desktop
and mobile web to areas like mobile app and
connected TV. Mobile apps aren’t the only benefactor
of this trend: Connected TV is also primed to benefit
from advertisers’ decreased reliance on third-party
cookies and tracking. Sellers are also waking up to the
importance of connected TV in this regard as well. “The
harsh reality is mobile web may require more resources
to manage effectively as a user environment than it’s
worth to monetize,” said Denise Colella, senior vice
president of advanced advertising products and strategy
at NBCUniversal. “To get your viewability, load speed
and cookie cleanup right, you might as well put those
resources into a connected TV offering rather than
trying to clean up a mobile web-browsing experience.”
■■ A 24-month window that includes high-value
advertising events like the US presidential election
and Summer Olympics. The election and Olympics
“I think ‘test budgets’ are fewer and far between,” said
should drive added spend into programmatic connected
Doug Fleming, head of advanced TV at Hulu. “But those
TV as the former appeals to politicians looking to
that are even being labeled as test budgets are still
leverage connected TV, which carries the best of TV
considerable-sized budgets.”
creative with the precision of digital to hit key voter
demographics. Advertisers will also be keen to connect
The majority of programmatic connected TV ad inventory
with a growing audience of consumers who choose to
comes from three main players today: Hulu, Roku and
stream the Olympics.
YouTube. Even as new sources of connected TV inventory
enter the space in the next 24 months, these players will
still maintain significant share, solidifying their importance
in the ecosystem and emphasizing the fact that many
of the networks and broadcasters with connected TV ad
inventory will be slower to release it programmatically
during this timeframe.
US PROGRAMMATIC DIGITAL DISPLAY AD SPENDING PRESENTED BY ©2020 EMARKETER INC. ALL RIGHTS RESERVED 13KEY TAKEAWAYS Geisla de Souza
Head of Display EMEA and APAC
and Paid Media Operations
■■ Programmatic is now the norm for buying and
Jellyfish
selling digital display ads. While select advertisers
and sellers may still be transitioning to programmatic Interviewed August 12, 2019
across areas like in-app, audio, connected TV and
OTT, the tide is continuing to carry buyers and sellers Kevin Fennelley
toward automation. Senior Director, Device Graph and TV Products
dataxu
■■ Connected TV will continue to play an increased Interviewed August 28, 2019
role in the programmatic video landscape, but it
will take time for dollars to fully shift to automation. Glenn Fishback
Still, buyers and sellers should look at connected TV and Chief Revenue Officer
OTT as pivotal formats for extending audience reach Smaato
and campaign performance beyond digital video and TV. Interviewed August 12, 2019
Ryan Fleisch
EMARKETER INTERVIEWS Head of Product Marketing,
Adobe Advertising Cloud
Adobe
Greg Anderson Interviewed August 14, 2019
Managing Director
Xaxis
Doug Fleming
Interviewed August 12, 2019
Head of Advanced TV
Hulu
Ellie Bamford Interviewed August 12, 2019
Vice President, Media
R/GA
Anne Frisbie
Interviewed August 28, 2019
Senior Vice President,
Global Brand and Programmatic
Youssef Ben-Youssef InMobi
Head of Ad Platform
Interviewed August 28, 2019
Roku
Interviewed August 12, 2019
Marc Grabowski
Executive Vice President, Global Supply
Amanda Betsold
Criteo
Vice President, Head of Programmatic
Interviewed August 16, 2019
iCrossing
Interviewed August 6, 2019
Jeff Hirsch
CMO and Head of US Publisher Development
Mike Caprio
PubMatic
Divisional President
Interviewed August 6, 2019
Zeta Global
Interviewed August 14, 2019
Julien Hirth
Founder
Denise Colella
Scibids
Senior Vice President,
Interviewed August 15, 2019
Advanced Advertising Products and Strategy
NBCUniversal
Jeremy Hlavacek
Interviewed August 13, 2019
Head of Revenue
Watson Advertising
Interviewed August 7, 2019
US PROGRAMMATIC DIGITAL DISPLAY AD SPENDING PRESENTED BY ©2020 EMARKETER INC. ALL RIGHTS RESERVED 14Kevin Hunt Ramsey McGrory
Senior Vice President, Global Marketing Chief Revenue Officer
SpotX MediaOcean
Interviewed August 14, 2019 Interviewed August 8, 2019
Aleksandra Injac Hiten Mistry
US Programmatic Practice Lead Senior Vice President, Product Management
Mindshare Centro
Interviewed August 27, 2019 Interviewed August 8, 2019
Anthony Katsur Jordan Mitchell
Senior Vice President, Strategy and Operations Senior Vice President, IAB Tech Lab
Nexstar Digital Interactive Advertising Bureau (IAB)
Interviewed August 16, 2019 Interviewed August 13, 2019
Walter Knapp Liane Nadeau
CEO Vice President and Group Director,
Sovrn Head of Programmatic
Interviewed August 8, 2019 Digitas North America
Interviewed August 14, 2019
David Kohl
President, CEO Ari Paparo
TrustX CEO
Interviewed August 13, 2019 Beeswax
Interviewed August 2, 2019
Harry Kratel
Vice President, Global Marketing Matt Prohaska
Smaato CEO, Principal
Interviewed August 12, 2019 Prohaska Consulting
Interviewed August 14, 2019
James Lawson
CEO, Board Member Michael Provenzano
AdTheorent, Inc. Co-Founder, CEO
Interviewed August 16, 2019 Vistar Media
Interviewed August 2, 2019
James Malins
Senior Vice President, Programmatic Jon Schulz
Amobee CMO
Interviewed August 15, 2019 Viant
Interviewed August 28, 2019
Amanda Martin
Director, Enterprise Partnerships Mario Schiappacasse
Goodway Group Head of Programmatic Media
Interviewed August 8, 2019 Jellyfish
Interviewed August 12, 2019
Tahira McGhee
Group Director, Media Management Justin Silberman
R/GA Vice President, Product
Interviewed August 28, 2019 Dailymotion
Interviewed August 7, 2019
US PROGRAMMATIC DIGITAL DISPLAY AD SPENDING PRESENTED BY ©2020 EMARKETER INC. ALL RIGHTS RESERVED 15Philip Smolin READ NEXT
Chief Strategy Officer
Amobee
Amazon Advertising 2019: Growth and Performance
Interviewed August 15, 2019
Are Strong at the No. 3 US Digital Ad Seller
Digital Display Ad Pricing StatPack: Banner, Video,
Scott Symonds
Mobile and Native CPMs, and Pricing Trends to Watch
Managing Director
for in 2019
AKQA
Interviewed August 7, 2019 Digital Marketing in Today’s Privacy-Conscious World:
What Companies Need to Know About GDPR, CCPA
Todd Tran
and Other Industry Changes in the Next 12 Months
Global Senior Vice President, Programmatic US Programmatic Ad Spending Forecast 2019: Nearly
Teads Half of Programmatic Ad Dollars Now Go to Video
Interviewed August 16, 2019
US Programmatic Fees 2019: Concerns about the ‘Ad
Tech Tax’ and Transparency Haven’t Gone Away.
Jackie Vanover
US Subscription Video Landscape 2019: Bracing for an
Vice President, DSP
Onslaught of New Services
MediaMath
Interviewed August 15, 2019 Video Ads in Social Media 2019: Creators Are in
Demand on Social Properties. Here’s Why—and What
Dean Vegliante
It Means for YouTube
President Digital Ad Fraud 2019: Mobile and Video Remain
Netmining Riskiest Channels
Interviewed August 13, 2019
Terri Walter EDITORIAL AND
Chief Growth Officer PRODUCTION CONTRIBUTORS
TrustX
Interviewed August 13, 2019
Anam Baig Senior Editor
Joanne DiCamillo Senior Production Artist
Manu Warikoo Donte Gibson Chart Editor
Chief Product Officer Katie Hamblin Chart Editorial Manager
MediaOcean Dana Hill Director of Production
Interviewed August 8, 2019
Erika Huber Copy Editor
Ann Marie Kerwin Executive Editor, Content Strategy
Nimrod Zuta Stephanie Meyer Senior Production Artist
Vice President, Product
Heather Price Deputy Editor
ironSource
Magenta Ranero Senior Chart Editor
Interviewed October 28, 2019
Amanda Silvestri Senior Copy Editor
Jude O’Connor
General Manager, Brand, North America
AdColony
Interviewed August 13, 2019
US PROGRAMMATIC DIGITAL DISPLAY AD SPENDING PRESENTED BY ©2020 EMARKETER INC. ALL RIGHTS RESERVED 16You can also read