User Guide for DFC Financial Projections Model Builder Tool January 10, 2020 - Prepared by: Deborah Howard - OPIC
←
→
Page content transcription
If your browser does not render page correctly, please read the page content below
User Guide for DFC Financial Projections Model Builder Tool   January 10, 2020

User Guide for DFC
Financial Projections Model Builder Tool

January 10, 2020

Prepared by:
Deborah Howard
User Guide for DFC Financial Projections Model Builder Tool January 10, 2020
User Guide for DFC Financial Projections Model Builder Tool                                                                                              January 10, 2020

Table of Contents
1.      Overview ......................................................................................................................................................................... 1
2.      Getting Started ................................................................................................................................................................ 2
3.       Enter Historical Data ....................................................................................................................................................... 3
4.       Enter Assumptions for Projections ................................................................................................................................. 5
     4.1 Revenue Assumptions ................................................................................................................................................. 5
     4.2 Operating Cost Assumptions ....................................................................................................................................... 6
     4.3 Capital Cost Assumptions ............................................................................................................................................ 6
     4.4 OPIC Debt Assumptions .............................................................................................................................................. 7
     4.5 Other Non-Subordinated Debt Assumptions .............................................................................................................. 8
     4.6 Subordinated Debt and Equity Assumptions .............................................................................................................. 8
     4.7 Income Tax Assumptions ............................................................................................................................................ 9
     4.8 Depreciation/Amortization Assumptions ................................................................................................................... 9
     4.9 Working Capital and Debt Service Reserve Assumptions ......................................................................................... 10
     4.10 Cost of Capital Assumptions ..................................................................................................................................... 10
5.      Review Template Output .............................................................................................................................................. 11
     5.1 Income Statement ..................................................................................................................................................... 11
     5.2 Cash Flow Statement, Debt Service Coverage and Net Present Value................................................................. 12
     5.3 Balance Sheet ........................................................................................................................................................... 14
     5.4 Sources and Uses Calculation ................................................................................................................................. 15
     5.5 Ratio Analysis .......................................................................................................................................................... 16
Appendix A: Updating Excel Settings ................................................................................................................................... 17
Appendix B: Ratio Formulas ................................................................................................................................................. 19
User Guide for DFC Financial Projections Model Builder Tool January 10, 2020
1. Overview
The financial projections model builder tool is designed to allow applicants and DFC personnel to create
basic project financial projections quickly and efficiently. Following are key features:
• It is a Microsoft Excel-based template that utilizes Visual Basic for Applications (VBA) macros as well
as formulas that require the Excel “Analysis Toolpak” add-in. Therefore, the user should allow
macros to run and activate the “Analysis Tookpak” add-in to ensure that the template functions
properly.
• The template can be configured to accommodate both new/greenfield projects and expansions of
existing businesses. An embedded macro will allow the user to choose which configuration is
required.
• Your system will likely prompt you to enable Macros when you open this Excel file. So, make sure to
click “Enable Content.”
• The template captures data/assumptions on an annual basis. If non-annual (i.e. quarterly or
monthly) projections are critical to the evaluation of the project, then applicants should provide a
separate model that captures information in their required format.
• The projections are denominated in thousands of U.S. dollars. If the user is entering historical data
denominated in another currency, the template will allow them to translate the data into U.S.
dollars (please see section 3 below)
• The template is designed such that the average user will only need to enter data on the “Start,”
“Historical Data” (if the project is an expansion), and “Assumptions” worksheets. The template will
generate the projections based on data entered into those worksheets. Only experienced modelers
should attempt to edit other parts of the template.
Please note that the user should provide information regarding the source of their model assumptions
when submitting projections to DFC. For instance, if the projections show certain assumptions
regarding the growth of project revenue, the applicant should be able to show that those assumptions
are consistent with their market research and business plan.
1User Guide for DFC Financial Projections Model Builder Tool January 10, 2020
2. Getting Started
Click on the “Start” worksheet that is the first tab in the workbook:
This worksheet (shown below) requires the input of three key pieces of information and includes a
“Print” button that will allow the user to print out the workbook output pages at any time.
1. Type in the name of the project or company for which the projections are being generated.
2. Choose the type of transaction. This is a macro button. When the user clicks on it, a dialogue
box will appear that allows the user to choose whether the project/company is new or an
expansion. Depending upon the user’s choice, the template may reconfigure to accommodate
the transaction.
3. Type in the target date for first disbursement of the DFC-supported debt. This will set the “base
year” for the projections.
2User Guide for DFC Financial Projections Model Builder Tool January 10, 2020
3. Enter Historical Data
The “Historical Data” worksheet will only be visible if the user has chosen “Expansion of Existing
Company/Corporate Finance” as the transaction type on the “Start” worksheet. If the transaction type
is a “New Company/Stand-alone Project Finance,” then the “Historical Data” worksheet will be hidden,
and the user may skip this section.
The “Historical Data” worksheet allows the user to enter up to three (3) years of historical financial
statements. Please note the following features:
• This worksheet allows the user to indicate whether the historical statements are being entered in
U.S. dollars or another currency. A full explanation of this functionality is on the next page.
• No matter which currency the data is in, the amounts should be entered in “thousands” of units.
For example, if the company’s cash balance at the end of 2012 was 3,245,016 Euros, then the user
should enter “3,245” into the field.
• The years are pre-calculated based on the current date entered onto the “Start” worksheet. The
template assumes a fiscal year end date of December 31 and counts back three fiscal years from the
template start date. If the company’s fiscal years are different, the user can change them manually
in the fields in Row 6.
• Except for the optional manual adjustment described above, the user should only enter data into
the blue-tinted source data fields in rows 14 through 69. Entering data below row 69 will cause the
template to malfunction.
• For each statement entered, the user should choose from the drop-down what type of statement it
is (i.e. Audited, Company Prepared, etc.)
• DFC strongly prefers that an expanding company provide three years of financial data, but for the
purposes of the projections, the most recent year is the most important because that is the one that
will tie in with the projected data.
3User Guide for DFC Financial Projections Model Builder Tool January 10, 2020
Choosing the Currency of the Historical Statements
The user clicks on the “Choose Currency of Statements” button:
A dialogue box will ask the user if the historical data is denominated in U.S. dollars or another currency.
If the user chooses “1” (Historical Statements are USD denominated), then no reconfiguration of the
worksheet is needed. If the user chooses “2” (Historical Statements are not USD denominated), then
the worksheet will reconfigure as shown below to allow the user to put in an exchange rate for each
year. Note: the user cannot choose different currencies for different years – the source currency must
be the same for all years entered.
After the user has entered the source data for all available years, they should click the “Convert to USD”
button at the bottom of the input section. That will run a macro that will hide the input section and
show only the converted amounts.
If the user has run the conversion macro but then needs to go back into the source data to edit/correct
an item, they can click on the “Re-open Entry Fields” button to run a macro that will make the input
section visible again. Then they can scroll back up into the input section and correct the source data.
4User Guide for DFC Financial Projections Model Builder Tool January 10, 2020
4. Enter Assumptions for Projections
Users inputting all transactions types will use the “Assumptions” worksheet to enter their assumptions
regarding revenues and various types of costs. The first year in the “Assumptions” worksheet is the
calendar year of the current date entered on the “Start” worksheet. Including the current year, the
“Assumptions” worksheet allows for thirteen (13) years of data (pictures on the following pages have
been truncated for space considerations). Users should only enter data into aqua cells. Changing other
cells may cause the template to malfunction.
4.1 Revenue Assumptions
The Revenue section of the “Assumptions” worksheet allows the user to:
• Enter names of up to four (4) lines of business.
• Indicate via drop-down menu whether each line of business is an existing or new line of business.
• Enter the expected sales volumes and prices for each year. These should be entered in actual units.
The template will convert them to thousands of USD.
• Enter three years of expected future local currency/USD conversion rates. If sales are expected to
be in USD, then the user should leave the conversion rate at 1.00. Whatever exchange rate is
entered in the third year is held constant for the remainder of the project since the volatility of
exchange rates makes projecting them highly uncertain after that point.
5User Guide for DFC Financial Projections Model Builder Tool January 10, 2020
4.2 Operating Cost Assumptions
The Operating Costs section of the “Assumptions” worksheet allows the user to enter assumptions
regarding both the direct cost of goods sold (the materials and labor used directly to produce the
product or service) and the indirect/overhead expenses (such as rent, utilities, marketing, insurance,
day-to-day accounting or legal services, etc.).
• The direct cost of goods sold is entered as a percentage of the total revenues. If there are numerous
product lines, this percentage may be a weighted average number derived through a complex
analysis of the materials and labor required to produce each line of revenue. If the user feels that it
would be helpful to provide this information in the model, then the user should create an additional
worksheet for these detailed calculations and in row 33 of the Assumptions worksheet refer to the
weighted average percentage calculated on the additional worksheet.
• The indirect/overhead costs are broken into two categories, those expended in local currency and
those expended in USD. Enter the name of each type of expense in the first column and the
amounts in “thousands” of currency units in each year. The projected currency conversion rate
entered in the revenue section will be used to convert local currency expenses into USD.
• Though depreciation/amortization is an overhead cost, do not include it anywhere in this section. It
will be calculated separately in another section.
• Note: If there are certain legal or other professional fees that are being incurred in the pre-
operating (i.e. construction/startup) period, and those expenses are being counted as part of the
project cost, do not enter them in this section. Those “development” expenses should be entered
into the CAPITAL COSTS section described below.
4.3 Capital Cost Assumptions
The Capital Costs section of the “Assumptions” worksheet allows the user to enter up to ten separate
capital cost line items. The name of each item should be entered in the first column, and annual
amounts in thousands of USD should be entered in each year.
6User Guide for DFC Financial Projections Model Builder Tool January 10, 2020
Note: Even if the user considers DFC interest/fees during construction and start-up working capital as
project costs, do not enter them in this section. Interest/fees and working capital are calculated in later
sections.
4.4 DFC Debt Assumptions
For many projects, the DFC loan will be the only (or the primary) long-term debt financing, so
assumptions regarding the DFC debt are input separately from any other debt assumptions.
• The user should consult with their DFC contact regarding the appropriate rates for the interest,
commitment fee and facility fee.
• The loan term and any grace period on principal repayments should be entered in months.
• Do not use either January 1 or December 31 as the Estimated Date of First Drawdown in cell D82.
• It is rare for DFC to allow a mortgage-style amortization schedule, but there is a hidden worksheet
that will calculate such a schedule automatically if the user chooses that option in cell D86.
• Remember to enter disbursements totaling the full loan amount in Row 92. Otherwise the
amortization calculations will be incorrect.
7User Guide for DFC Financial Projections Model Builder Tool January 10, 2020
4.5 Other Non-Subordinated Debt Assumptions
As noted above, the DFC loan is frequently a project’s only non-subordinated debt funding. However, in
some cases (particularly expansions of existing companies where other debt may already be on the
balance sheet), DFC may allow other debt funding facilities to be carried and amortized alongside the
DFC loan so long as the servicing of those facilities does not jeopardize the servicing of the DFC loan.
Therefore, the template allows the user to enter information about disbursements, fees, interest and
repayments on both long-term and short term non-DFC debt funding facilities.
4.6 Subordinated Debt and Equity Assumptions
DFC treats Subordinated Debt as “deeply subordinated” – i.e. it acts like equity. Therefore, if a
subordinated debt component is part of the funding structure, please consult your DFC contact
regarding any payments under that facility. Moreover, DFC’s standard loan documentation contains
certain restrictions on equity payouts that are intended to protect DFC’s position as a senior creditor.
Dividend payouts are not allowed at all until the project is operating, and a maximum payout ratio
thereafter may be stipulated as part of the loan terms.
8User Guide for DFC Financial Projections Model Builder Tool January 10, 2020
4.7 Income Tax Assumptions
The Income Tax section of the “Assumptions” worksheet allows the user to input the estimated tax rate
that will be charged on the earnings of the project. This rate is applied to earnings after depreciation
and interest. If the project benefits from any tax credits or exemptions that affect the rate at which the
company is taxed or the amount of taxable net income, these effects should be captured by calculating
the effective profit tax rate the company faces over all its income. If the exemptions are numerous or
complex, it may be advisable to capture all of the tax effects in a separate spreadsheet. This spreadsheet
can be used to calculate the annual effective tax rate as a share of all income and linked to this row.
In some cases, a project will have a tax holiday of a certain number of years, and the user will leave the
rate at 0% for those periods.
4.8 Depreciation/Amortization Assumptions
The Depreciation/Amortization section of the “Assumptions” worksheet allows the user to input
assumptions regarding the time period over which the project’s “hard assets” will be depreciated.
Note: If the user has chosen the template configuration for the expansion of an existing business, then
the worksheet will include a row for putting in the weighted average depreciation for the business’s
existing asset base (see row highlighted in red). If the user has chosen the template configuration for a
new company/project, that row will be hidden and the only depreciable assets that will be shown are
the new hard assets listed in the capital expenditure section.
In either case, the user should choose the year in which depreciation is to start (cell D152) and for each
line item enter the approximate number of years over which that item should be depreciated (column
B). In some countries, the tax codes are so rudimentary that the user may not know the allowable
number of years over which certain assets may be depreciated. Getting the level of depreciation correct
is only critical if the income tax rate is high because depreciation is a deduction used in calculating
taxable income.
9User Guide for DFC Financial Projections Model Builder Tool January 10, 2020
4.9 Working Capital and Debt Service Reserve Assumptions
Net working capital is the amount of “liquidity” a company/project requires and is generally defined as
(receivables + inventory)-(payables). The start-up working capital required by a new company, or a
sudden increase in working capital required by an expanding company, can be a significant cash expense
during the start-up or expansion period. So, providing a realistic estimate of the magnitudes of
receivables, inventory and payables is an important part of the projections.
The receivables account on the balance sheet is calculated by multiplying the number of days of
receivables (entered in row 168 of the “Assumptions” worksheet) by the average daily revenue of the
business. It represents the number of days of revenue that customers owe to the project company at
any one time. If customers pay the project company cash at the time of the transaction, receivables
may be very low or zero. If the project company allows customers to pay over time, receivables will be
higher. Moreover, if the local market is such that many customers are likely to pay late, a higher
amount of receivables days should be estimated.
The inventory account on the balance sheet is calculated by multiplying the number of days of inventory
(entered in row 169 of the “Assumptions” worksheet) by the average daily cost of goods sold. It
represents the number of days of product that the company intends to have in stock at any one time.
This will vary significantly depending upon the type of business. Some types of business carry little to no
inventory; others may carry a few months worth.
The payables account on the balance sheet is calculated by multiplying the number of days of payables
(entered in row 170 on the “Assumptions” worksheet) by the average daily costs (both direct and
overhead) of the business. It represents the number of days of cost that the project company owes to
its vendors, labor, etc. at any one time. If vendors have provided the company with relatively generous
payment terms, the days of payables will be larger.
DFC generally requires that projects maintain a restricted cash account that could be used as an
emergency reserve in the event that a short-term liquidity crisis prevents the project from making a
debt service payment. This reserve is generally sized to cover several months of projected debt service
(6-12 months is common), and it is generally funded at the beginning of the project. The user should
enter the assumed number of months of debt service reserve into row 171 of the “Assumptions”
worksheet.
4.10 Cost of Capital Assumptions
Finally, the “Assumptions” worksheet allows the user to enter the equity investors’ required equity
return rate in cell B180. This allows the template to calculate a weighted average cost of capital (WACC)
and determine if the project has a positive net present value.
10User Guide for DFC Financial Projections Model Builder Tool January 10, 2020
5. Review Template Output
Once the user has filled out the relevant sections of the “Assumptions” worksheet (and entered
Historical Data, if applicable), the template will build projected financial statements and perform ratio
analysis. The user may need to execute small (usually cosmetic) changes to the other worksheets for
presentation purposes.
5.1 Income Statement
The “Income” worksheet shows the income, or profit and loss, statement that has been generated using
the assumptions entered on the “Assumptions” worksheet. This worksheet shows the revenues and
operating expenses, both in absolute terms ($000s of USD) and in percentage terms so that the user can
readily see what each product line contributes to total revenue, the percentage of total revenue spent
on each expense line item, and the net profit margin of the project.
Note: If the user has chosen the template configuration for the expansion of an existing business, then
the worksheet will include columns for the most recent actual fiscal year (highlighted in red below). If
the user has chosen the template configuration for a new company/project, those columns will be
hidden.
If the user has not utilized all the rows (for instance, if there are only two lines of business rather than
four or there are unused operating expense rows), then the user may want to hide unused rows for
presentation purposes. Do not delete these rows. Simply hide them by highlighting the row to be
hidden, right-clicking and choosing “Hide” from the right-click menu.
11User Guide for DFC Financial Projections Model Builder Tool January 10, 2020
5.2 Cash Flow Statement, Debt Service Coverage and Net Present Value
The “CashFlow” worksheet has three output sections. The first section is the cash flow statement. It is a
direct cash flow statement generated using the cash-based line items from the Income worksheet and
the “non-income” cash inflow and outflow assumptions from the Assumptions worksheet and the
Balance worksheet (see section 5.3). Some companies/accountants produce an indirect cash flow
statement that starts with net income and adjusts for non-cash items. DFC prefers the direct format
that does not need to include the adjustment of any non-cash items.
Note: If the user has chosen the template configuration for the expansion of an existing business, then
the worksheet will include a column for the most recent actual fiscal year (highlighted in red below). If
the user has chosen the template configuration for a new company/project, that column will be hidden.
If the actual statements were provided in another currency and converted to USD, the historical
statement will only take account of actual cash movements and will factor out year-to-year translation
adjustments.
12User Guide for DFC Financial Projections Model Builder Tool January 10, 2020
The second section of the “CashFlow” worksheet is the debt service coverage analysis. It will show the
project’s ability to pay debt service in each period both at the operating level and on a total cash
available level. As with the section above, the column for historical information will only show if the
template has been configured for an expansion project.
The final section of the “CashFlow” worksheet calculates the overall return on the project and the return
to equity investors. This analysis tells DFC and the investors if the project is economically attractive
given probable project assumptions. If the investors have a definite plan to sell the project at some
future date, then the user may enter a terminal value in the relevant year in row 92.
13User Guide for DFC Financial Projections Model Builder Tool January 10, 2020
5.3 Balance Sheet
The “Balance” worksheet brings together all the flows, cash and non-cash, to show the “accumulation”
of each type of asset and liability/equity at the end of each period. There are a few things to note:
• The column for an actual historical year, the row for “Pre-existing Fixed Assets” and the row for
“Other Long Term Liabilities” will only show if the user has chosen the configuration for an
expansion of an existing company.
• If the user hasn’t used all the line items in the non-current assets, they may hide unused rows.
• If the cash balance (row 7) goes negative, the template will display a warning message.
• If Total Assets do not equal Total Liabilities and Net Worth, the reconciliation in row 55 will show the
error.
14User Guide for DFC Financial Projections Model Builder Tool January 10, 2020
5.4 Sources and Uses Calculation
The “SourcesUses” worksheet is the only output worksheet that may require more than cosmetic
adjustments because there are many circumstances that can affect how the investors and DFC define
“the project” and thus what line items are included in sources and uses. As currently programmed, the
worksheet pulls in:
Uses
• All the capital expenditures from rows 58 to 67 of the Assumptions worksheet.
• The working capital requirement from the period with the greatest working capital increase.
• The debt service reserve funding from the period with the maximum funding level.
• Interest and fees (both DFC and any other lenders) during the interest-only grace period (i.e. during
construction)
• The net cash on the balance sheet at the end of the first period (cash left over after funding the first
year of project costs stands as a proxy for “contingency”).
Sources
• DFC Debt Disbursements
• Other Long Term and Subordinated Debt Disbursements
• New Equity Contributions
If the pre-programmed line items don’t accurately describe the sources and uses for a particular project,
then the user/DFC officer can adjust them as needed.
15User Guide for DFC Financial Projections Model Builder Tool January 10, 2020
5.5 Ratio Analysis
The “Ratios” worksheet calculates standard ratios and other measures that OPIC reviews. These include
Liquidity Ratios, Leverage Ratios, Debt Service Coverage statistics, Profitability statistics and Return
statistics.
If there are other summary calculations that are relevant to a particular project, then the user/OPIC
officer is free to add them.
16User Guide for DFC Financial Projections Model Builder Tool January 10, 2020
Appendix A: Updating Excel Settings
VBA Macros
The IT management of some organizations restricts users’ access to macros because macros from
unknown/non-trusted sources can contain malicious code. To enable the macros in DFC’s template, you
may need to change your Excel Macro Settings (or ask your IT department to change your settings).
Below are the instructions from Microsoft for changing Macro Settings.
17User Guide for DFC Financial Projections Model Builder Tool January 10, 2020
Analysis Toolpak Add-In
Some of the formulas in the template require the Analysis Toolpak add-in to function properly. To check
whether that add-in is active (or to activate it), perform the following steps:
1. Click on the Microsoft Office Button and then click Excel Options.
2. Click on Add-Ins.
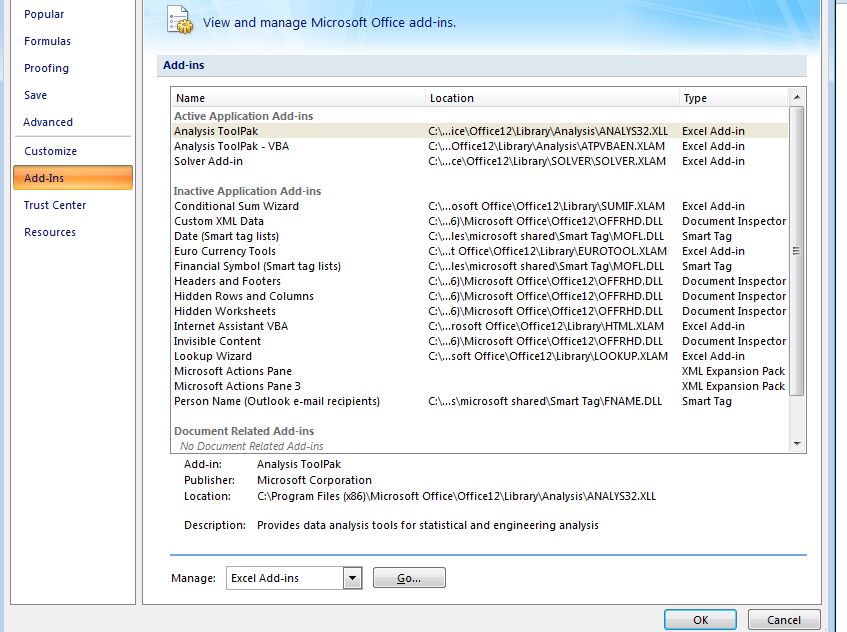
3. If the Analysis Toolpak and the Analysis Tookpak – VBA add-ins are in the “active” list (as shown
below), nothing else is needed. If they are in the inactive list, then click on the Go button next to
“Manage Excel Add-ins.”
4. The add-ins dialogue box (shown below) will appear. Check the boxes next to all the add-ins you
want. Then click OK, and then click OK again when you get back to the Add-Ins screen.
18User Guide for DFC Financial Projections Model Builder Tool January 10, 2020
Appendix B: Ratio Formulas
The liquidity and leverage measures come from items on the “Balance” worksheet.
Quick Ratio: Current Assets - Inventory
Current Liabilities
Current Ratio: Current Assets
Current Liabilities
Debt to Equity Ratio: Total Current Liabilities + Total Non-Current Liabilities
Total Net Worth
Senior Debt to Subordinated Debt and Equity Ratio:
Total Current Liabilities + Total Non-Current Liabilities – Subordinated Debt
Subordinated Debt + Total Net Worth
The cash flow, debt service coverage and return measures come from items on the “CashFlow”
worksheet.
Operating Cash Flow: Row 22 on the “CashFlow” worksheet – “Net Cash after Operations”
Ratio of Operating Cash Flow Available for Debt Service to Interest and Fees:
Net Cash after Operations
Net Interest and Fee Expense
Ratio of Operating Cash Flow Available for Debt Service to Scheduled Principal:
Net Cash after Operations
ST Debt + LT Senior Debt + Subordinated Debt Principal Payments
Ratio of Operating Cash Flow Available for Debt Service to Total Debt Service:
Net Cash after Operations
(Net Interest and Fee Expense) + (ST Debt + LT Senior Debt + Subordinated Debt Principal Payments)
Project Internal Rate of Return (IRR): For each year, calculate: [(Net Cash after Operations) – (Equity
and Debt invested)]. Let’s call this the “Net Outflow/Inflow” for each period. Take the “Net
Outflow/Inflow” series of cash flows and use the Microsoft Excel “IRR” function to find the internal rate
of return of the series.
Project Net Present Value (NPV):
1st Period Net Outflow/Inflow + NPV (Wtd Avg. Cost of Capital, Rest of the Net Outflow/Inflow Series)
Equity Internal Rate of Return (IRR): For each year, calculate: Dividends Paid – Equity Invested. If
there is an expected “terminal value” when the investors exit, add that in during the relevant year. That
series is the “Net Equity Outflow/Inflow.” Use the Microsoft Excel “IRR” function to find the internal
rate of return of the series.
Equity Net Present Value (NPV):
1st Period Net Equity Outflow/Inflow + NPV(Cost of Equity, Rest of the Net Equity Outflow/Inflow Series)
19User Guide for DFC Financial Projections Model Builder Tool January 10, 2020
The profitability statistics come from items on the “Income” worksheet:
Earnings before Interest, Taxes, Depreciation and Amortization (EBITDA) – USD:
Gross Revenues – Cost of Goods Sold (COGS) – Total Operating Expenses (OPEX)
Earnings before Interest, Taxes, Depreciation and Amortization (EBITDA) – %:
Gross Revenues – Cost of Goods Sold (COGS) – Total Operating Expenses (OPEX)
Gross Revenues
Net Income – USD:
Gross Revenues – (COGS + OPEX +Depreciation + Interest and Fee Expense + Income Taxes)
Net Income – %:
Gross Revenues – (COGS + OPEX +Depreciation + Interest and Fee Expense + Income Taxes)
Gross Revenues
20You can also read