Using Angle of Arrival for Improving Indoor Localization
←
→
Page content transcription
If your browser does not render page correctly, please read the page content below
Using Angle of Arrival for Improving Indoor Localization

                                                             Sai Koppula                                   Shivang Singh
                                                    Department of Computer Science                 Department of Computer Science
                                                     University of Texas at Austin                   University of Texas at Austin
                                                    vkoppula@cs.utexas.edu                         shivang.singh@utexas.edu

                                                              Abstract                         we will improve the single stream audio system
                                                                                               by using various AoA estimation techniques to
                                             In this paper, we primarily explore the im-
arXiv:2101.09904v1 [cs.SD] 25 Jan 2021

                                                                                               localize the source of audio. We implemented
                                             provement of single stream audio systems
                                             using Angle of Arrival calculations in both
                                                                                               the MUSIC algorithm on simulated data to iden-
                                             simulation and real life gathered data. We        tify the direction of arrival of multiple sources at
                                             wanted to learn how to discern the direction      once. Furthermore, we tried to use the eigenval-
                                             of an audio source from gathered signal data      ues to determine the number of sources present
                                             to ultimately incorporate into a multi modal      in a simulated environment. Finally, we used the
                                             security system. We focused on the MUSIC          library MUSIC function on captured audio data to
                                             algorithm for the estimation of the angle of      track the change of source angles over time. We
                                             arrival but briefly experimented with other
                                                                                               also explored how we can use machine learning
                                             techniques such as Bartlett and Capo. We
                                             were able to implement our own MUSIC al-          models to further refine our audio system to prop-
                                             gorithm on stimulated data from Cornell. In       erly weight the contributions of each of the data
                                             addition, we demonstrated how we are able         sources. Our final product was a working MUSIC
                                             to calculate the angle of arrival over time in    implementation and improved audio system that
                                             a real life scene. Finally, we are able to de-    can detect the angles of multiple audio sources.
                                             tect the direction of arrival for two separate    We did not quite integrate the improved audio
                                             and simultaneous audio sources in a real life
                                                                                               system into our deficient visual system during the
                                             scene. Eventually, we could incorporate this
                                             tracking into a multi modal system combined
                                                                                               scope of this project.
                                             with video. Overall, we are able to produce
                                             compelling results for angle of arrival calcu-
                                                                                               2     Related Works
                                             lations that could be the stepping stones for a   There are some previous works in localization and
                                             better system to detect events in a scene.        anomaly detection. Other works in the field of
                                                                                               indoor localization use triangulation techniques
                                         1   Introduction
                                                                                               to isolate the location of sound. One recent pa-
                                         Security systems in modern day systems typically      per, Improving AoA Localization Accuracy, did
                                         rely on a single source type to determine an ac-      indoor localization using 5 microphones. They
                                         tion. For example, the Ring doorbell system uses      calculated a probability density for each x,y co-
                                         a video feed but no audio. The Simplisafe Glass       ordinate in the room that they used for their ex-
                                         Break detector uses a simple audio feed that is       periment. Our work tries to do something simi-
                                         refined to identify the unique sound of a window      lar with less intrusions to the indoor setup (and
                                         breaking. We hypothesize that a combination           having only 1 access point for determining the
                                         of common monitoring mediums, such as audio,          angle). Furthermore, our work proposes to use
                                         video, and RF, in a multi-modal system can better     indoor cameras to determine the depth of the ob-
                                         detect a variety of intrusion types. To this end,     ject. This sacrifices some of the accuracy, but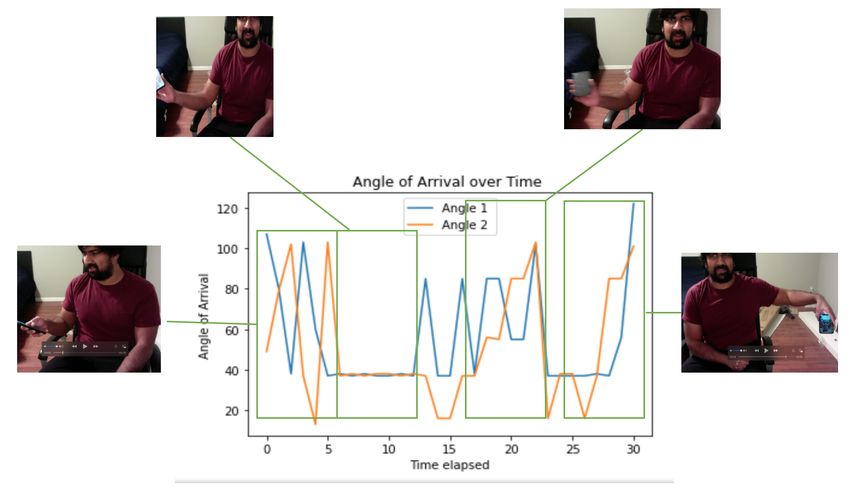
makes the installation and adoption of the system      create a more selective system.
easier to do. (Thoen et al., 2019). Another paper
in this domain is Three-Dimensional Empirical          3.1   AoA
AoA Localization Technique for Indoor Applica-         To understand how to achieve an audio visualiza-
tions. This paper uses factors other than angle        tion, we need to first calculate the angle of arrival.
of arrival in addition to angle of arrival to do lo-   By using an array of antenna elements, we can
calization. Our work does something similar to         gather enough data to determine the direction of
this work. However, our work also examines how         an audio source. For the same source, various
to do angle of arrival for more than one source.       antennas in an array will receive slightly phased
The evaluation in this paper doesn’t look at the       version of similar waves. By constructing a linear
multipath case. Additionally, the paper looks at       and equally spaced array of antennas, we can use
RFID signals, while we look at acoustic signals,       the expected phase perturbation to correlate what
which are more ubiquitous but also prone to more       we expect the angle that would have caused such
noise. (Alma’aitah et al., 2019). Another paper        a set of received signals to be. We can accomplish
looks at doing acoustic based angle of arrival esti-   this by leveraging the fact that we can decompose
mation for robotics. This paper is similar to our      a received signal x as a linear composition of a
paper. However, there is no distinction made for       steering vector S, an amplitude a, and some noise
the multipath case. They do examine the error          n.
in the calculation of the real angles versus the                           x = Sa + n                    (1)
projected angle to do evaluation. (Karanam et al.,
2018)                                                  If we can estimate the steering vector, a function
                                                       of the angle of the signal hitting an antenna ele-
3   Background                                         ment, we can estimate the angle of arrival.

                                                       3.2   MUSIC
The core principal we used throughout our project
was calculating the angle of arrival (AoA) of a        The music algorithm leverages the fact that we
sound source to determine which direction the          can decompose the set of linear equations that
audio signal was coming from. We envisioned            arise from Equation (1) into their eigenvalues and
we could project a visualization onto an accom-        eigenvectors. The lowest values of these eigenval-
panying video feed to illustrate where the sound       ues correspond to the noise eigenvectors. It is also
was originating from. For example, in an instance      known that the noise eigenvectors are orthogonal
when the subject is just waving their hand, the        to the signal sources. We can therefore compose
video feed would show changes but the projected        the two across a sweep of angles to judge the or-
audio visualization would not. However, when           thogonality of the resulting intersection. If the
the subject is snapping their fingers, both the au-    values are close to 0 for a given value of theta,
dio and video visualizations would show activity.      then we must have a good estimate for the angle
By checking for overlapping audio and video dis-       of arrival. Typically, we take the inverse of this
turbances, we hypothesized that we could create a      composition to create a pseudospectrum graph
better security system than one that just relies on    with peaks at each sources angles of arrival. (Dav,
disjoint audio and video feeds. One example of         2013)
where a multi modal system would excel is where
you have multiple sounds in the scene at once. If      3.3   Finding the Number of Sources
multiple audio sources are present, an audio only      The Music algorithm does have a limitation that
system will tend to alert the user continuously        it needs to know in advance the number of au-
once the audio is past a threshold. However, by        dio sources. This is so we can properly divide
mapping the audio onto the scene and correlating       the noise eigenvalues from the signal eigenvalues.
it with the various visual disturbances, we can        However, it is observed that the noise eigenvalues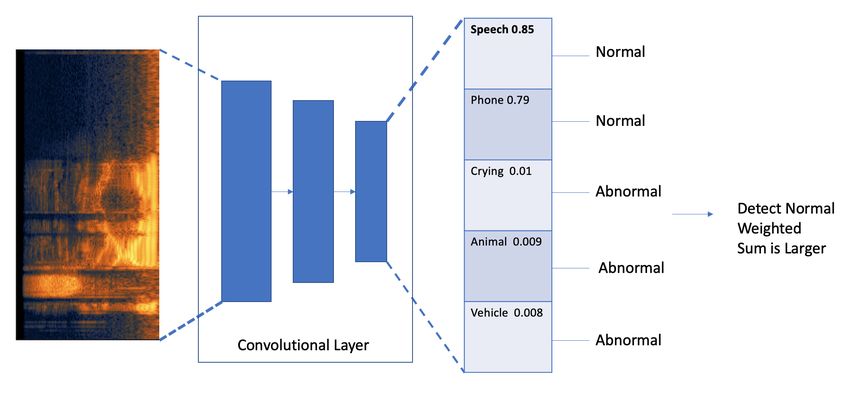
are often quite close to each other while the signal
eigenvalues diverge significantly from the noise
eigenvalues. Various techniques can be used to dy-
namically predict the number of sources from an-
alyzing the clustering of eigenvalues(Dav, 2013).
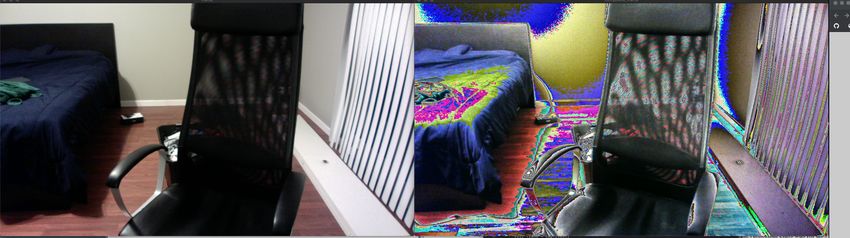
We explored one such approach in our simulated Figure 1: Left is the real time camera input. Right
is the composite image of the past 5 frames. As you
experiments, but we did not succeed.
can see, the composite frame is quite noisy and error
prone.
4 Single Stream Visual System
4.1 Summary showed quite a few deficiencies. First, it was
In order to determine how multimodal input can a noisy image that caused gradients to be present
help improve the performance of the wireless in- even when nothing in the scene was changing.
put, the results and the performance of models The noisy image above shows areas where the
for audio and visual detection were studied in picture is changing despite nothing occurring in
isolation. We explored two different approaches the scene. Second, the visual system suffers from
for our single stream systems. First, we did a real a limited field of view. Any intruder would need
time stream analysis for a visual system to discern to simply avoid the field of view of the camera
if there is a change in the observable scene. to avoid detection. Finally, system was sensitive
to how it was calibrated. We could get a high
4.2 Results number of false positives due to the noisy image
For the purposes of the single stream video sys- and calculation metrics we chose. Whether we
tem, we originally planned to utilize a remote chose to take the number of pixels that changed or
Arduino chip, wired with a camera module. This the average color of the image as a whole, there
Arduino set up would have a wireless component wasn’t a reliable metric to make a robust system
which would transmit audio and visual data to a from just a video stream. Furthermore, the sys-
server setup. However, the latency and throughput tem could only detect changes but it could not
of this configuration was quite poor. For the sake differentiate between different types of changes.
of getting meaningful results, we transitioned to In fairness, the audio system by itself, without
using the webcam on our computer. Here, we any machine learning enhancements, suffers from
were able to stream our computer’s webcam into this as well.
a python application and manipulate the data as
5 Audio System
needed to determine whether an event occurred.
Our algorithm was fairly simple. We kept track The audio system was the main focus of our
of a small history of frames and averaged them to- project. Here we explored how to refine an audio
gether to create a composite frame. We then com- system using AoA techniques including MUSIC
pared the current frame to the composite frame to to get a better sense of what was happening in the
see if it differed enough to flag an event. There scene over time. We first refined our techniques
are a few tunable knobs that can help calibrate on simulated data and then moved onto our actual
the system such as number of frames that con- physical setup.We used various python libraries to
tribute to the composite image, the tolerance of a read our .wav files and transform them into numpy
pixel to be different between the composite frame arrays that could be manipulated and calculated
and current frame and the percentage of pixels on. This results in our current implementation
that can be above that tolerance before an event being unable to handle audio in real time. While
is flagged. You can see from Figure 1 that our the algorithm’s themselves are real time, we need
composite image is quite noisy. a post processing step that is not yet automated to
Overall, our stand alone video system bring the data into a manipulative form.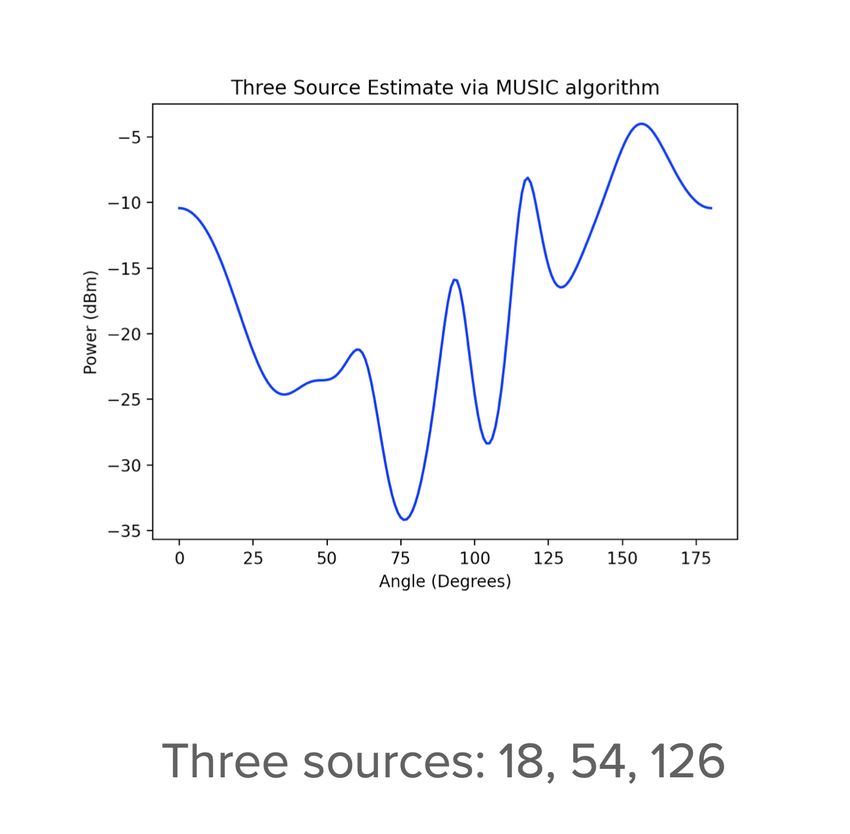
5.1   Simulation Setup
Our simulation setup used data harvested from
Cornell University. Here we procured data simu-
lated on a system of a linear array of antennas that
then recorded a varying number of signals. We
were able to implement our own music algorithm
and plot the data against a sweep of angles to find
the angle of arrival.

5.2   Simulation Results
For implementing the MUSIC algorithm, we did
the standard approach of first creating a correla-
tion matrix and then partitioning the noise eigen-
values. We then created pseudospectrum sweeps
of the possible angles on the inverse of the or-
thogonality of the signals and noise eigenvectors.
The results are plots below which show the angles
from where the sources are from. We tried our al-
gorithm on simulation data for both three sources      Figure 2: 3 Source Simulation Data Plot
and two sources. The received signals were from
eight antennas in a linear equally spaced array.
From the plots below you can see our algorithm
partially works for 3 sources. We have peaks near
the ground truth values of 18, 54, and 126 de-
grees. However, we also have extraneous peaks
above our 3 source angles which suggests our
implementation is not robust for 3 sources. We
got much better results for the two source set of
simulation data. Here we have two clear peaks
near the ground truth values of 54 and 126 degrees.
This demonstrated that our MUSIC algorithm was
working for at least two sources as we were able
to get no extraneous peaks above the ground truth
peaks. The results of our experiments from simu-
lation data were good first steps in understanding
the MUSIC algorithm for AoA calculation.

5.3   Physical World Setup
Our experimental setup uses a ReSpeaker Mic Ar-
ray 2.0 . It is a microphone array that can connect
to a computer using USB and it has four micro-
phones in a two by two grid. We recorded with          Figure 3: 2 Source Simulation Data Plot
all four microphone channels at once. We tried a
variety of different techniques for recording from
this component including using various python
modules. However, we ultimately settled on using
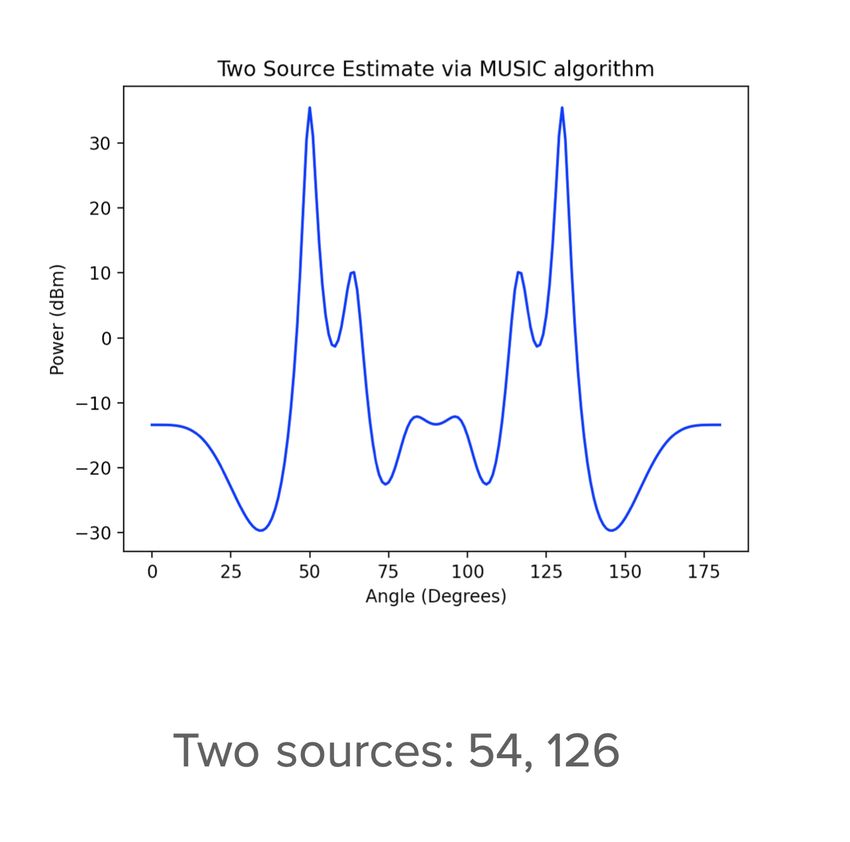
Figure 4: This figure illustrates the localization setup
that was used for data gathering. The rooms dimen-
sions are listed. Additionally, the AP’s location rela-
tive to the room is also described. The AP used was
the ReSpeaker Mic Array 2.0, which carried an array
of 4 microphones positioned in a square formation on
the ship. The illustration also shows how the algo-
rithm deployed may project the angle of arrival in the
real environment.

the Audacity program to record all channels at
once and then post processing each microphone’s
audio into a separate .wav file. This allowed to
keep the signals separated for when we applied
our MUSIC algorithm’s on top of them.

5.4   Physical World Methodology
Each of these input channels has thousands of
samples, which correspond to the amplitude and             Figure 5: This figure illustrates the pseudo spectrum
                                                           generated by the MUSIC algorithm which went to cal-
the duration of a single wavelength of sound. Us-
                                                           culate the angle of arrival for a particular time point.
ing the input channels, the angle of arrival for           In this case the time point occurs at second 18 (high-
each second was calculated. This was done by               lighted by the green box). One may notice that the
dividing the total number of samples by the sam-           pseudo-spectrum may be having three peaks instead
pling rate, which in this case was 48 kHz. This            of two. However, due to the scaling of the figure, the
gave us blocks of samples that were of the size of         difference between the first and third peak looks neg-
the sampling rate. Each of these blocks (which             ligible. The third peak is larger.
were of the size 48,000) was analyzed to deter-
mine the angle of arrival of the sound at that lo-
cation. The number of sources of audio in each
interval was set to the number of sources that were
used in the demonstration. For example, in our
second experiment where we use a phone and a
subject, we set the number of audio sources or the
number of multi-path for the MUSIC algorithm to
2. We experimented with calculating the number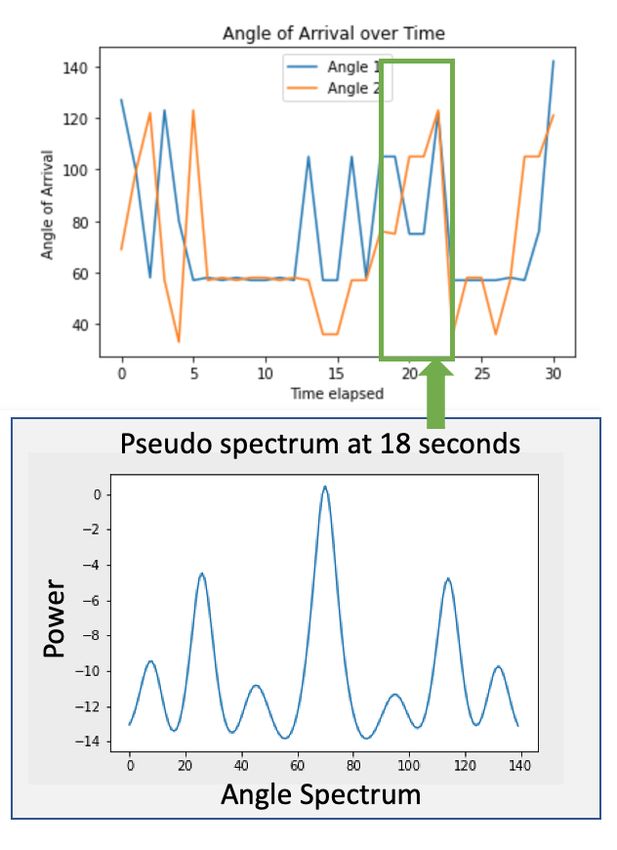
other visualization of our system is presented in
                                                              Figure 5, where we can examine the individual
                                                              pseudospectrum at a given time step (in this case
                                                              the 18th sample in the time series). This exam-
                                                              ple shows how the angle of arrival in the multi
                                                              path setting was derived by looking at the signal
                                                              with the most power. These figures can give us a
                                                              qualitative measure of how well the system was
                                                              working. Figure 6 evaluates how well the MUSIC
                                                              algorithm and our implementation works in the
Figure 6: This figure illustrates the evaluation of the
                                                              real world. It shows the location of the subject
system that was developed as part of this project. This       over time as well as the angle of arrival (single
figure in contrast to the earlier figure is tracking a sin-   source in this case). We see that that the location
gle source. This is one of the experiments that was           of the subject is well tracked. The RMSE measure
carried out. The location of the subject was estimated        would be a good way of evaluating the system.
by manually examining the location of the subject in          However, since there was no baseline system to
the video. In this experiment, the subject was clap-          compare it to, it is not presented here.
ping and so one can see that the angles estimated
are very discrete (as sound was created for a roughly         5.6    Extending Beyond Audio (making it
small duration of time). Regardless, the angles still
                                                                     multi modal)
follow the location of the subject relative to the cam-
era. In order to see what activity is going on please         In order to make the system more precise with
see the video in our presentation.                            regards to localization, we propose to use depth as
                                                              a tool for gauging where the subject or the source
                                                              of sound is. Figure 3 can be seen as an illustration
of sources, however the results were not reliable.
                                                              of this concept. So far, our system only suggests
The output of the MUSIC algorithm is a pseudo-
                                                              angles of arrival. However, by using two cameras
spectrum in which the signal strength of each
                                                              our system could sense the depth of the object.
angle is projected. A series of signal strengths,
                                                              Given information on depth and using the sin
one for each steering vector corresponding to each
                                                              trigonometric function, it would be possible to
theta, is returned. We examined the output of the
                                                              evaluate the x and y positions of the sound.
algorithm and took the angle corresponding to
the highest magnitude signal as the angle of ar-              6     Leveraging Neural Networks
rival. When we had more than 2 sources of audio,
we looked at the highest and the second highest               6.1    Event Classification
power in the MUSIC spectrum instead of looking                After the event detection, a classification model
at the maximum power.                                         can be used to evaluate if the event was signifi-
                                                              cant or not. This measure is to further decrease
5.5   Physical World Results                                  the amount of false positive detection of the sys-
In order to evaluate the effectiveness of the lo-             tem. It does this by adding using AI to further
calization, experiments were done for both the                filter out positive event detection generated by
single source audio case and the multi-path au-               the averaging of the frames. The classification
dio case. Figure 7 illustrates the experiment that            system would run after the event detection sys-
was conducted for the multi-source case. In that              tem runs. This is because polling and running
experiment, a phone and a subject both talked at              intervals of sound and visual inputs is relatively
the same time. The MUSIC algorithm was used                   expensive (as you have to constantly be making
to determine the angles of arrival. The two most              passes through the network). This pretrained deep
prominent angles are plotted in the figure. An-               learning model was a Convolutional Neural Net-
Figure 7: This figure illustrates the use of the multi path MUSIC algorithm for determining the angle of arrival
for multiple sources. There are two sources of sound in our scenario: the phone, which is playing audio and
the subject themselves, who is talking out loud. The images show what the subject was doing at that particular
moment. The graph illustrates the angles of arrival with the highest magnitude determined by the MUSIC
algorithm. It is important to note that it only illustrates the two angles at each time step but does not determine
if the angle is of the subject or the phone. In the first interval there seems to be a lot of noise, with the subject
picking up his phone and orienting himself. In the second interval the subject is talking, but is hard to hear over
the sound of the phone. Both the phone and the subject are stationary (hence why it seems to just be predicting
the angle of the phone). In the third step, the subject is moving the phone as well as moving his chair. This
can be seen by the orange angle shifting from the an angle smaller than the blue to larger. At the last step, the
subject quickly moves the phone to the right of him, which is represented by a quick movement in the blue and
orange lines and the angle of the blue line points heavily to the right (probably the angle of the phone).
work (CNN), trained by researchers at Google               we couldn’t figure out how to split out the chan-
(Pete Warden, 2017). The network takes in an au-           nels in real time so we couldn’t put the data in a
dio stream and outputs a probability distribution          form our algorithms could understand. Second,
over the tasks it believes took place in the audio.        we could take the angle of arrival calculations
These predefined tasks will then be curated for the        in real time and project onto the screen a visual-
project to map to two output classes (Abnormal             ization of where the audio is coming from. This
or Normal). The Normal class was for the normal            would help us combine our audio system with our
background sounds normal to systems such as                visual system to create more informed decisions
human speech. Abnormal class was for anoma-                on intrusion detection. It would also be further vi-
lies and tasks seen as non-background. Similar to          sual confirmation that our AoA calculations have
the audio input processing, a deep learning mode           merit. We did compare our results to ground truth
to detect the task being done in a specific video          values in our simulation exercise but it is more
interval can be used but we did not implement              pleasing to visually see the result projected onto
in time for the writing of this paper. Predefined          real world data that we gathered. Third, we can
tasks would be curated to the same categories as           combine our audio-visual system with the ML
the audio model. The results of the audio and              model we experimented with to not only detect
visual models can be used as a baseline off of             an event but also classify it. A classification of an
which multimodal systems can be analyzed from.             audio event combined with a detection of an event
                                                           in the multi modal system can further inform a
                                                           security system on what to do and whether or not
                                                           to alert the user.

                                                           6.3   Challenges
                                                           Our primary challenge stemmed from the fact
                                                           that we wanted to do a project that had a hard-
                                                           ware component. We wanted to do our own data
                                                           gathering and that required research into various
Figure 8: This diagram illustrates how adding classifi-
cation to the audio input, the model is able to be more    hardware components. Our initial attempts failed
robust about detecting less false positives in event de-   as the Arduino cam and board did not provide suf-
tection. It is able to be more precise about filtering     ficient data throughput for our visual system. Our
out data points                                            audio system ran into a different set of issues as
                                                           we needed to find a way to get an array of micro-
                                                           phones to record simultaneously. Eventually, we
6.2   Future Work                                          found the ReSpeaker hardware component that
Our work was primarily focused on AoA and un-              allowed us to do that simply. It was an interest-
derstanding the theory and application of it. We           ing challenge figuring out how to sample from
were able to get some compelling results which             the hardware component properly. We had con-
showed that we could track the change of angle             trol over variables such as the sample rate and
of arrival over time in our audio system. Given            it demonstrated that there was more to consider
time, we could make a few key enhancements to              than just pressing record when dealing with signal
make a better system. First, we can make our               gathering in the field.
audio processing real time. Instead of recording
to audacity, we could go to a lower layer in our           6.4   Conclusions
computer’s firmware and read the individual chan-          Overall, the project was a good learning experi-
nels, synchronize them, and pass them through to           ence in primarily implementing an algorithm to
our computational system. We actually do have              detect Angle of Arrival of multiple signals in a
most of this working already but the problem is            real world scenario. We were able to implement
our own Music algorithm on simulation data for
multiple sources. We were also able to perform
angle of arrival calculation over time for our real
life gathered data. The project opened us up to
a variety of techniques and challenges in signal
based research and was rewarding.
References
2013. Direction of arrival estimation. University of
Toronto.
A. Alma’aitah, Baha’ A. Alsaify, and Raed Bani-
Hani. 2019. Three-dimensional empirical aoa
localization technique for indoor applications.
Sensors (Basel, Switzerland), 19.
Chitra R. Karanam, B. Korany, and Y. Mostofi.
2018. Magnitude-based angle-of-arrival estima-
tion, localization, and target tracking. 2018 17th
ACM/IEEE International Conference on Infor-
mation Processing in Sensor Networks (IPSN),
pages 254–265.
Google Brain Team Pete Warden, Software Engineer.
2017. Launching the speech commands dataset.
Google AI Blog.
Bart Thoen, S. Wielandt, and L. D. Strycker. 2019.
Improving aoa localization accuracy in wireless
acoustic sensor networks with angular probabil-
ity density functions. Sensors (Basel, Switzer-
land), 19.You can also read