Using Environmental Tracers to Characterize Groundwater Flow Mechanisms in the Fractured Crystalline and Karst Aquifers in Upper Crocodile River ...

Page created by Tyrone Harrington
 
CONTINUE READING
Using Environmental Tracers to Characterize Groundwater Flow Mechanisms in the Fractured Crystalline and Karst Aquifers in Upper Crocodile River ...
hydrology
Article
Using Environmental Tracers to Characterize Groundwater Flow
Mechanisms in the Fractured Crystalline and Karst Aquifers in
Upper Crocodile River Basin, Johannesburg, South Africa
Khahliso Leketa †              and Tamiru Abiye *

                                          School of Geosciences, University of the Witwatersrand, Private Bag X3,
                                          Johannesburg P.O. Box Wits 2050, South Africa; kleketa@gmail.com
                                          * Correspondence: tamiru.abiye@wits.ac.za; Tel.: +27-76-282-0659
                                          † Current Affiliation: Department of Geography and Environmental Science, Faculty of Science and Technology,
                                            National University of Lesotho, Maseru P.O. Roma 180, Lesotho; lesotho.kleketa@gmail.com or
                                            kc.leketa@nul.ls.

                                          Abstract: Environmental isotope tracers were applied in the Upper Crocodile River Basin, Johan-
                                          nesburg, South Africa, to understand the groundwater recharge conditions, flow mechanisms and
                                          interactions between surface and subsurface water. Stable isotope analysis indicated that recharge
                                into the fractured quartzite aquifer occurs through direct mechanisms. The high variability in the
                                   stable isotope signature of temporal samples from Albert Farm spring indicated the importance of
Citation: Leketa, K.; Abiye, T. Using     multiple samples for groundwater characterization, and that using a single sample may be yielding bi-
Environmental Tracers to                  ased conclusions. The observed inverse relationship between spring discharge and isotope signature
Characterize Groundwater Flow             indicated the traces of rainfall amount effect during recharge, thereby suggesting piston groundwater
Mechanisms in the Fractured               flow. It is deduced that a measured discharge value can be used in this relationship to calculate the
Crystalline and Karst Aquifers in         isotopic signature, which resembles effective rainfall. In the shallow alluvial deposits that overlie the
Upper Crocodile River Basin,              granitic bed-rock, piezometer levels and stable isotopes revealed an interaction between Montgomery
Johannesburg, South Africa.
                                          stream and interflow, which regulates streamflow throughout the year. This suggests that caution
Hydrology 2021, 8, 50.
                                          should be taken where hydrograph separation is applied for baseflow estimates, because the stream
https://doi.org/10.3390/
                                          flow that overlies such geology may include significant interflow. The hydrochemistry evolution was
hydrology8010050
                                          observed in a stream fed by karst springs. As pH rises due to CO2 degassing, CaCO3 precipitates,
Academic Editors: Brindha                 thereby forming travertine moulds. The values of saturation indices that were greater than zero in all
Karthikeyan and Tadeusz                   samples indicated supersaturation by calcite and dolomite and hence precipitation. Through 14 C
A. Przylibski                             analysis, groundwater flow rate in the karst aquifer was estimated as 11 km/year, suggesting deep
                                          circulation in karst structures.
Received: 21 January 2021
Accepted: 11 March 2021                   Keywords: recharge conditions; amount effect; environmental isotope tracers; residence time;
Published: 19 March 2021                  fractured quartzite aquifer; karst aquifer; Johannesburg; South Africa

Publisher’s Note: MDPI stays neutral
with regard to jurisdictional claims in
published maps and institutional affil-   1. Introduction
iations.
                                               Groundwater plays a central role in socio-economic development of regions with
                                          semi-arid/arid climate [1,2]. Moreover, its continual discharge through springs and river
                                          beds contributes to stream flow, and apart from the melting of snow in cold regions [3,4],
                                          groundwater discharge, also called baseflow, is often the main reason why perennial
Copyright: © 2021 by the authors.
                                          streams are able to sustain flows in dry seasons [5,6]. However, baseflow occurrence is quite
Licensee MDPI, Basel, Switzerland.
                                          uncommon in arid and semi-arid regions because of the difficulty of direct recharge [1,7,8].
This article is an open access article
                                          The difficulty is caused by high evapotranspiration of water that has infiltrated the soil,
distributed under the terms and
                                          thereby limiting percolation, such that actual recharge becomes restricted to line and
conditions of the Creative Commons
                                          point surface water channels such as streambeds and reservoir basins [1,9]. Partly due to
Attribution (CC BY) license (https://
                                          unfavoured direct recharge, the water table is usually deep, thereby enhancing focused
creativecommons.org/licenses/by/
4.0/).
                                          recharge on any surface water, leading to ephemeral streams [1,10]. Because baseflow

Hydrology 2021, 8, 50. https://doi.org/10.3390/hydrology8010050                                          https://www.mdpi.com/journal/hydrology
Using Environmental Tracers to Characterize Groundwater Flow Mechanisms in the Fractured Crystalline and Karst Aquifers in Upper Crocodile River ...
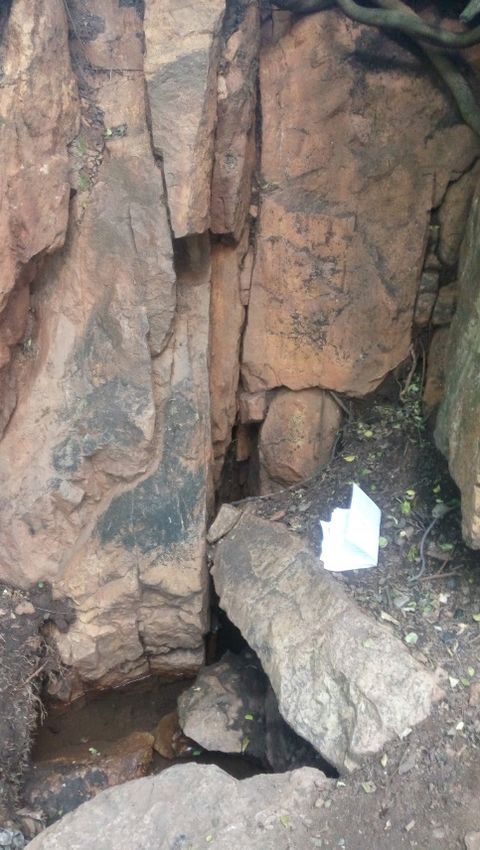
Hydrology 2021, 8, 50                                                                                             2 of 22

                        occurrence is not often expected in arid and semi-arid regions, the existence of perennial
                        springs and streams in this climatic setting calls for a need to assess recharge and flow
                        mechanisms associated with them, in order to support decision making for sustainable
                        groundwater management of the aquifer.
                              The discharge of water from perennial springs contributes to stream flows in the
                        form of baseflow. However, like all other terrestrial water resources, the spring flows
                        are dependent on rainfall as a source of recharge, either as diffuse (direct) recharge from
                        rainfall or as focused (indirect) recharge from a surface water body [7,10]. In some cases,
                        the physical nature of the recharge area and the aquifer play a more significant role than
                        the amount of rainfall in controlling the amount of recharge [2]. Horton [11] indicated
                        that during a rainfall event, the amount of infiltration decreases with time until a constant
                        infiltration rate is reached. The constant rate depends on the type of soil, such that clay soils
                        attain a lower constant infiltration rate, while the open-textured sandy soils have a higher
                        constant rate [11]. Once a constant rate is reached, any changes in rainfall, such as increase
                        in intensity and amount, will not cause an increase in infiltration but will contribute to
                        ponding and formation of overland flow [11,12]. On the other hand, infiltration that occurs
                        through the fractures of a geological outcrop may occur rapidly and attain a much higher
                        constant infiltration rate.
                              The projected changes in climate variables indicate a decreased rainy season [13] and
                        increased intensity of daily rainfall, which in its nature, often enhances runoff rather than
                        recharge [14], although in some cases it may promote rather than restrict recharge [15].
                        It therefore becomes necessary to understand how recharge would behave locally un-
                        der the extremely high-intensity daily rainfall, in particular, by assessing the extent of
                        recharge dependence on rainfall amount. Such assessments have been done using longterm
                        groundwater levels and rainfall data in various parts of the world with different geological
                        settings [15–17]. In this study, the stable isotopes of water (δ18 O and δ2 H) are used to
                        understand the recharge mechanism, air temperatures at the time of recharge and the de-
                        pendence of recharge amount and spring discharge on the amount of rainfall. Additionally,
                        the physicochemical parameters are used to understand the morphology of the streambed
                        downstream of the karst springs.
                              Chemical and environmental isotope tracers have been found to be quite useful in
                        determining the provenance of water [18,19]. Stable isotopes, in particular, are able to
                        maintain their signature once recharge occurs and to store information about the atmo-
                        spheric conditions that existed prior to recharge [19]. The d-excess, which is the extent of
                        deviation from the meteoric water line (MWL) or Y-intercept, is able to provide information
                        about the temperature and humidity conditions at the sea surface during primary evapora-
                        tion, humidity along the moisture trajectory and the occurrence of secondary evaporation
                        (re-evaporation) in the sub-cloud [18,20].
                              The aim of this study is to understand the groundwater recharge conditions, the flow
                        mechanisms and the interaction between surface and subsurface water in the crystalline
                        and karst aquifers. Additionally, the evolution of hydrochemistry and travel time in the
                        karst aquifers are assessed using the physicochemical parameters and 14 C, respectively.
                        The results from this study shall be useful to water researchers interested in the use of
                        environmental and chemical isotopes to assess groundwater recharge and its interaction
                        with surface water.

                        2. Description of the Study Area
                             The study area is located in the Upper Crocodile River Basin (UCRB) with the city
                        of Johannesburg located in the south at the head waters of the catchment (Figure 1). The
                        annual rainfall computed from the Johannesburg Botanical garden weather station (JHB
                        Bot Tuin weather station; Figure 1) ranged between 380 mm and 907 mm for the period
                        between 1997 and 2016, while the mean annual air temperature ranged between 15.2 ◦ C
                        and 18.9 ◦ C for the same period. The UCRB predominantly receives rainfall in summer
                        (October to April) in the form of convective rainfall, with a prevalence of cumulonimbus
Using Environmental Tracers to Characterize Groundwater Flow Mechanisms in the Fractured Crystalline and Karst Aquifers in Upper Crocodile River ...
Hydrology 2021, 8, 50                                                                                                          3 of 22

                                   thundershowers and occasional frontal rainfall [21]. Tyson et al. [22] stated that the different
                                   origins of rainfall moisture for Southern Africa are the semi-permanent anticyclones that
                                   are located in the Atlantic Ocean and the Indian Ocean and the Intertropical Convergence
                                   Zone (ITCZ), while White and Peterson [23] and Renwick [24] also identified the high
                                   latitudes towards the Antarctic region. Additionally, van Wyk et al. [25] indicated that
Hydrology 2021, 8, x FOR PEER REVIEW                                                                                        4 of 23
                                   rainfall in the Southern African region mainly originates from the ITCZ in summer and the
                                   Atlantic Ocean in winter.

                                                                        Malapa area

     Figure
      Figure1.1.Location
                 Locationmap
                           mapofofthe
                                   thestudy
                                       studyarea
                                             areaininthe
                                                      theUpper
                                                          UpperCrocodile
                                                                CrocodileRiver
                                                                          RiverBasin
                                                                                Basinand
                                                                                      andthe
                                                                                          theSouth
                                                                                              SouthAfrican
                                                                                                    Africanmap
                                                                                                            mapalso
                                                                                                                alsoshowing
                                                                                                                     showingthe
                                                                                                                             the
     positions  of Albert Farm  spring  and the isotope  sampling points.
      positions of Albert Farm spring and the isotope sampling points.

                                       The regional geology (Figure 1) consists of the rocks from Witwatersrand Supergroup,
                                                                                     (a)
                                 Ventersdorp Supergroup, Karoo Supergroup and Transvaal Supergroup overlying the
                                 Basement Complex (granite, gabbro, serpentinite). The UCRB consists of three experimental
                                 sites, which are the Albert Farm spring in Johannesburg city, Roosevelt Park along the
                                 Montgomery stream and the Malapa area within the Cradle of Human Kind World Heritage
                                 site, which is located about 40 km north of Johannesburg.
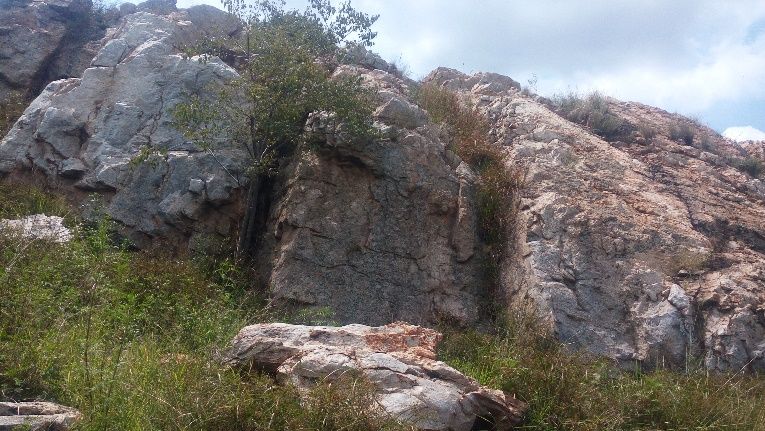
                                       As can be seen in Figure 1, the Albert Farm spring is underlain by the rocks of the
                                 West Rand Group (Hospital Hill Formation) from the Witwatersrand Supergroup. The
                                 West Rand group consists of quartzites, reddish and ferruginous magnetic shales, gritty
                                 quartzites and conglomerate horizons [26,27]. Figure 2a shows the typical fractures that
                                 are located on the southern boundary of the UCRB from which the Albert Farm spring
                                 discharges. These fractures are common in the area, and they spread across the catchment
                                 boundary. The local geology at the Albert Farm spring consists of the highly fractured
                                 quartzites where the spring emerges under gravity at the contact between the overlying
                                 fractured quartzite (Figure 2b) and the underlying low permeability shale. The Albert
                                 Farm spring is a perennial source of water, and it discharges into the Montgomery stream,
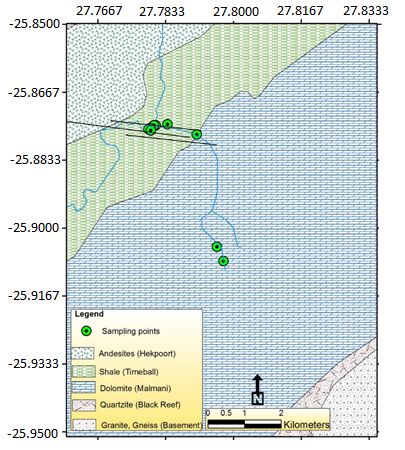
Using Environmental Tracers to Characterize Groundwater Flow Mechanisms in the Fractured Crystalline and Karst Aquifers in Upper Crocodile River ...
Malapa area
Hydrology 2021, 8, 50                                                                                                                    4 of 22

                                   which in turn discharges into the Jukskei River flowing to the north direction and draining
                                   the city of Johannesburg (Figure 1). Because of the insignificant primary porosity and
                                   permeability of quartzite [28], it is evident that the perennial flows from Albert Farm spring
                                   rely on secondary porosity that     is characterized by the intense tectonically induced and
                                                                 Hydrology 2021, 8, x FOR PEER REVIEW
                                   fold-associated fractures that stretch regionally.

                                                                                                        (b)

          Figure 1. Location map of the study area in the Upper Crocodile River Basin and the South African map also showing the
          positions of Albert Farm spring and the isotope sampling points.

                                                                                           (a)

                                                                                                      Figure 2. The quartzite on the southern boundary of
                                    Figure 2. The quartzite on the southern boundary of the UCRB (a) and the fractured quartzite rocks
                                                                                               rocks that host the Albert Farm spring (b).
                                    that host the Albert Farm spring (b).
                                                                                                           Roosevelt Park is located about 4 km dow
                                        Roosevelt Park is located about 4 km downstreamthat   of Albert    Farmbyspring
                                                                                                  is underlain                in an of
                                                                                                                      the granites   areathe Baseme
                                   that is underlain by the granites of the Basement Complex,
                                                                                            structure which
                                                                                                         made is of aweathered
                                                                                                                      massive and dome- fractured A
                                   like structure made of weathered and fractured Archaean  sectedgranitic     bodies
                                                                                                     by fractures,    and[26,29].
                                                                                                                            together Itwith
                                                                                                                                         is the wea
                                   intersected by fractures, and together with the weathered     zones,conductivity.
                                                                                            hydraulic      fractures form   The areas    of of san
                                                                                                                                 deposition
                                   high hydraulic conductivity. The deposition of sand andformed
                                                                                             gravel aon shallow    intergranular
                                                                                                           the granite     bedrockaquifer
                                                                                                                                      has along t
                                   formed a shallow intergranular aquifer along the river banks   The   Malapa area is underlain by Transva
                                                                                                     [26].
                                                                                            maniwhich
                                        The Malapa area is underlain by Transvaal Supergroup,       dolomites    that have
                                                                                                           consists    of theformed
                                                                                                                               Malmani karst aquifer
                                                                                            ites (Figure   1). The   hydraulic
                                   dolomites that have formed karst aquifers, and the Timeball Hill shale and quartzites         conductivity   is hi
                                                                                            the dolomites. There are numerous springs (F
                                   (Figure 1). The hydraulic conductivity is highly enhanced by the presence of karsts in the
                                                                                            within the depressions and the big springs that
                                   dolomites. There are numerous
                                                               4
                                                                    springs (Figure 3) that can be seen as wet patches within
                                                                                            Farm and Nouklip springs). The upslope sprin
                                   the depressions and the big springs that are characterized
                                                                                            aboutby130
                                                                                                     highL/syields
                                                                                                             with a(the      Nash Farm
                                                                                                                       catchment   area of about 11
                                   and Nouklip springs). The upslope spring is Nash Farmthe   spring    (SP1),   which     yields
                                                                                                 geological map in the Malapa      aboutarea and the
                                   130 L/s with a catchment area of about 11.6 km2 [30]. Figure
                                                                                            flows from3 presents
                                                                                                           Nash Farm an extract    of the
                                                                                                                          spring into    Grootvlei s
                                   geological map in the Malapa area and the locations of the
                                                                                            pooldolomitic
                                                                                                   at SP2 andsprings.
                                                                                                                 then flowsWater   flows 250 m, af
                                                                                                                               for about
                                   from Nash Farm spring into Grootvlei stream for about    At200    m and
                                                                                                2.2 km         finally forms
                                                                                                          downstream              a pool
                                                                                                                           is Nouklip     spring (SP
                                                                                            spring in the
                                   at SP2 and then flows for about 250 m, after which it infiltrates         area with
                                                                                                          through          about 143 At
                                                                                                                        a sinkhole.     L/s [30]. The
                                   2.2 km downstream is Nouklip spring (SP3). Nouklip springhas a isyield
                                                                                                      the of  4.5 L/s and otherspring
                                                                                                           highest-yielding        smaller springs
                                   in the area with about 143 L/s [30]. The downstream springs include SP4, which hasstream.
                                                                                            all discharging     into  the  Grootvlei      a     Mou
                                                                                            are  observed    100  m   downstream
                                   yield of 4.5 L/s and other smaller springs whose yields range from 0.05 L/s to 1 L/s, all         of   Nouklip  sp
                                                                                            SP6 to SP9 are located downstream of the trave
                                   discharging into the Grootvlei stream. Moulds of travertine of about 1.5 m thickness are
                                   observed 100 m downstream of Nouklip spring on Grootvlei stream bed. The springs SP6
                                   to SP9 are located downstream of the travertine moulds.

                                                                                                                                     5
Using Environmental Tracers to Characterize Groundwater Flow Mechanisms in the Fractured Crystalline and Karst Aquifers in Upper Crocodile River ...
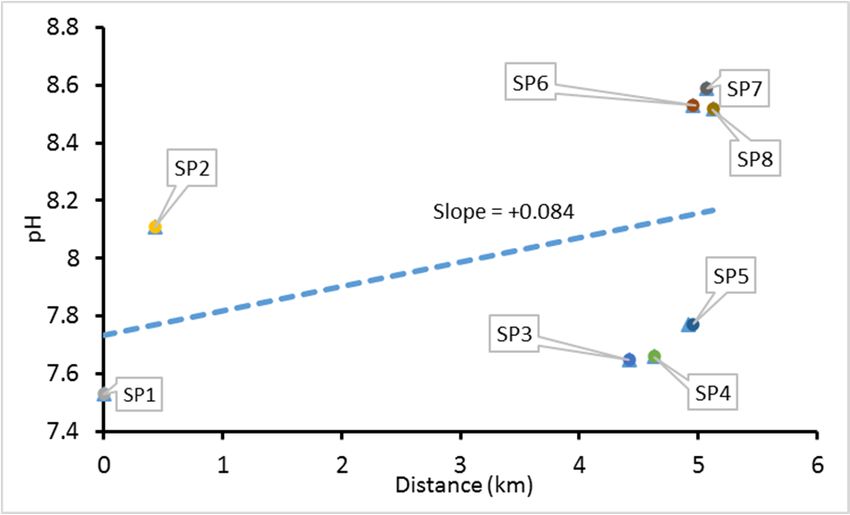
Hydrology 2021, 8, 50                                                                                                                  5 of 22
Hydrology 2021, 8, x FOR PEER REVIEW                                                                                                   6 of 23

                                                                    SP4
                                                                          SP3 Nouklip spring

                                                                             Grootvlei stream channel

                                                                       SP2

                                                                             SP1 Nash Farm spring

                                Figure 3. Geological map of the Malapa area showing some of the dolomitic springs (SP1, SP2, SP3
                                and SP4).

                                3. Materials
                                3. Materials and
                                               and Methods
                                                     Methods
                                      The Albert                                                                             18          2 H)
                                      The  Albert Farm
                                                    Farm spring
                                                            spring (Figure
                                                                     (Figure 1)1) was
                                                                                  was sampled
                                                                                         sampled forfor stable
                                                                                                          stable isotope
                                                                                                                  isotope (δ
                                                                                                                           (δ18OO and
                                                                                                                                   and δδ2H)
                                analysis on
                                analysis  on monthly
                                              monthly basisbasis over
                                                                 over aa period
                                                                         period ofof 25
                                                                                      25 months
                                                                                          months between
                                                                                                   between JuneJune 2016
                                                                                                                      2016 and
                                                                                                                            and June
                                                                                                                                  June 2018.
                                                                                                                                        2018.
                                The  periodic    samples    were   collected  to assess   temporal     variability   of
                                The periodic samples were collected to assess temporal variability of the stable isotopethe stable   isotope
                                signature in
                                signature   in the
                                               the fractured
                                                     fracturedquartzite
                                                                 quartziteaquifer.
                                                                             aquifer.The Thestable
                                                                                              stableisotope
                                                                                                       isotope   samples
                                                                                                              samples      were
                                                                                                                         were      collected
                                                                                                                                collected   in
                                in 10  mL  glass   bottles  and   carefully  capped     to ensure   that   there  were
                                10 mL glass bottles and carefully capped to ensure that there were no entrapped air bub- no entrapped     air
                                bubbles, which can cause sample evaporation. The surface velocity method [6,31] was used
                                bles, which can cause sample evaporation. The surface velocity method [6,31] was used to
                                to estimate the discharge of the spring using a styrofoam piece as a surface floater. The
                                estimate the discharge of the spring using a styrofoam piece as a surface floater. The dis-
                                discharge measurement was done over a period of 14 months between February 2017 and
                                charge measurement was done over a period of 14 months between February 2017 and
                                May 2018. Because the channel is underlain by an irregular hard and fresh quartzite, the
                                May 2018. Because the channel is underlain by an irregular hard and fresh quartzite, the
                                maximum length of the straight channel that was available for measurements was less than
                                maximum length of the straight channel that was available for measurements was less
                                2 m. In order to account for the roughness and size of the stream, the discharge calculated
                                than 2 m. In order to account for the roughness and size of the stream, the discharge cal-
                                from the surface velocity method was adjusted by multiplying it with a correction factor of
                                culated from the surface velocity method was adjusted by multiplying it with a correction
                                75% [6].
                                factor of 75% [6].
                                      Two piezometers were constructed in Roosevelt Park along the Montgomery stream
                                      Two piezometers were constructed in Roosevelt Park along the Montgomery stream
                                (Figure 1). Piezometer PZ1 was constructed to the east and PZ2 on the western side of
                                (Figure 1). Piezometer PZ1 was constructed to the east and PZ2 on the western side of the
                                the Montgomery stream. Both were 3 m away from the stream channel. The piezometers
                                penetrated thestream.
                                Montgomery        alluvialBoth
                                                             sandwere
                                                                   and3gravel,
                                                                         m away    from the
                                                                                 reaching    a stream
                                                                                               depth of  channel.   The water
                                                                                                           2.5 m. The    piezometers    pen-
                                                                                                                                levels were
                                etrated
                                measuredtheinalluvial    sand andand
                                                the piezometers       gravel,
                                                                         in thereaching    a depth of
                                                                                 stream channel,          2.5 m.
                                                                                                      in both      Theusing
                                                                                                               cases    waterthelevels  were
                                                                                                                                   height  of
                                measured    in  the  piezometers    and  in the  stream    channel,   in  both  cases
                                the piezometers as a reference point. Measurements were done once a month between June using  the  height   of
                                the piezometers      as  a reference   point.  Measurements       were     done   once
                                2016 and September 2016, and each time, a 10 mL sample was collected for stable isotope a month     between
                                June  2016
                                analysis    andthe
                                         from      September
                                                      piezometers2016,
                                                                     andand
                                                                          theeach  time,
                                                                              stream.      a 10 mLfrom
                                                                                         Sampling      sample    was collected
                                                                                                            Roosevelt   Park wasfor    stable
                                                                                                                                    done   on
                                isotope
                                the same day as Albert Farm spring. This analysis was specifically done during the was
                                        analysis    from   the piezometers    and   the  stream.  Sampling     from   Roosevelt    Park  dry
                                done onbecause
                                period    the same theday   as was
                                                        focus  Albert   Farm spring.
                                                                     to determine        This is
                                                                                     if there  analysis    was specifically
                                                                                                 a contribution               done flow
                                                                                                                    of subsurface     during
                                                                                                                                           to
                                the dry period because the focus was to determine if there is a contribution of subsurface

                                                                   6
Using Environmental Tracers to Characterize Groundwater Flow Mechanisms in the Fractured Crystalline and Karst Aquifers in Upper Crocodile River ...
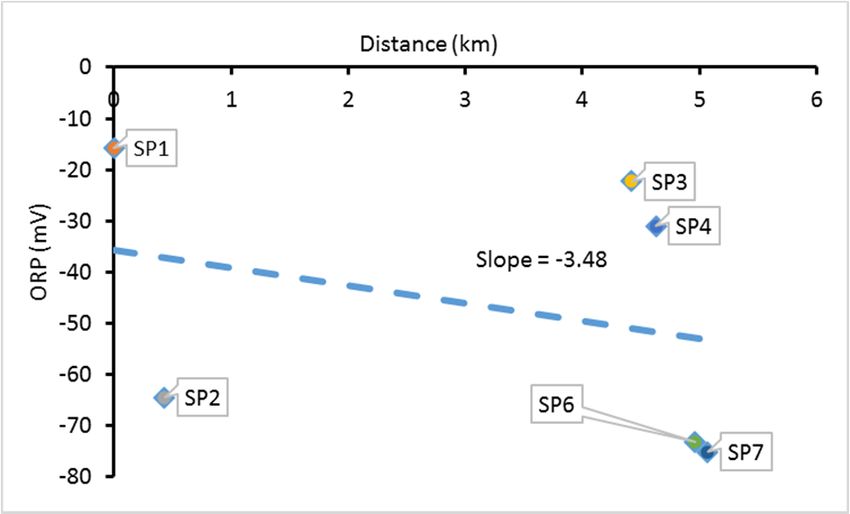
Hydrology 2021, 8, 50                                                                                          6 of 22

                        stream flow during dry periods, and also because wet seasons are prone to flooding, which
                        can destroy the piezometers and disrupt the monitoring program.
                              In the Malmani dolomites, water samples were collected from the six springs (SP1-SP4,
                        SP6 and SP7) for analysis of major ions and the physical parameters were measured on-site
                        in all nine springs prior to sampling using a multiparameter meter. The physicochemical
                        analysis was done to understand the evolution of water as it flows along the flow path in
                        the dolomitic terrain. Major ions were measured using a Dionex Ion Chromatograph, while
                        the total alkalinity test was performed through titration with a 0.02 N HCl solution to an
                        endpoint pH of 4.5. Additionally, sampling for 14 C was done in SP1 and SP3 to determine
                        the rate of groundwater flow between the two springs. The field sampling procedure for
                        carbon isotopes involved filling a 50 L drum with water and adding carbonate-free NaOH
                        to raise the pH to enhance precipitation of CO3 2- compound. A dash of phenolphthalein
                        was added as a pH indicator. BaCl2 was then added to allow a reaction between Ba2+ and
                        CO3 2− in solution to precipitate barium carbonate (BaCO3 ). The BaCO3 precipitate was
                        then stored in 500 mL bottles for delivery to the laboratory.
                              The analysis for the stable isotopes (δ18 O and δ2 H) was done at the University of
                        the Witwatersrand, Johannesburg, using the Liquid Water Isotope Analyser-model 45-
                        EP. This machine is able to provide accurate results with a precision of approximately
                        1‰ for δ2 H and 0.2‰ for δ18 O in liquid water samples. The analysis was done against
                        five standards of different known isotopic signatures. The 14 C analysis was done at
                        iThemba Laboratories in Johannesburg, South Africa, using a Hewlett Packard TriCarb
                        liquid scintillation spectrometer.
                              A plot of Johannesburg Local Meteoric Water Line (JLMWL) [32] and monthly stable
                        isotopes of Albert Farm spring was constructed to deduce the mechanism that is responsible
                        for recharging the fractured quartzite aquifer. Using the monthly stable isotope and
                        discharge data from Albert Farm spring, a plot of discharge versus isotope signature was
                        constructed to determine the traces of rainfall amount effect in groundwater. The traces
                        of amount effect were identified by the high spring yields that had a depleted isotopic
                        signature and low yields that had an enriched isotopic signature, which indicated a high
                        dependence of recharge on rainfall amount. In addition, based on the temperature effect,
                        the Johannesburg air temperature-δ18 O relationship for daily rainfall that was deduced by
                        Leketa and Abiye [33] was applied to determine the air temperature at the time of recharge
                        using δ18 O from Albert Farm spring as a data input.
                              The plots of pH, electrical conductivy (EC), oxidation reduction potential (ORP) and
                        saturation index versus distance along the flow path were created to visualise the variation
                        of hydrochemistry. A hydrogeochemical modelling tool for Windows called PHREEQC [34]
                        was used to calculate saturation indices of calcite and dolomite in each sample. This was
                        done to investigate the formation of travertine that was observed downstream of SP3.
                        Saturation index is a parameter used to deduce the level of saturation of a specific mineral
                        in a water sample [35,36]. It is calculated using the formula presented on Equation (1) [37]:

                                                                         I AP
                                                              SI = log                                            (1)
                                                                           K
                        where IAP is the ion activity product of the dissociated chemical species in solution
                        and K is the equilibrium solubility product for the chemicals involved at the sample
                        temperature [35,38]. A saturation index that is less than zero indicates that the water is
                        undersaturated with respect to a mineral and is capable of dissolving more of the mineral
                        during water–rock interaction. On the other hand, a saturation index greater than zero
                        indicates a water sample that is supersaturated and, therefore, incapable of dissolving more
                        of the mineral during water–rock interaction but ready to undergo precipitation [35,38].
Using Environmental Tracers to Characterize Groundwater Flow Mechanisms in the Fractured Crystalline and Karst Aquifers in Upper Crocodile River ...
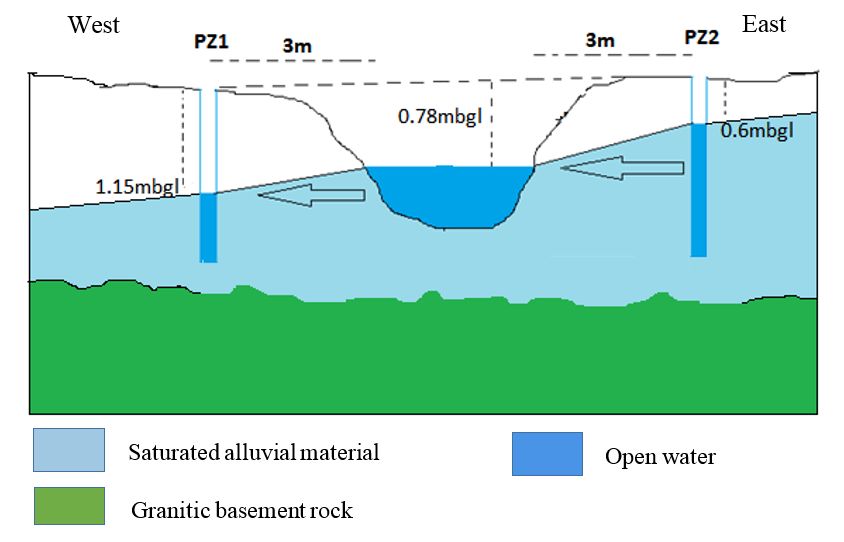
Hydrology 2021, 8, 50                                                                                                          7 of 22

                                4. Results and Discussions
                                4.1. Recharge Assessment and Subsurface Flow Mechanisms in the Basement Complex and the
                                Witwatersrand Supergroup Quartzites
                                4.1.1. Recharge Assessment
                                     The 25 months stable isotope data for Albert Farm spring are presented in Table 1.
                                The d-excess values computed using the JLMWL [32] for each sample are also shown. The
                                monthly stable isotope values for Albert Farm spring over the review period range from
                                −6.01‰ to −2.28‰ for δ18 O and from −21.6‰ to −10.5‰ for δ2 H, while the d-excess
                                ranges from +3.2‰ to +18.7‰. Only 16% of the Albert Farm samples have d-excess values
                                greater than 10‰, which is a d-excess value for the JLMWL [32].

                                     Table 1. Monthly stable isotope data for Albert Farm spring.

           ID           Latitude (DD)      Longitude (DD)      δ2 H (‰)    2H   StDev    δ18 O (‰)   18 O   StDev   d-Excess (‰)
       June 2016          −26.1616             27.9703          −19.3           0.2        −5.27            0.1        +16.0
       July 2016          −26.1616             27.9703          −21.6           0.3        −6.01            0.1        +18.7
     August 2016          −26.1616             27.9703          −19.1           0.1        −4.30            0.1         +9.7
   September 2016         −26.1616             27.9703          −14.5           0.0        −2.86            0.0         +4.7
     October 2016         −26.1616             27.9703          −13.7           1.3        −3.79            0.1        +11.7
   November 2016          −26.1616             27.9703          −16.0           0.3        −3.78            0.1         +9.4
   December 2016          −26.1616             27.9703          −14.3           0.0        −3.57            0.1         +9.6
     January 2017         −26.1616             27.9703          −12.5           0.5        −3.09            0.0         +8.3
    February 2017         −26.1616             27.9703          −15.0           0.8        −3.43            0.0         +8.0
      March 2017          −26.1616             27.9703          −16.4           0.6        −3.67            0.1         +8.2
      April 2017          −26.1616             27.9703          −15.2           0.7        −4.13            0.2        +12.4
       May 2017           −26.1616             27.9703          −12.3           0.5        −3.11            0.1         +8.6
       June 2017          −26.1616             27.9703          −14.9           0.4        −3.46            0.0         +8.3
       July 2017          −26.1616             27.9703          −16.3           1.2        −3.92            0.2         +9.9
     August 2017          −26.1616             27.9703          −15.2           0.3        −3.05            0.1         +5.2
   September 2017         −26.1616             27.9703          −18.3           0.3        −3.72            0.1         +6.6
     October 2017         −26.1616             27.9703          −20.3           0.3        −4.12            0.1         +7.3
   November 2017          −26.1616             27.9703          −12.0           0.4        −2.28            0.1         +3.2
   December 2017          −26.1616             27.9703          −11.7           1.5        −2.81            0.1         +7.1
     January 2018         −26.1616             27.9703          −10.5           2.2        −2.79            0.2         +8.2
    February 2018         −26.1616             27.9703          −14.2           0.5        −2.86            0.1         +5.0
      March 2018          −26.1616             27.9703          −16.0           1.3        −3.45            0.1         +7.2
      April 2018          −26.1616             27.9703          −12.9           0.8        −3.10            0.1         +7.9
       May 2018           −26.1616             27.9703          −12.3           2.8        −3.13            0.4         +8.7
       June 2018          −26.1616             27.9703          −12.9           1.1        −2.85            0.1         +6.3

                                      Figure 4 shows the stable isotope plot of Albert Farm spring samples with respect to
                                the JLMWL, Pretoria Local Meteoric Water Line (PLMWL) and the Global Meteoric Water
                                Line (GMWL). It can be observed in Figure 4 that over the 25-month period, the Albert
                                Farm spring displayed a highly variable stable isotope signature and the majority of the
                                samples plotted along the JLMWL with slight deviations characterized by a slope that is
                                less than 6.7 of the JLMWL. Figure 4 also shows a groundwater line, which is a regression
                                for the Albert Farm spring samples.
Hydrology 2021, 8, 50                                                                                                                                8 of 22

                                            The position of Albert Farm spring samples along the JLMWL indicates that recharge
                                      occurs rapidly without undergoing extreme evaporation. This possibly occurs through
                                      the vertical fractures that are exposed along the catchment boundary made of quartzite
                                      (Figure 2). Figure 5 shows the plot of δ18 O versus d-excess for Albert Farm spring samples.
                                      Despite the fact that all the samples are plotted along the JLMWL, 84% of the samples
                                      have d-excess values less than 10‰ and the groundwater stable isotope line has a lower
                                      slope of about 3 compared to 6.7 for the JLMWL. These conditions indicate possibilities
                                      of minor isotopic enrichment [20] from the low-humidity atmosphere. Figures 4 and 5
                                      reveal that although the spring samples represent a single sample location, there was high
                                      variability over the 25 month sampling period. This suggests that since recharge occurs
                                      without undergoing prior extreme evaporation (groundwater generally has an isotopic
                                      signature similar to rainfall), the observed high variability in the spring’s isotopic signature
                                      is a reflection of the variability in rainfall isotopic signature, rather than the variability in
                                      recharge mechanisms. It then becomes practical to use the variability in d-excess values for
                                      groundwater samples in Albert Farm spring to infer the conditions of the moisture
       Hydrology 2021, 8, x FOR PEER REVIEW
                                                                                                                                 source
                                                                                                                           9 of 23
                                      where evaporation occurred and of the atmosphere along the trajectory.

                                                                                                                                  20

                                                                    δ18O (‰)
                                                                                                                                  0
                            -8           -7          -6           -5            -4           -3           -2           -1              0

                    Groundwater line= ẟ2H= 3ẟ18O - 4.5‰

                                                                                                                                           δ2H (‰)
                                                                                                                                -20

                    δ2H = 6.7δ18O + 10‰
                   δ2H = 6.7δ18O + 7.2‰                                                                                         -40

                        δ2H = 8δ18O + 10‰

                                                                                                                                -60

                                    AF Spring             JLMWL           PLMWL              GMWL              Groundwater Line

             Figure 4. Stable isotopes of Albert Farm spring in comparison to the Johannesburg Local Meteoric Water Line, Pretoria
             4. Stable
      Figure(LMWL      isotopes
                    (δ2H = 6.7δ18Oof+ Albert  Farm spring
                                      7.2‰ GNIP-IAEA)     andinGlobal
                                                                 comparison
                                                                        MWL (δto  2H the
                                                                                      = 8δJohannesburg
                                                                                          18O + 10‰) [39]. Local Meteoric Water Line, Pretoria

      (LMWL (δ H = 6.7δ O + 7.2‰ GNIP-IAEA) and Global MWL (δ H = 8δ18 O + 10‰) [39].
                2         18                                                        2

                                               The position of Albert Farm spring samples along the JLMWL indicates that recharge
                                           A d-excess
                                         occurs  rapidlyvalue
                                                           withoutin precipitation      depends
                                                                       undergoing extreme            on the temperature
                                                                                                  evaporation.               and humidity
                                                                                                                   This possibly               conditions
                                                                                                                                   occurs through
                                     at the vertical
                                              sea surface     where
                                                       fractures   thatevaporation
                                                                         are exposed along took theplace    and theboundary
                                                                                                       catchment      humidity     along
                                                                                                                                made        the moisture
                                                                                                                                       of quartzite
                                         (Figure 2).
                                     trajectory      Figure 5 shows
                                                   [20,40,41].   A high  thevariation
                                                                             plot of δ18that
                                                                                          O versus    d-excess in
                                                                                                is observed      forthe
                                                                                                                     Albert
                                                                                                                        plotFarm   18 O versus
                                                                                                                              of δspring   samples.
                                                                                                                                                  d-excess
                                         Despite   the fact  that  all the  samples     are  plotted   along   the  JLMWL,
                                     (Figure 5) indicates that the aquifer that feeds the Albert Farm spring is recharged     84%   of the  samples
                                                                                                                                                by rainfall
                                         havethat
                                     events    d-excess
                                                    werevalues     less than
                                                           generated      under10‰     and thehumidity
                                                                                   different     groundwater      stable isotope
                                                                                                             conditions,          linedifferent
                                                                                                                            or from     has a lower
                                                                                                                                                 moisture
                                         slope  of about  3 compared      to 6.7 for  the  JLMWL.     These   conditions  indicate
                                     sources, i.e., the local surface water bodies, warmer Indian Ocean, cooler Atlantic Ocean      possibilities  of    or
                                         minor isotopic enrichment [20] from the low-humidity atmosphere. Figure 4 and 5 reveal
                                     the high-latitude cold Antarctica. In an investigation of stable isotope effects and moisture
                                         that although the spring samples represent a single sample location, there was high vari-
                                     trajectories for rainfall in Johannesburg, Leketa and Abiye [33] reported high variability
                                         ability over the 25 month sampling period. This suggests that since recharge occurs with-
                                     in stable   isotopesprior
                                         out undergoing       of Johannesburg
                                                                   extreme evaporation rainfall   for the period
                                                                                               (groundwater           between
                                                                                                                 generally  has anNovember       2016 and
                                                                                                                                    isotopic signa-
                                     October    2018.  Through      the  use   of  a  Hybrid    Single   Particle   Lagrangian    Integrated
                                         ture similar to rainfall), the observed high variability in the spring’s isotopic signature is         Trajectory
                                     model    (HYSPLIT;
                                         a reflection       https://www.ready.noaa.gov/HYSPLIT.php
                                                       of the  variability in rainfall isotopic signature, ratheraccessed  than the on   3 January
                                                                                                                                      variability  in 2021),
                                     they  furthermechanisms.
                                         recharge    determinedItthe       dependence
                                                                        then                 of Johannesburg
                                                                              becomes practical                     rainfall isotopic
                                                                                                      to use the variability            signature
                                                                                                                                in d-excess   valueson the
                                     trajectory   and residence
                                         for groundwater      samplestime inof moisture
                                                                             Albert    Farmover
                                                                                              springthetoIndian   versus
                                                                                                           infer the      the Atlantic
                                                                                                                      conditions   of theOcean    en route
                                                                                                                                           moisture
                                         source where evaporation
                                     to Johannesburg.                     occurred
                                                             The trajectory        of and   of thewith
                                                                                       rainfall    atmosphere      along the
                                                                                                          low d-excess       trajectory.
                                                                                                                           displays    an anticlockwise
Hydrology 2021, 8, 50                                                                                                                                9 of 22

                                      circulation with the longest residence time above the Indian Ocean where it experienced
                                      conditions that altered its isotopic signature. The moisture for rainfall with high d-excess
                                      had longer residence time above the higher latitudes south of the South African coastline,
                                      after which it experienced a semi-direct trajectory to Johannesburg. Therefore, the observed
                                      variability    is likely a reflection of the moisture trajectories and residence times above the
                        Hydrology 2021, 8, x FOR PEER REVIEW                                                                       10 of 23
                                      Indian Ocean.

                                                                                         d-excess (‰)
                                                     0
                                                          0                  5                    10                   15                   20
                                                     -1

                                                     -2
                                          δ18O (‰)

                                                     -3

                                                     -4

                                                     -5

                                                     -6

                                                     -7
                                                                                       Albert Farm spring

                                                              Figure 5. Plot of d-excess versus δ18O for the monthly Albert farm spring samples.
                                   Figure 5. Plot of d-excess versus δ18 O for the monthly Albert farm spring samples.
                                                                   A d-excess value in precipitation depends on the temperature and humidity condi-
                                        The majority
                                                   tionsofatthe
                                                             the samples
                                                                  sea surfaceinwhere
                                                                                  Tableevaporation
                                                                                          1 have d-excess
                                                                                                        took placelower
                                                                                                                    and thethan   10‰, along
                                                                                                                               humidity    possibly     indi-
                                                                                                                                                   the moisture
                                   cating groundwater      that[20,40,41].
                                                   trajectory    was recharged        by rainfall
                                                                             A high variation      thatwhose    moisture
                                                                                                         is observed   in theexperienced         long-term
                                                                                                                                plot of δ18O versus    d-excess
                                                   (Figure
                                   circulation in the  warm  5) indicates
                                                                 atmospherethat theenaquifer
                                                                                       routethat     feeds the Albert Farm
                                                                                                to Johannesburg,          suchspring    is recharged
                                                                                                                                  as above              by rain-
                                                                                                                                                the Indian
                                   Ocean [33]. Onfall
                                                    theevents
                                                          otherthat    were
                                                                   hand,       generated
                                                                           samples      withunderhighdifferent
                                                                                                         d-excesshumidity
                                                                                                                     couldconditions,       or from different
                                                                                                                               indicate groundwater
                                                   moisture sources, i.e., the local surface water bodies, warmer Indian Ocean, cooler Atlan-
                                   that was recharged     by rainfall events that experienced long-term circulation in the cooler
                                                   tic Ocean or the high-latitude cold Antarctica. In an investigation of stable isotope effects
                                   regions or had and
                                                    limited     residence above the warm Indian Ocean. The high amount of
                                                         moisture trajectories for rainfall in Johannesburg, Leketa and Abiye [33] reported high
                                   d-excess could variability
                                                    also be due       to continental
                                                                 in stable                 and altituderainfall
                                                                            isotopes of Johannesburg          effectsfor that
                                                                                                                            thebecome      effective
                                                                                                                                period between           dur-
                                                                                                                                                     November
                                   ing washing out    of and
                                                   2016   heavy     isotopes
                                                               October           from incoming
                                                                         2018. Through      the use of moisture,       thereby
                                                                                                         a Hybrid Single           leading
                                                                                                                             Particle          to a Integrated
                                                                                                                                      Lagrangian      highly
                                   depleted rainfall   furthermodel
                                                   Trajectory      inland(HYSPLIT;
                                                                             in Johannesburg.           Additionally, it can be caused
                                                                                         https://www.ready.noaa.gov/HYSPLIT.php),                     byfurther
                                                                                                                                                   they   the
                                                   determinedre-evaporation
                                   occurrence of sub-cloud         the dependence from of Johannesburg
                                                                                               light rainfallrainfall isotopic signature on the trajectory
                                                                                                                  [18,20].
                                        This studyand    residence
                                                     presents      antime  of moisture
                                                                       improved            over the Indianand
                                                                                      understanding            versus   the Atlantic Ocean
                                                                                                                    implications       of theen     route to Jo-
                                                                                                                                                  temporal
                                                   hannesburg.
                                                   18       2       The trajectory of rainfall with low d-excess displays an anticlockwise circu-
                                   variability in δ O/δ H signature from one groundwater source. The varying isotopic
                                                   lation with the longest residence time above the Indian Ocean where it experienced con-
                                   signature that is  observed
                                                   ditions           at theitssame
                                                             that altered             sample
                                                                               isotopic           location
                                                                                         signature.            is a good
                                                                                                       The moisture           indication
                                                                                                                        for rainfall         thatd-excess
                                                                                                                                     with high       the usehad
                                   of one sample for    isotopic
                                                   longer           characterization
                                                            residence   time above the higherof groundwater
                                                                                                    latitudes south isofnot
                                                                                                                          theaSouth
                                                                                                                                goodAfrican
                                                                                                                                        practice,     as this
                                                                                                                                                coastline, after
                                   may erroneously     yield
                                                   which        interpretations
                                                            it experienced            that are
                                                                               a semi-direct       biased to
                                                                                                trajectory    towards      that single
                                                                                                                 Johannesburg.             sample.
                                                                                                                                    Therefore,          This
                                                                                                                                                  the observed
                                                   variability
                                   implies that during           is likely a recharge
                                                          groundwater         reflection of  the moisture
                                                                                          assessment        intrajectories
                                                                                                               a sub-tropicaland residence
                                                                                                                                   region thattimes   above the
                                                                                                                                                    receives
                                                   Indian Ocean.
                                   rainfall from different     moisture sources, it is necessary to collect multiple samples from
                                                          The majority of the samples in Table 1 have d-excess lower than 10‰, possibly indi-
                                   each groundwater source,        possibly in different seasons rather than deducing interpretations
                                                   cating groundwater that was recharged by rainfall whose moisture experienced long-term
                                   from a single sample.
                                                   circulation in the warm atmosphere en route to Johannesburg, such as above the Indian
                                                              Ocean [33]. On the other hand, samples with high d-excess could indicate groundwater
                                   4.1.2. Assessingthat
                                                    thewas
                                                        Traces of Rainfall Amount Effect in Spring Discharge
                                                           recharged by rainfall events that experienced long-term circulation in the cooler
                                        Leketa andregions
                                                    Abiyeor[33]hadidentified     the traces
                                                                     limited residence   aboveofthe
                                                                                                  amount     and temperature
                                                                                                      warm Indian     Ocean. The higheffects  in the
                                                                                                                                         amount   of d-
                                                   excess could
                                   Johannesburg rainfall.    Sincealsoheavy
                                                                        be duerainfall
                                                                                to continental   and altitude
                                                                                         is generally           effects that become
                                                                                                          characterized               effective
                                                                                                                             by depleted        during
                                                                                                                                              stable
                                   isotopes and thewashing   out of heavy
                                                     light rainfall          isotopes from
                                                                        is enriched,   havingincoming    moisture,from
                                                                                                   established       thereby
                                                                                                                          theleading   to a highly
                                                                                                                               δ18 O versus     δ2 Hde-
                                                   pleted rainfall further inland in Johannesburg. Additionally, it can be caused by the oc-
                                   plot (Figure 4) that the fractured aquifer that feeds the Albert Farm spring is recharged
                                                   currence of sub-cloud re-evaporation from light rainfall [18,20].
                                   directly by rainfall,This
                                                         andstudy
                                                               withpresents
                                                                       the understanding         that heavy rainfall
                                                                                an improved understanding                  leads to both
                                                                                                                   and implications   of theatemporal
                                                                                                                                               high
                                   amount of recharge
                                                   variability in δ O/δ H signature from one groundwater source. The varying isotopicin
                                                          and    a  rise
                                                                    18    in
                                                                          2   groundwater        level,  it could    be  hypothesized        that   sig-
                                   a fracture-controlled  gravity
                                                   nature that         springat where
                                                                is observed     the samepiston
                                                                                          sampleor    preferential
                                                                                                    location is a goodflow    prevails,
                                                                                                                        indication        the
                                                                                                                                    that the   high
                                                                                                                                             use of one
                                   spring dischargesample  for isotopicdepleted
                                                     is isotopically       characterization
                                                                                     and the of low
                                                                                                groundwater      is not a good
                                                                                                      spring discharge           practice, as this may
                                                                                                                             is enriched.

                                                                                             10
Hydrology 2021, 8, 50                                                                                                                             10 of 22

                                         Table 2 presents the 14 months stable isotope data (δ18 O, δ2 H) and the spring discharge
                                    data for the Albert Farm spring. Over this period, the discharge ranged between 0.66 L/s
                                    and 4.8 L/s.

                                    Table 2. The stable isotope and spring discharge data for the Albert Farm spring over the
                                    14 month period.

                                                 Date                   δ18 O (‰)                 δ2 H (‰)             Spring Discharge: Q (L/s)
                                              February 17                 −3.43                     −15.0                            3.2
                                               March 17                   −3.67                     −16.4                            3.9
                                                April 17                  −4.13                     −15.2                            4.8
                                                May 17                    −3.11                     −12.3                            2.2
                                                June 17                   −3.46                     −14.9                            3.6
                                                July 17                   −3.92                     −16.3                            3.8
                                               August 17                  −3.05                     −15.2                            1.4
                                          September 17                    −3.72                     −18.3                            1.4
                                              October 17                  −4.12                     −20.3                            1.9
                                          November 17                     −2.28                     −12.0                           0.66
                                              December 17                 −2.81                     −11.7                            1.3
                                              January 18                  −2.79                     −10.5                            1.3
                                              February 18                 −2.86                     −14.2                            1.2
                                               March 18                   −3.45                     −16.0                            2.3

       Hydrology 2021, 8, x FOR PEER REVIEW                                                                                                12 of 23
                                          Figure 6 shows the plots of spring yield versus stable isotopes. The correlation values
                                    of 0.51 and 0.087 were obtained for yield versus δ18 O and δ2 H, respectively. The figure also
                                    shows
                                       valuesthat  highfor
                                                of 0.21   flows
                                                             δ18O are   generally
                                                                   versus  rainfall depleted
                                                                                     amount and  and   low
                                                                                                     0.10 forflows   are enriched.
                                                                                                              δ2H versus               This agrees
                                                                                                                            rainfall amount   [33]. well
                                    with   thebe
                                       It can   given   hypothesis.
                                                  observed               The correlation,
                                                              that regressions                however,
                                                                                  for stable isotope        seems
                                                                                                       versus       to be
                                                                                                                rainfall    most are
                                                                                                                         amount   suitable
                                                                                                                                       lowerat   a higher
                                                                                                                                              than
                                    yield,
                                       thosewhile   the low-yield
                                               for stable             part ofspring
                                                           isotopes versus      the plot  seems
                                                                                       yields. It isto include
                                                                                                     also         highly
                                                                                                           observed   thatdepleted
                                                                                                                            the springwater    as seen by
                                                                                                                                        discharge
                                    thehas
                                         encircled
                                             a higheroutlier    samples
                                                         correlation       that have
                                                                       in higher        low
                                                                                   yields     yield
                                                                                           than       but yields
                                                                                                  in low    more depleted
                                                                                                                   (Figure 6).relative
                                                                                                                                 This can tobe
                                                                                                                                             theex-
                                                                                                                                                  general
                                       plained
                                    trend.   Theby    the occurrence
                                                   outlier   samples of    preferential
                                                                         could            recharge
                                                                                 be a result          by heavy
                                                                                               of highly          rainfallrainfall
                                                                                                             depleted      as compared
                                                                                                                                   eventstooriginating
                                                                                                                                              very
                                       light
                                    from   therainfall  that mostThis
                                                cold regions.       likely
                                                                         wasbecomes    soil by
                                                                                observed    moisture
                                                                                                Leketastorage     and eventually
                                                                                                           and Abiye     [33], whoevaporation.
                                                                                                                                      identified a light
                                       Since Leketa
                                    rainfall,   whichand     Abiye
                                                          was,       [33] already
                                                                 however,           observeddepleted
                                                                               isotopically     a higher correlation
                                                                                                             (defying in    the heavy
                                                                                                                         amount         rainfall
                                                                                                                                     effect)  andas had a
                                       compared
                                    longer           to light
                                             residence     timerainfall,
                                                                  aboveittheis deduced
                                                                                Atlanticthat   the preferential recharge by heavy rainfall
                                                                                           Ocean.
                                       produces a higher correlation in spring discharge.

                                        (a)                                                               (b)

      FigureFigure 6. Plots of Albert Farm spring yield versus (a) δ O with
                        of Albert Farm spring yield versus (a) δ18 Oa with  correlation of 0.51 and (b) δ H with a very2poor correlation
                                                                   18                                     2
              6. Plots                                                            a correlation of 0.51 and (b) δ H with a very poor
            0.087.
      correlation 0.087.
Hydrology 2021, 8, x FOR PEER REVIEW                                                                                                  12 of 23

Hydrology 2021, 8, 50                                                                                                                 11 of 22
                                   values of 0.21 for δ18O versus rainfall amount and 0.10 for δ2H versus rainfall amount [33].
                                   It can be observed that regressions for stable isotope versus rainfall amount are lower than
                                   those for stable isotopes versus spring yields. It is also observed that the spring discharge
                                   has Figure
                                         a higher7 shows   the plots
                                                     correlation      of yieldyields
                                                                  in higher      versusthan
                                                                                         stable
                                                                                              in isotope  signature
                                                                                                  low yields   (Figurewith
                                                                                                                         6). the outlier
                                                                                                                              This can besam-
                                                                                                                                            ex-
                                  ples  excluded.
                                   plained    by theInoccurrence
                                                        these plots,
                                                                   ofapreferential
                                                                        correlation of    0.91 is observed
                                                                                      recharge    by heavy between      the
                                                                                                              rainfall as    yield andtoδ18
                                                                                                                          compared          O,
                                                                                                                                          very
                                  while    2 H has a correlation of 0.47 with the regression lines shown in Equations (2) and (3).
                                   light δrainfall  that most likely becomes soil moisture storage and eventually evaporation.
                                  Despite    the low
                                   Since Leketa and    correlation
                                                         Abiye [33]that  is stillobserved
                                                                      already     observedain    Figure
                                                                                              higher     7b, the observed
                                                                                                       correlation            negative
                                                                                                                    in the heavy        slopeas
                                                                                                                                    rainfall
                                  indicates   the traces  of rainfall amount     effect in spring   discharge,  which   suggests
                                   compared to light rainfall, it is deduced that the preferential recharge by heavy rainfall      the extent
                                  ofproduces
                                     dependence      of recharge
                                                a higher         amount
                                                          correlation       on the discharge.
                                                                        in spring   rainfall amount, additionally giving an indication
                                  of piston flow occurrence. The low R2 value in spring yield can be explained by the fact
                                  that the regression lines of amount effect in Johannesburg rainfall also had low R2 values
                                  of 0.21 for δ18 O versus rainfall amount and 0.10 for δ2 H versus rainfall amount [33]. It can
                                  be observed that regressions for stable isotope versus rainfall amount are lower than those
                                  for stable isotopes versus spring yields. It is also observed that the spring discharge has a
                                  higher correlation in higher yields than in low yields (Figure 6). This can be explained by
                                  the occurrence of preferential recharge by heavy rainfall as compared to very light rainfall
                                  that most likely becomes soil moisture storage and eventually evaporation. Since Leketa
                                  and Abiye [33] already observed a higher correlation in the heavy rainfall as compared
                                  to light rainfall, it is deduced that the preferential recharge by heavy rainfall produces a
                                  higher correlation in spring discharge.

                                                                 δ18 O = −0.38Q − 2.32‰, R2 = 0.91                                        (2)

                                      (a)                         δ2 H = −1.02Q − 11.6‰, R2 = (b)
                                                                                               0.47                                       (3)
       Figure 6. Plots of Albert Farm spring
                                   where     yield
                                          Q is     versus
                                               yield      (a) δ18O with a correlation of 0.51 and (b) δ2H with a very poor correlation
                                                      in L/s.
       0.087.

                                (a)                                                                    (b)
       Figure7.7.Plots
      Figure      Plotsofof spring
                          spring   yield
                                 yield   versus
                                       versus    stable
                                              stable     isotopes
                                                     isotopes     excluding
                                                              excluding     outlier
                                                                        outlier     samples
                                                                                samples with with  (a) showing
                                                                                             (a) showing        a correlation
                                                                                                          a correlation       between
                                                                                                                        between yield
       yield18and δ18O and (b) showing 0.47 between yield2 and δ2H.
      and δ O and (b) showing 0.47 between yield and δ H.

                                       The regressions in Equations     (2) and−(3)
                                                                      = −0.38         are also
                                                                                    2.32‰,  R2 =presented
                                                                                                 0.91       in Equations (4) and
                                                                                                                              (2) (5),
                                                                         3
                                  respectively, using the SI units of m /s. It can be deduced that once the long-term spring
                                  yield versus δ18 O regression line has   been established
                                                                       = −1.02      − 11.6‰, forR2 =Albert
                                                                                                     0.47 Farm spring, a measured   (3)
                                  spring discharge can be used as input data into the regression to estimate the stable isotope
                                   where Q of
                                  signature is yield   in L/s. and, therefore, of effective rainfall.
                                               the discharge
                                        The regressions in Equations (2) and (3) are also presented in Equations (4) and (5),
                                   respectively, using the SI units δof18m  /s. −
                                                                         O 3=   It377Q  − deduced
                                                                                   can be  2.32‰ that once the long-term spring   (4)
                                   yield versus δ O regression line has been established for Albert Farm spring, a measured
                                                  18

                                   spring discharge can be used as  δ2 H = −data
                                                                       input         into−the
                                                                                1019.5Q     11.6‰
                                                                                               regression to estimate the stable (5)
                                                                                                                                   iso-
                                   tope signature   of  the
                                  where Q is yield in m /s.3discharge and, therefore,   of effective  rainfall.
                                                                         = −377 − 2.32‰                                                    (4)
                                  4.1.3. Assessing the Air Temperature Conditions at the Time of Recharge
                                       Once recharge has occurred, a stable isotope signature of water is maintained and
                                  the signature carries with it information
                                                                 12          about the atmosphere that the water interacted
                                  with prior to direct recharge [18]. The relationship between air temperature and rainfall
Hydrology 2021, 8, 50                                                                                            12 of 22

                        stable isotope signature, referred to as temperature effect, was first observed by Dans-
                        gaard [42] using data acquired from North Atlantic stations. The temperature effect by
                        Dansgaard [42] was represented by a regression shown in Equation (6). Using the isotope
                        signature of daily rainfall and the air temperature for Johannesburg, Leketa and Abiye [33]
                        deduced the Johannesburg air-temperature–δ18 O relationship for daily rainfall presented
                        in Equation (7).
                                                          δ18 O = 0.695Ta − 13.6‰                               (6)
                        where Ta is mean annual temperature.

                                    δ18 O = 0.552Td − 14.1‰ n = 88, R2 = 0.21, p − value = 0.002                     (7)

                        where Td is daily air temperature.
                              Based on the understanding that recharge into the fractured quartzite aquifer in the
                        study area occurs without extreme isotopic alteration by evaporation, and that where
                        such recharge occurs, groundwater maintains the stable isotope signature of effective
                        rainfall [18,43], an isotopic signature of groundwater was used in Equations (6) and (7) to
                        estimate the annual and daily air temperatures, respectively, at the time when recharge
                        occurred. The monthly δ18 O values of the Albert Farm spring were used in both equations.
                        These estimated air temperatures are presented in Table 3.
                              As shown in Table 3, the estimated annual air temperatures at the time of recharge
                        range between 10.9 ◦ C and 16.3 ◦ C, while the estimated daily air temperatures range
                        between 14.7 ◦ C and 21.4 ◦ C.
                              According to the South African Weather Service (SAWS), the daily air temperatures
                        that were measured on the rainfall days at the Johannesburg Botanical Garden weather
                        station (JHB Bot. Tuin; Figure 1) between November 2016 and October 2018 ranged from
                        7.5 ◦ C to 25 ◦ C. This indicates that the calculated daily air temperatures are within the range
                        of the measured daily air temperatures. On the other hand, the annual air temperatures
                        that were measured at the same weather station between 1997 and 2016 were between
                        15.5 ◦ C and 18.9 ◦ C. This indicates that the calculated annual air temperatures are slightly
                        below the range of the current (1997 to 2016) annual air temperatures.
                              The reasons for similarities in the range of calculated daily air temperatures and the
                        measured daily air temperatures could be that the daily air temperature represents the
                        actual temperature on the day of rainfall, which is the temperature responsible for frac-
                        tionation during condensation and sub-cloud re-evaporation during precipitation [18,20].
                        The measured annual temperature, on the other hand, includes all the days in a year (1996
                        to 2016), even days without rainfall, so they could be a reflection of both the dry and
                        wet air temperatures; hence, they are higher than the calculated temperatures. The lower
                        calculated annual temperature could also indicate two possibilities:
                        (1)   The Dansgaard [42] equation is only applicable in the northern-hemisphere stations
                              (where temperatures are cooler) where the equation was established and may not be
                              applicable in the Johannesburg climate setting.
                        (2)   If the Dansgaard [42] is applicable in the Johannesburg climate setting, then the
                              variation could indicate that at the time of recharge, the climate was characterized by
                              annual temperatures that are colder than the present.

                        4.1.4. Interflow Assessment in the Stream Underlain by the Basement Complex
                             Table 4 presents the water levels in units of meters below ground level (mbgl) and
                        stable isotope data for the two piezometers and Montgomery stream over the four month
                        period. Table 4 also shows elevations of the piezometer in meters above sea level (masl)
                        and their coordinates.
Hydrology 2021, 8, 50                                                                                                13 of 22

                        Table 3. The estimated mean annual and daily air temperatures at the time of recharge for the Albert
                        Farm spring samples over the 25 months.

                                                     Estimated Annual Air Temp.        Estimated Daily Air Temperature
                               Sample Date
                                                     (◦ C) on the Year of Recharge          during Recharge (◦ C)
                                 June 2016                        12.0                                16.0
                                 July 2016                        10.9                                14.7
                               August 2016                        13.4                                17.8
                              September 2016                      15.5                                20.4
                               October 2016                       14.1                                18.7
                             November 2016                        14.1                                18.7
                              December 2016                       14.4                                19.1
                               January 2017                       15.1                                19.9
                              February 2017                       14.6                                19.3
                                March 2017                        14.3                                18.9
                                April 2017                        13.6                                18.1
                                 May 2017                         15.1                                19.9
                                 June 2017                        14.6                                19.3
                                 July 2017                        13.9                                18.4
                               August 2017                        15.2                                20.0
                              September 2017                      14.2                                18.8
                               October 2017                       13.6                                18.1
                             November 2017                        16.3                                21.4
                              December 2017                       15.5                                20.5
                               January 2018                       15.6                                20.5
                              February 2018                       15.5                                20.4
                                March 2018                        14.6                                19.3
                                April 2018                        15.1                                19.9
                                 May 2018                         15.1                                19.9
                                 June 2018                        15.5                                20.4
                                 Average                          14.5                                19.1
                                   MIN                            10.9                                14.7
                                   MAX                            16.3                                21.4

                             As shown in Table 4, PZ2 consistently has a higher water level compared to both PZ1
                        and Montgomery streams. It is evident from this observation that the Montgomery stream
                        gains from the eastern side and loses to the western side, as shown in Figure 8, which
                        presents the average water levels over the period of review.
                             Figure 9 shows the four-month stable isotope (δ18 O versus δ2 H) plot for piezometers
                        and stream samples against the JLMWL [32]. It can be observed from this plot that there are
                        a loss and a gain of water from the stream. With time, the samples seem to generally shift
                        towards the most enriched part of the plot. The June samples are generally most depleted,
                        becoming more enriched towards September. Albert Farm spring is one of the sources of
                        water to the Montgomery stream; however, there are numerous small impoundments and
                        swampy areas downstream of Albert Farm spring but upstream of the piezometers study
                        area. With the exception of June 2016, the Albert Farm samples are the most depleted in
                        each month, indicating possibilities of enrichment by evaporation as the water flows from
                        Albert Farm spring to the piezometers site. Since there was no rainfall in that period, this
Hydrology 2021, 8, 50                                                                                                                       14 of 22

                                         behaviour shows a water source that is constantly being exposed to evaporation, thereby
                                         continuously getting enriched with time. A combination of interpretations from the water
                                         levels and stable isotopes indicates that while it is clear that the stream is fed by Albert Farm
                                         spring via the upstream impoundments, the piezometers could also be fed by interflow
                                         that is patched in the unsaturated zone above the granite bedrock. The interflow possibly
                                         comes from the open upstream water bodies or rainfall that had infiltrated during the
                                         rainy season. This could explain the situation in June 2016, when the PZ2 and the stream
                                         were more depleted than the source Albert Farm and PZ1. Both the water levels and stable
                                         isotope interpretations revealed that there is an interaction between Montgomery stream
                                         and subsurface flow that is monitored from the piezometers.

                               Table 4. Stable isotope and water level data for the piezometers and the stream.

     Site ID                Date             Water Level (mbgl)        δ2 H (‰)          ±2 H StDev            δ18 O (‰)         ±18 O StDev
       PZ1               6 June 2016                1.12                −12.5                0.33               −3.00                0.06
       PZ2               6 June 2016                0.64                −68.5                0.13               −12.47               0.09
   River head            6 June 2016                0.72                −66.3                 0                 −12.27                 0
       PZ1
Hydrology 2021, 8, x FOR13PEER
                           July 2016
                                REVIEW              1.12                −17.8                 0                 −5.36                  0 15 of 23
       PZ2              13 July 2016                0.52                −16.3                 0                 −5.04                  0
   River head            13 July 2016               0.75                 −9.8                 0                 −3.88                  0
       PZ1              12 August 2016 Stream       1.17
                                                 06 September           −12.4                  0.22                 −3.05             0.05
                                                                        0.92                −9.5          0.65           −1.83         0.02
       PZ2              12 August 2016 head           2016
                                                    0.58                −12.3                  0.16                 −2.85             0.07
   River head           12 August 2016                 PZ1 -26.149247 DD −
                                                    0.72                 Lat,
                                                                           4.927.997857 DD Long,
                                                                                               0.241593 masl Elev, 1.2mbgl
                                                                                                                    −1.59 PZ depth    0.06
                                                      PZ2 -26.149333 DD Lat, 27.997868 DD Long, 1593 masl Elev, 2.15mbgl PZ depth
       PZ1          6 September 2016          PZ dry no sample     PZ dry no sample     PZ dry no sample PZ dry no sample       PZ dry no sample
       PZ2          6 September 2016            0.66                 −1.7                                    −0.45
                                        As shown     in Table 4, PZ2   consistently has0.22
                                                                                          a higher water level     compared to 0.05
                                                                                                                               both PZ1
   Stream head      6 September 2016            0.92
                                   and Montgomery                    −9.5
                                                        streams. It is evident from this 0.65observation that−1.83
                                                                                                                the Montgomery 0.02stream
                                  PZ1 -26.149247
                                   gains         DD Lat,
                                          from the       27.997857
                                                      eastern  sideDDand
                                                                      Long, 1593 to
                                                                          loses  masl Elev,
                                                                                    the     1.2mbgl PZ
                                                                                         western       depth
                                                                                                    side, as shown in Figure 8, which
                                 PZ2 -26.149333 DD Lat, 27.997868 DD Long, 1593 masl Elev, 2.15mbgl PZ depth
                                   presents the average water levels over the period of review.

                                        Figure
                                         Figure8.8.Schematic
                                                    Schematicofofstream
                                                                  streamgain
                                                                         gainand
                                                                             and stream
                                                                                 stream loss at the Montgomery
                                                                                                    Montgomery Stream,
                                                                                                               Stream,which
                                                                                                                       whichisisunderlain
                                                                                                                                 underlainby
                                        by the
                                         the   granites.
                                             granites.

                                              Figure 9 shows the four-month stable isotope (δ18O versus δ2H) plot for piezometers
                                        and stream samples against the JLMWL [32]. It can be observed from this plot that there
                                        are a loss and a gain of water from the stream. With time, the samples seem to generally
                                        shift towards the most enriched part of the plot. The June samples are generally most de-
                                        pleted, becoming more enriched towards September. Albert Farm spring is one of the
                                        sources of water to the Montgomery stream; however, there are numerous small im-
                                        poundments and swampy areas downstream of Albert Farm spring but upstream of the
                                        piezometers study area. With the exception of June 2016, the Albert Farm samples are the
                                        most depleted in each month, indicating possibilities of enrichment by evaporation as the
Hydrology 2021, 8, 50                                                                                                                                       15 of 22
Hydrology 2021, 8, x FOR PEER REVIEW                                                                                                                        16 of 23

                                                                                                     20                   AF-June-16

                                                                                                                          Stream-June-16

                                  δ18O (‰)                                                                                PZ1-June-16
                                                                                                       0
               -16      -14      -12          -10          -8        -6           -4          -2           0              PZ2-June-16

                                                                                                                          AF-Jul-16
                                                                                                    -20                   Stream-Jul-16

                                                                                                                          PZ1-Jul-16

                                                                                                               δ2H (‰)
                                                                                                                          PZ2-Jul-16
                                                                                                    -40
                               δ2H   =   6.7δ18O   + 10‰                                                                  AF-Aug-16

                                                                                                                          Stream-Aug-16
                                                                                                    -60                   PZ1-Aug-16

                                                                                                                          PZ2-Aug-16

                                                                                                    -80                   AF-Sep-16

                                                                                                                          Stream-Sep-16

                                                                                                                          PZ2-Sep-16
                                                                                                   -100
                                                                                                                          JLMWL

     Figure 9. Stable isotope plot of piezometers, Montgomery stream and the selected Albert Farm spring samples plotted
     Figure 9. Stable isotope plot of piezometers, Montgomery stream and the selected Albert Farm spring samples plotted
     against the Johannesburg Local Meteoric Water Line (JLMWL).
     against the Johannesburg Local Meteoric Water Line (JLMWL).
                                4.2.
                                4.2. Hydrogeological
                                     Hydrogeological Characterization
                                                          Characterization of         of the
                                                                                          the Karst
                                                                                              Karst Aquifers
                                                                                                      Aquifers
                                      Table
                                      Table 55 presents
                                                  presents the  thehydrochemical
                                                                      hydrochemicaldata         dataforforthetheMalmani
                                                                                                                  Malmani     dolomite
                                                                                                                                  dolomite  springs.
                                                                                                                                                 springs. TheTheEC
                                values
                                EC valuesrange    between
                                               range   between  136.5136.5
                                                                        µS/cm   µS/cm and 220andµS/cm;      the pH
                                                                                                   220 µS/cm;       theofpHall samples      is slightly
                                                                                                                                of all samples               basic,
                                                                                                                                                       is slightly
                                ranging    between     7.53   and     8.59;   and     ORP     ranges   between
                                basic, ranging between 7.53 and 8.59; and ORP ranges between −75.2 mV and −15.7 mV, −75.2    mV    and   −15.7     mV,    indicat-
                                ing  reducing
                                indicating          conditions
                                              reducing     conditionsin allinsamples.
                                                                                   all samples.Figure    10 10
                                                                                                     Figure    presents
                                                                                                                  presents  thetheStiff
                                                                                                                                     Stiffdiagrams
                                                                                                                                            diagramsfor         the
                                                                                                                                                           for the
                                springs.   The    major   cations      are    Ca  2+2+ and Mg2+   2+, while the major anion is HCO−
                                springs. The major cations are Ca and Mg , while the major anion is HCO3 . Figure 11                               3-. Figure 11

                                presents
                                presents thethechanges
                                                  changesininphysicochemical
                                                                    physicochemical             parameters
                                                                                             parameters     alongalong
                                                                                                                     the the
                                                                                                                          flowflowpath.path.
                                                                                                                                          It canItbe can   be ob-
                                                                                                                                                        observed
                                served   thatisthere
                                that there              is a general
                                                  a general       decrease   decrease
                                                                                  in EC and  in EC ORPandandORP  anand     an increase
                                                                                                                      increase      in pH in  as pHwateras water
                                                                                                                                                             flows
                                flows  downslope
                                downslope       to the to  the lower
                                                        lower      reaches  reaches        of the valley
                                                                               of the valley       (Figure(Figure      12). are
                                                                                                               12). These    These     are observed
                                                                                                                                   observed       by the by     the
                                                                                                                                                            slopes
                                slopes   on  the   plots,  which       are   negative        for EC   and    ORP    and
                                on the plots, which are negative for EC and ORP and positive for pH (Figure 11). Table 6   positive     for  pH     (Figure    11).
                                Table
                                presents6 presents
                                           the calcite thesaturation
                                                             calcite saturation
                                                                           indices that     indices
                                                                                               were that    were calculated
                                                                                                      calculated     for all samples for all   samples
                                                                                                                                           using     PHREEQC using
                                PHREEQC         for  Windows        [34].   Among          the  minerals     whose
                                for Windows [34]. Among the minerals whose saturation indices were calculated by       saturation      indices      were    calcu-
                                lated  by PHREEQC,
                                PHREEQC,        those thatthose       that are
                                                               are made       up of  madeionsupthatofare
                                                                                                      ions   that are in
                                                                                                          dominant       dominant
                                                                                                                            the Malapa  in the
                                                                                                                                             area  Malapa
                                                                                                                                                     (Figurearea10)
                                (Figure   10) are(CaSO
                                are anhydrite        anhydrite
                                                           4 ),      (CaSO
                                                                 aragonite     4 ),
                                                                                and  aragonite
                                                                                        calcite    and
                                                                                                 (CaCO   calcite
                                                                                                          3 ),     (CaCO
                                                                                                               dolomite        ), dolomite
                                                                                                                            (CaMg(CO
                                                                                                                             3               )
                                                                                                                                            3 2 (CaMg(CO
                                                                                                                                                 ) and   gypsum 3 )2)
                                and
                                (CaSOgypsum
                                        4 :H 2 O). (CaSO
                                                     Only  4:H
                                                             the 2 O).  Only
                                                                    saturation     the   saturation
                                                                                       indices    of    indices
                                                                                                      calcite      of
                                                                                                                 and   calcite
                                                                                                                       dolomite    and   dolomite
                                                                                                                                      were     selected  wereto  se-
                                                                                                                                                                 be
                                lected  to beinpresented
                                presented        Figure 13 due  in Figure
                                                                      to their 13compositions
                                                                                     due to their compositions
                                                                                                       of both the cation of both andthe   cation
                                                                                                                                       anion          and (Ca
                                                                                                                                                 species     anion2+ ,

                                Mg2+ and
                                species   (CaHCO
                                               2+, Mg2+− and      HCO    3-).to
                                                                              This      washowto show    how the saturation           indiceswith  change     with
                                                      3 ).   This     was         show             the saturation       indices change                   distance
                                down thedown
                                distance     flow thepath.
                                                         flow path.

                                                                          16
You can also read