Utility-Scale Solar, 2021 Edition - Empirical Trends in Deployment, Technology, Cost, Performance, PPA Pricing, and Value in the United States ...
←
→
Page content transcription
If your browser does not render page correctly, please read the page content below
Utility-Scale Solar, 2021 Edition
 Empirical Trends in Deployment, Technology, Cost,
 Performance, PPA Pricing, and Value in the United States

 Mark Bolinger1, Joachim Seel1,
 Cody Warner, and Dana Robson

 Lawrence Berkeley National Laboratory
 1Corresponding authors

 October 2021

 This material is based upon work supported by the U.S. Department of
 Energy’s Office of Energy Efficiency and Renewable Energy (EERE)
 under Solar Energy Technologies Office (SETO) Agreement Number
 34158 and Contract No. DE-AC02-05CH11231.
 . Photo: Enel Green Power
Utility-Scale Solar, 2021 Edition

 Disclaimer
 This document was prepared as an account of work sponsored by the United States Government. While this document is
 believed to contain correct information, neither the United States Government nor any agency thereof, nor The Regents of
 the University of California, nor any of their employees, makes any warranty, express or implied, or assumes any legal
 responsibility for the accuracy, completeness, or usefulness of any information, apparatus, product, or process disclosed, or
 represents that its use would not infringe privately owned rights. Reference herein to any specific commercial product,
 process, or service by its trade name, trademark, manufacturer, or otherwise, does not necessarily constitute or imply its
 endorsement, recommendation, or favoring by the United States Government or any agency thereof, or The Regents of the
 University of California. The views and opinions of authors expressed herein do not necessarily state or reflect those of the
 United States Government or any agency thereof, or The Regents of the University of California.
 Ernest Orlando Lawrence Berkeley National Laboratory is an equal opportunity employer.

 Copyright Notice
 This document has been authored by an author at Lawrence Berkeley National Laboratory under Contract No. DE-AC02-
 05CH11231 with the U.S. Department of Energy. The U.S. Government retains, and the publisher, by accepting the article
 for publication, acknowledges, that the U.S. Government retains a non-exclusive, paid-up, irrevocable, worldwide license to
 publish or reproduce the published form of this manuscript, or allow others to do so, for U.S. Government purposes

 Acknowledgements
 For their support of this project, the authors thank Ammar Qusaibaty, Michele Boyd, and Becca Jones-Albertus of the U.S.
 Department of Energy Solar Energy Technologies Office. And finally, the authors thank the many individuals from utilities,
 state agencies, and other organizations who contributed data to this report and who, in many cases, responded to
 numerous inquiries and requests. Without the contributions of these individuals and organizations, this report would not be
 possible.

 Photo credit: Utility-Scale Solar, 2021 Edition
 Enel’s 497 MWDC Roadrunner Solar Project 2
 with bifacial modules
 http://utilityscalesolar.lbl.gov
Utility-Scale Solar, 2021 Edition
Purpose and Scope:
 – Summarize publicly available data on key trends in U.S. utility-scale solar sector
 – Focus on ground-mounted projects >5 MWAC
 • There are separate DOE-funded data collection efforts on distributed PV

 – Focus on historical data, emphasizing the most-recent full calendar year
Data and Methods:
 – See summary at end of PowerPoint deck
Funding:
 – U.S. Department of Energy’s Solar Energy Technologies Office
Products and Availability:
 – This report deck is complemented by an Excel data file, a written technical brief, and interactive visualizations
 – All products are available at: utilityscalesolar.lbl.gov

 Utility-Scale Solar, 2021 Edition
 3
 http://utilityscalesolar.lbl.gov
Report Contents

Deployment and Technology Trends
Capital Costs (CapEx) and O&M Costs
Performance (Capacity Factors)
Levelized Cost of Energy (LCOE) and Power Purchase Agreement (PPA) Prices
Wholesale Market Value
PV+Battery Hybrid Plants
Concentrating Solar Thermal Power (CSP) Plants
Capacity in Interconnection Queues
Summary
Data and Methods

 Utility-Scale Solar, 2021 Edition
 4
 http://utilityscalesolar.lbl.gov
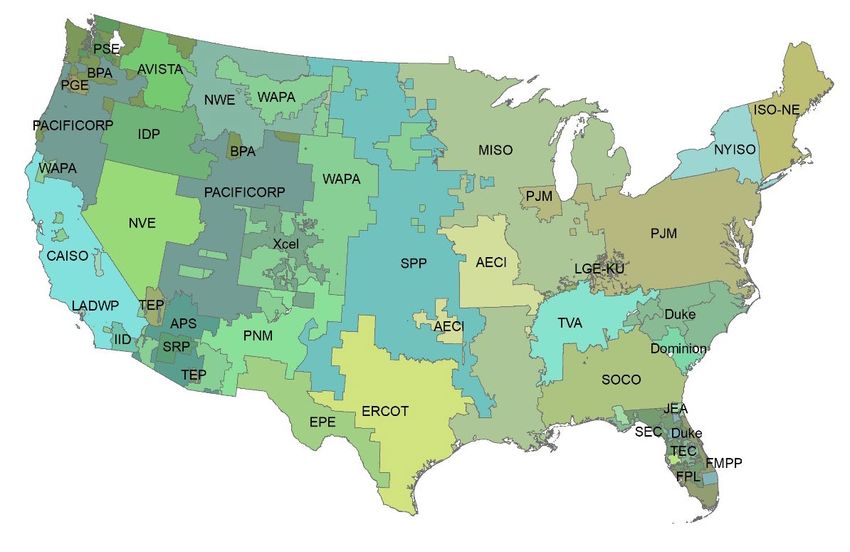
Regional boundaries applied in this analysis include the seven
independent system operators (ISO) and two non-ISO regions

 Source of the Irradiance data:
 https://nsrdb.nrel.gov/

 Utility-Scale Solar, 2021 Edition
 5
 http://utilityscalesolar.lbl.gov
Deployment and Technology Trends

 Utility-Scale Solar 2021 Edition
 http://utilityscalesolar.lbl.gov 6

Utility-scale projects have the greatest capacity share
in the U.S. solar market
Annual Solar Capacity Additions (GW) Cumulative Solar Capacity (GW) Wood Mackenzie and SEIA report that
 55 440
 the utility-scale sector added 14 GWDC
 50
 Utility-Scale CSP
 400
 or 73% of all new solar capacity of
 45
 Utility-Scale PV
 360
 2020. It was the year with the greatest
 Commercial PV
 40 Residential PV 320
 utility-scale solar capacity expansion in
 the United States so far, representing a
 35 280
 PV is in GW DC and CSP is in GW AC year-over-year growth of 65%.
 30 240
 Columns show annual capacity
 25
 Areas show cumulative capacity
 200 Utility-scale solar accounts for 61% of
 20 160 cumulative solar capacity.
 15 120
 10 80
 5 40
 Our data analysis focuses on a subset
 0 0
 of this sample—all projects larger than
 2010
 2011
 2012
 2013
 2014
 2015
 2016
 2017
 2018
 2019
 2020
 2021e
 2022e
 2023e
 2024e
 2025e
 2026e
 2027e
 2028e
 2029e
 2030e
 5MWAC that were completed by the
 Installation Year end of 2020:
 Sources: Wood Mackenzie/SEIA Solar Market Insight Reports, Berkeley Lab
 – 2019: 108 new projects totaling 6.1 GWDC
 or 4.6 GWAC
We define “utility-scale” as any ground-mounted project that is larger than 5 MWAC
 – 2020: 161 new projects totaling 12.8 GWDC
 Smaller systems are analyzed in LBNL’s “Tracking the Sun” series (trackingthesun.lbl.gov) or 9.6 GWAC

 Note: Wood Mackenzie/SEIA’s graph above defines utility-scale solar as >1 MWDC while Utility-Scale Solar, 2021 Edition
 7
 this report uses a definition of >5 MWAC. http://utilityscalesolar.lbl.gov
Solar power was the second largest source of U.S.
electricity-generating capacity additions in 2020

Annual Capacity Additions (GWAC) Solar Capacity Additions (% of Total) Led by the utility-scale sector,
45
 Utility-Scale Solar
 45% solar power has comprised
 Total Solar (right axis) >20% of all generating
40 Distributed Solar 40%
 Wind capacity additions in the
35 Other RE 35% United States in each of the
 Other non-RE past eight years.
30 30%
 Gas
25 Coal 25%
 Utility-Scale Solar
 (right axis) In 2020, solar made up 38%
20 20%
 of all U.S. capacity additions
15 15% (with utility-scale accounting
10 10% for 27%), behind wind (42%)
 but ahead of natural gas
 5 5% (19%).
 Distributed Solar (right axis)
 0 0%
 2007 2008 2009 2010 2011 2012 2013 2014 2015 2016 2017 2018 2019 2020
 Bars represent annual capacity additions in GWAC (left axis), lines represent solar’s capacity share (right axis)

 Sources: ABB, AWEA, Wood Mackenzie/SEIA Solar Market Insight Reports, Berkeley Lab

 Note: This graph follows Wood Mackenzie/SEIA split between distributed and utility-scale Utility-Scale Solar, 2021 Edition
 8
 solar, rather than our 5 MWAC threshold. http://utilityscalesolar.lbl.gov
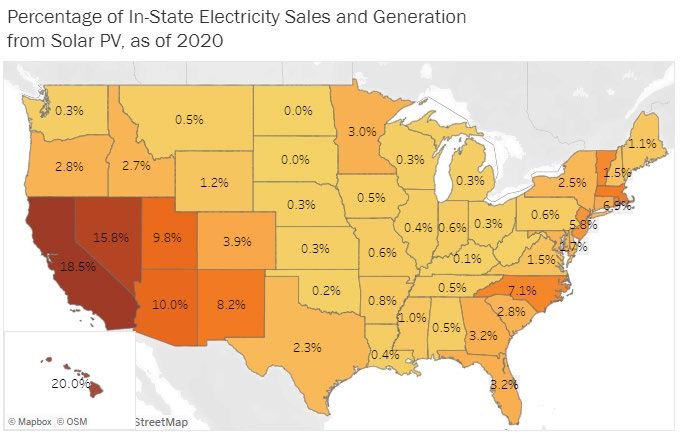
Solar penetration rates topped 22% in California
 and exceeded 10% in four other states
 Solar generation as a % Solar generation as a % Solar penetration rates vary considerably depending on whether they are
 State
 of in-state generation of in-state load calculated as a percentage of generation or load (e.g., see Vermont).
 Utility-Scale Utility-Scale
 All Solar All Solar
 Solar Only Solar Only
California 22.7% 14.4% 19.4% 12.3% In 2020, California exceeded 20% of solar penetration levels based on
Massachusetts 18.9% 7.6% 7.9% 3.2% generation share while four other states surpassed 10%. Four states had
Hawaii 16.5% 5.0% 20.0% 6.1% >10% based on load share.
Nevada 14.8% 12.7% 16.1% 13.8%
Vermont
Utah
 14.3%
 8.1%
 7.4%
 6.6%
 6.9%
 9.8%
 3.6%
 8.0%
 Contribution of utility-scale also varies (a minority in Northeast states and
Arizona 7.9% 5.3% 10.9% 7.4%
 Hawaii, a majority in Southwest states and overall U.S.).
North Carolina 7.5% 7.2% 7.1% 6.9%
New Jersey 6.4% 2.5% 5.8% 2.2%
Rhode Island 6.1% 2.5% 6.9% 2.8%
New Mexico 5.9% 4.9% 8.2% 6.7%
Maryland 4.4% 1.6% 2.8% 1.0%
Colorado 4.0% 2.8% 3.9% 2.7%
Delaware 3.6% 1.2% 1.7% 0.6%
Georgia 3.5% 3.3% 3.2% 2.9%
Idaho 3.4% 2.9% 2.7% 2.3%
Minnesota 3.3% 3.1% 3.0% 2.8% You can explore this data interactively at
Florida 3.1% 2.6% 3.2% 2.8% https://emp.lbl.gov/capacity-and-
New York 2.5% 0.8% 2.5% 0.8%
 generation-state
Connecticut 2.3% 0.5% 3.6% 0.8%
 Rest of U.S. 0.8% 0.6% 1.0% 0.7%
 TOTAL U.S. 3.3% 2.2% 3.6% 2.5%

 Note: In this table, “utility-scale” refers to projects ≥ 1 MWAC, Utility-Scale Solar, 2021 Edition
 9
 rather than our typical 5 MWAC threshold. http://utilityscalesolar.lbl.gov

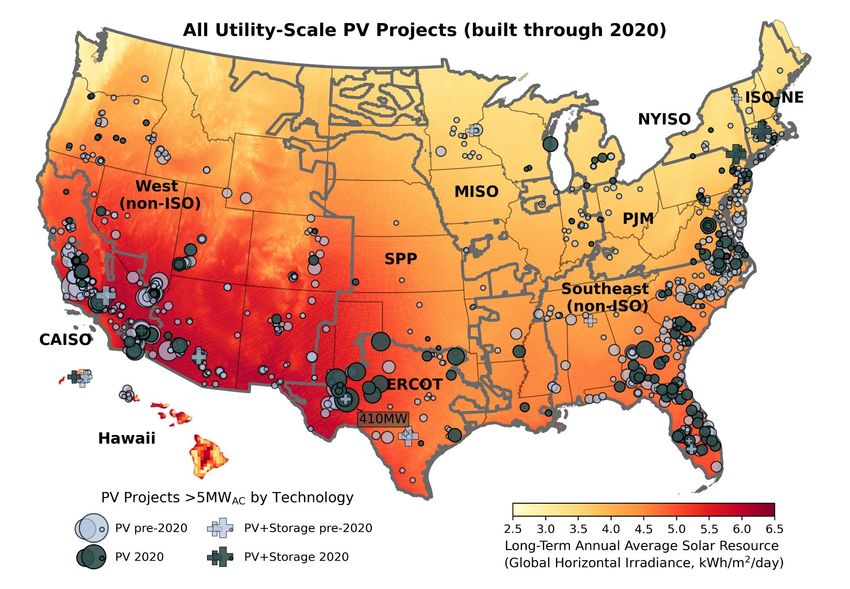
In 2020, Texas led the nation in utility-scale solar deployment

 Texas completed some of the largest projects we
 have seen in the US (up to 410 MWAC).

 Fixed-tilt ( ) projects are increasingly only being
 built on particularly challenging sites (e.g., due to
 terrain or wind loading) or in the least-sunny regions in
 the northeast.

 Other high-latitude states such as Oregon, Wisconsin,
 Michigan, New York and Maine added predominantly
 tracking projects in 2020 ( ).

 In 2020, storage ( ) was added to already existing
 (1) and new (5) PV projects. 4 of these were built in
 the northeast, while high penetration regions in HI and
 CA added one each.

 2 new states added their first utility-scale PV projects:
 Wisconsin and Louisiana.

 Utility-Scale Solar, 2021 Edition
 You can explore this data interactively at https://emp.lbl.gov/technology-trends 10
 http://utilityscalesolar.lbl.gov
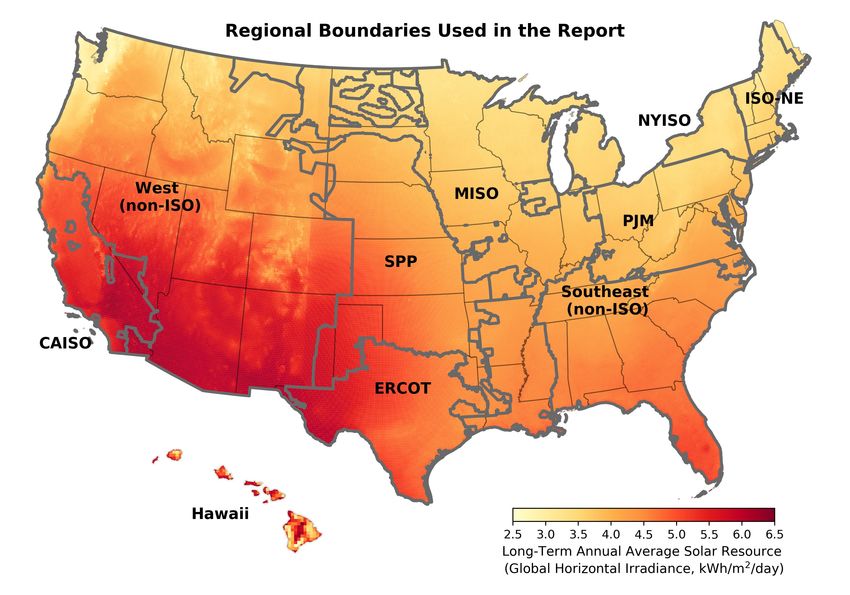
Utility-scale solar has become a growing source of electricity
in all regions of the United States

 Utility-scale PV is well-represented
 throughout the nation, with the
 exception of upper-Midwestern states
 in the “wind belt”.

 Recent recipients of new utility-scale
 solar projects in the north (Idaho,
 Minnesota) did not add new capacity
 in 2020, while Montana, the Dakotas,
 Iowa, New Hampshire, and West
 Virginia still await their first utility-scale
 solar projects in our sample.

 Utility-Scale Solar, 2021 Edition
 You can explore this data interactively at https://emp.lbl.gov/technology-trends 11
 http://utilityscalesolar.lbl.gov
Texas and the Southeast added the most utility-scale solar
 capacity in 2020
PV project population: 969 projects totaling 38,745 MWAC
 Texas (ERCOT) surpassed California
Annual Capacity Additions (GWAC) Cumulative Capacity (GWAC)
 as the leader of utility-scale solar
10 40
 West (non-ISO) Columns show annual capacity growth in 2020, adding 2.5 GWAC or
 9 36
 Southeast (non-ISO)
 Areas show cumulative capacity 26% of total U.S. additions.
 8 SPP 32
 7 PJM 28
 NYISO
 6
 MISO
 24 Florida (1.6 GWAC), Georgia, and
 5 ISO-NE 20 Virginia (both 0.7 GWAC) led solar
 4 Hawaii 16
 ERCOT
 growth in the Southeast in 2020.
 3 12
 CAISO California, which added 1.6 GWAC in
 2 8
 2020, still accounts for the most
 1 4
 0 0
 installed capacity on a cumulative basis
 2010 2011 2012 2013 2014 2015 2016 2017 2018 2019 2020 (32% of the U.S. total).
 Installation Year

 Utility-Scale Solar, 2021 Edition
 You can explore this data interactively at https://emp.lbl.gov/capacity-and-generation-state 12
 http://utilityscalesolar.lbl.gov
Projects with tracking technology dominated 2020 additions

PV project population: 969 projects totaling 38,745 MWAC

 Projects using single-axis tracking
 have consistently exceeded fixed-tilt
 installations since 2015, but achieved
 a new level of dominance in 2020,
 with 89% of all new capacity using
 tracking.

 Upfront cost premiums for trackers
 have fallen over the years, resulting in
 favorable economics in most of the
 United States thanks to increased
 generation.

 Utility-Scale Solar, 2021 Edition
 You can explore this data interactively at https://emp.lbl.gov/technology-trends 13
 http://utilityscalesolar.lbl.gov
Projects with c-Si modules led thin-film additions in 2020

PV project population: 969 projects totaling 38,745 MWAC

 c-Si modules continued their clear
 lead (71% of newly installed capacity)
 relative to thin-film modules (29%),
 though the latter have become more
 popular since 2018 as they were not
 subject to Section 201 import tariffs.

 Hanwha had the highest market share
 among c-Si modules in our sample,
 followed by Jinko and Trina. All thin-
 film modules in our 2020 sample were
 made by First Solar.

 Utility-Scale Solar, 2021 Edition
 You can explore this data interactively at https://emp.lbl.gov/technology-trends 14
 http://utilityscalesolar.lbl.gov
The median global horizontal irradiance (GHI) at utility-scale solar
project sites has stabilized since 2017
PV project population: 969 projects totaling 38,745 MWAC The median solar resource (measured in
 long-term global horizontal irradiance—GHI)
 at new project sites has declined since
Long-Term Average Annual GHI at Newly Built Sites (kWh/m2/day) All PV development began expanding to less-sunny
 0 5 10 15 20PV
 Fixed-Tilt
 6.0 states post-2013, but has largely stabilized
 Tracking PV since 2017.
5.5
 Fixed-tilt PV is increasingly relegated to
 lower-insolation sites, while tracking PV is
5.0
 pushing into those same areas (note the
 decline in its 20th percentile).
4.5

 Exceptions are fixed-tilt installations in windy
4.0 regions (Florida), on brownfields and landfill
 Markers show median values, with 20th and 80th percentiles sites, and on particularly challenging terrain.
3.5
 2010 2011 2012 2013 2014 2015 2016 2017 2018 2019 2020
 n=10 n=35 n=44 n=38 n=65 n=89 n=152 n=166 n=96 n=108 n=161 All else equal, the buildout of lower-GHI sites
 0.2 GW 0.5 GW 1.0 GW 1.3 GW 3.2 GW 2.9 GW 7.4 GW 4.1 GW 4. GW 4.6 GW 9.6 GW dampens sample-wide capacity factors
 Installation Year (reported later).

 Utility-Scale Solar, 2021 Edition
 15
 http://utilityscalesolar.lbl.gov
The median inverter loading ratio (ILR) continued to gradually climb

PV project population: 969 projects totaling 38,745 MWAC As module prices have fallen (faster
 than inverter prices), developers have
Inverter
 0 Loading Ratio (DC:AC)
 5 10 15 20
 oversized the DC array capacity
1.50 All PV relative to the AC inverter capacity to
 Fixed-Tilt PV enhance revenue and reduce output
1.40 Tracking PV
 variability.
1.30
 The median inverter loading ratio (ILR
1.20
 or DC:AC ratio) increased slightly to
 1.34 in 2020, compared with 1.32 in
1.10
 2019.
 Markers show median values, with 20th and 80th percentiles
1.00
 2010 2011 2012 2013 2014 2015 2016 2017 2018 2019 2020
 n=10 n=35 n=44 n=38 n=65 n=89 n=150 n=166 n=96 n=108 n=161 All else equal, a higher ILR should
 0.2 GW 0.5 GW 1.0 GW 1.3 GW 3.2 GW 2.9 GW 7.4 GW 4.1 GW 4. GW 4.6 GW 9.6 GW
 boost capacity factors (reported later).
 Installation Year

 Utility-Scale Solar, 2021 Edition
 16
 http://utilityscalesolar.lbl.gov
Capital Costs (CapEx) and O&M Costs

 Utility-Scale Solar 2021 Edition
 http://utilityscalesolar.lbl.gov 17
Median installed costs of PV have fallen by 74% (or 12% annually)
since 2010, to $1.42/WAC ($1.05/WDC) in 2020
Sample: 848 projects totaling 34,020 MWAC The lowest 20th percentile of project
 costs fell from $1.3/WAC ($1.0/WDC) in
 2019 to $1.1/WAC ($0.9/WDC) in 2020.

 The lowest-cost project among the 68
 data points in 2020 was $0.9/WAC
 ($0.7/WDC).

 Historical sample is robust (covering
 99% of installed capacity through
 2019). 2020 data covers 41% of new
 projects or 63% of new capacity.

 This sample is backward-looking and
 does not reflect the costs of projects
 built in 2021/2022.

 Utility-Scale Solar, 2021 Edition
 18
 http://utilityscalesolar.lbl.gov
The cost premium for tracking projects relative to fixed-tilt has
diminished over time
Sample: 848 projects totaling 34,020 MWAC Through 2016, tracking projects in our sample
 were, on average, regularly more expensive
 (though by varying amounts) than fixed-tilt
 projects. This relationship became more nuanced
 starting in 2017, and in 2019, tracking projects
 ($1.6/WAC or $1.2/WDC) appeared to be cheaper
 than fixed-tilt projects ($1.7/WAC or $1.3/WDC).

 This apparent reversal may be driven by
 challenging construction environments for fixed-
 tilt projects (e.g., high wind loads, sensitive
 brown-field sites) as well as sampling issues.
 However, for any individual project, using
 trackers presumably has a higher CapEx than
 mounting at a fixed-tilt.

 In our 2020 sample, trackers ($1.4/WAC or
 $1.1/WDC) once again exhibit a premium over
 fixed-tilt plants ($1.2/WAC or $0.9/WDC). Trackers
 can sustain some amount of higher upfront costs
 because they deliver more kWh per kW.

 Utility-Scale Solar, 2021 Edition
 19
 http://utilityscalesolar.lbl.gov
Larger utility-scale solar projects (100-500 MW) cost 17% less than smaller projects (5-20 MW) per MW of installed capacity in 2020 Sample in 2020: 68 projects totaling 5,123 MWAC Differences in project size could potentially explain cost variation—we focus only on 2020 for this slide. Cost savings seem to occur especially in the third size bin (50-100 MWAC) and fourth size bin (100-500 MWAC)—at $1.35/WAC and $1.29/WAC. In $/WDC terms, price decline is even more obvious over the first three bins: $1.23/WDC for 5-20MW $1.05/WDC for 20-50MW $0.95/WDC for 50-100MW $0.98/WDC for 100-500MW Utility-Scale Solar, 2021 Edition 20 http://utilityscalesolar.lbl.gov
Improvements in operation and maintenance (O&M) costs have
 plateaued in recent years
O&M costs ($2020/kWAC-yr) O&M costs ($2020/MWh) 13 utilities report solar O&M costs for
50 25 plants that they own, representing a
 Mean of all projects mix of technologies and at least one
 denominated in capacity full operational year (at least 2020).
40 20

 Average O&M costs for the
30 15
 cumulative sample have declined
 from about $32/kWAC-year in 2011 to
20 10 about $16/kWAC-year 2020.

10 5 The overall cost range among utilities
 Mean of all projects Whiskers represent least narrowed in 2020 relative to 2018 and
 denomitated in generation
 0
 and most expensive utility
 0
 2019.
 2011 2012 2013 2014 2015 2016 2017 2018 2019 2020
 The blue line expresses annual O&M costs in capacity terms (left axis), the red line in energy terms (right axis)
 These O&M costs are only one part of
 Cost Scope (per guidelines for FERC Form 1):
 • Includes supervision and engineering, maintenance, rents, and training total operating expenses (OpEx)—
 • Excludes payments for property taxes, insurance, land royalties, performance see Cost Scope in box to the left.
 bonds, various administrative and other fees, and overhead
 Utility-Scale Solar, 2021 Edition
 21
 http://utilityscalesolar.lbl.gov
Performance (Capacity Factors)

 Utility-Scale Solar 2021 Edition
 http://utilityscalesolar.lbl.gov 22
24% median PV net capacity factor (cumulative, sample-wide), but with large project-level range from 9%-36% PV performance sample: 752 projects totaling 28,652 MWAC Project-level variation in PV Cumulative AC Capacity Factor 40% capacity factor driven by: 35% Median Solar Resource (GHI): Strongest solar Individual Project resource quartile has a ~8 percentage 30% point higher capacity factor than lowest 25% resource quartile 20% Tracking: Adds ~4 percentage points to 15% capacity factor on average, depending on solar resource quartile 10% Inverter Loading Ratio (ILR): Highest Sample includes 752 projects totaling 28.7 GWAC that came online from 2007-2019 5% ILR quartiles have on average ~3 0% percentage point higher capacity factors 1 2 3 4 1 2 3 4 1 2 3 4 1 2 3 4 1 2 3 4 1 2 3 4 1 2 3 4 1 2 3 4 than lowest ILR quartiles ILR Quartile ILR Quartile ILR Quartile ILR Quartile ILR Quartile ILR Quartile ILR Quartile ILR Quartile Fixed-Tilt Tracking Fixed-Tilt Tracking Fixed-Tilt Tracking Fixed-Tilt Tracking 1st Quartile GHI 2nd Quartile GHI 3rd Quartile GHI 4th Quartile GHI Utility-Scale Solar, 2021 Edition You can explore this data interactively at https://emp.lbl.gov/pv-capacity-factors 23 http://utilityscalesolar.lbl.gov
Tracking boosts capacity factors by up to 5 percentage points
in high-insolation regions
Sample: 752 projects totaling 28,652 MWAC
Average Cumulative AC Capacity Factor Not surprisingly, capacity
30% factors are highest in
 Fixed-Tilt Tracking
 California and the non-ISO
25%
 West, and lowest in the
20% Northeast (ISO-NE and
 NYISO).
15%

 157 projects, 5,016 MW

 148 projects, 7,776 MW
 51 projects, 1,447 MW

 79 projects, 2,974 MW

 77 projects, 3,056 MW

 41 projects, 2,299 MW

 35 projects, 3,153 MW
 12 projects, 186 MW

 17 projects, 305 MW

 16 projects, 264 MW

 65 projects, 745 MW

 10 projects, 231 MW

 19 projects, 761 MW
 8 projects, 121 MW

 5 projects, 157 MW
 Tracking provides more
 2 projects, 28 MW

 6 projects, 74 MW

 2 projects, 44 MW

 2 projects, 16 MW
10%

 benefit in high-insolation
 5%
 regions, leading to a greater
 0% proportion of tracking
 ISO-NE NYISO MISO PJM Hawaii Southeast ERCOT SPP West CAISO
 (non-ISO) (non-ISO) projects in those regions.
 Note: The regions are defined in the earlier slides with a map of the United States

 Utility-Scale Solar, 2021 Edition
 You can explore this data interactively at https://emp.lbl.gov/pv-capacity-factors 24
 http://utilityscalesolar.lbl.gov
Since 2013, competing drivers have caused average capacity factors by project vintage to stagnate Average Capacity Factor in 2020 Index of Capacity Factor Influences (2010=100) Average capacity factors increased 30% 200 Capacity factor Prevalance from 2010- to 2013-vintage projects, of tracking 25% 175 due to an increase in: ILR (from 1.17 to 1.28) 20% 150 tracking (from 14% to 59% of projects) ILR (DC:AC) average site-level GHI (from 4.97 to 5.37 15% 125 kWh/m2/day) 10% 100 Since 2013, however, ILRs have Solar resource moved only slightly higher (to 1.31 in 5% 75 2019), while tracking (80% in 2019) and GHI (4.82 kWh/m2/day) have 0% 50 2010 2011 2012 2013 2014 2015 2016 2017 2018 2019 2020 moved in opposite directions, Commercial Operation Year (COD Year) resulting in capacity factor stagnation The columns represent the capacity factor (left axis), the lines show changes in major drivers (right axis) (on average) Recent flat-to-declining trend is not necessarily negative, but rather a sign of a market that is expanding geographically into less-sunny regions Utility-Scale Solar, 2021 Edition You can explore this data interactively at https://emp.lbl.gov/pv-capacity-factors 25 http://utilityscalesolar.lbl.gov
Fleet-wide performance has declined as projects age, but is difficult to assess and attribute at the project level Indexed Capacity Factor (Year 1 = 100%) Graph shows plant-level performance 105% decline from all possible degradation Median (with 25th to 75th percentile range) pathways—both recoverable and unrecoverable—including: 100% Module degradation 95% BOP degradation 1.2%/year degradaton Soiling (for reference) 90% Downtime (unplanned outages, scheduled maintenance, 85% curtailment) 80% Weather-normalized fleet-wide 1 2 3 4 5 6 7 8 9 10 11 12 performance decline appears to be Project Age (Years) running at ~1.2%/year on average Should not be confused with often- Graph shows indexed capacity factors in each full calendar year following COD. cited lesser rates that pertain solely Capacity factors have been normalized to correct for inter-year resource variation. to module degradation Utility-Scale Solar, 2021 Edition 26 http://utilityscalesolar.lbl.gov
Levelized Cost of Energy (LCOE) and
Power Purchase Agreement (PPA) Prices

 Utility-Scale Solar 2021 Edition
 http://utilityscalesolar.lbl.gov 27
LCOE and PPA price analysis: data sets and methodology

Project-level LCOE is based on empirical CapEx and capacity factor data presented earlier, as well as:
 – OpEx and project life that change with vintage: OpEx declines from $35/kWDC-yr in 2007 to $15/kWDC-yr in 2020 (levelized, in
 2020$); project life increases from 21.5 years in 2007 to 33.7 years in 2020 (both based on prior LBNL research)
 – Weighted average cost of capital (WACC) based on a constant 70%/30% debt/equity ratio and time-varying market rates
 – Combined income tax rate of 38% pre-2018 and 25% post-2017; 5-yr MACRS; inflation expectations ranging from 1.9%-2.6%

PPA prices are from utility-scale solar plants built since 2007 or planned for future installation, and include:
 – 333 PV-only contracts totaling 22.8 GWAC
 – 47 PV+battery contracts totaling 5.4 GWAC of PV capacity and 3.1 GWAC of battery capacity (presented in a later section)
 – 5 concentrating solar thermal power (CSP) contracts totaling 1.2 GWAC (presented in a later section)
• PPA prices reflect the bundled price of electricity and RECs as sold by the project owner under the PPA
 – Dataset excludes merchant plants, projects that sell renewable energy certificates (RECs) separately, and most direct retail sales
 – Prices reflect receipt of state and federal incentives (e.g., the ITC), and as a result do not reflect solar generation costs
• We also present LevelTen Energy data on PPA offers; these are often for shorter contract durations, and
 levelization details are unclear

 Utility-Scale Solar, 2021 Edition
 28
 http://utilityscalesolar.lbl.gov
LCOE has fallen by 85% (or 17% annually) since 2010, to $34/MWh
 (without the ITC)
Generation-Weighted Average and Project-Level LCOE (2020 $/MWh) Driven by lower capital
 costs costs and, at least
350 through 2013, higher
 Sample size is 817 projects totaling 33.6 GWAC.
 capacity factors (as well as
 Bubble size corresponds to individual project capacity.
300 lower operating expenses,
 longer design life, and
250 improved financing terms),
 300 MW utility-scale PV’s average
200 LCOE has fallen by about
 8 MW 85% since 2010, to
150 $34/MWh in 2020 (not
 including the ITC).
100

 50 The standard deviation of
 project-level LCOEs has
 0 declined sharply among
 2010 2011 2012 2013 2014 2015 2016 2017 2018 2019 2020 recent vintages (though
 Commercial Operation Year the coefficient of variation
 has been more stable).

 Utility-Scale Solar, 2021 Edition
 See interactive visualization at https://emp.lbl.gov/capex-lcoe-and-ppa-prices-region 29
 http://utilityscalesolar.lbl.gov
Utility-Scale PV’s LCOE has gradually converged across regions

Generation-Weighted Average LCOE (2020 $/MWh) Lower-insolation regions
 (ISO-NE, NYISO, PJM,
350 MISO) will always have
 PJM Sample size is 817 projects totaling 33.6 GWAC higher LCOEs than
300 higher-insolation regions
 (ERCOT, the non-ISO
 Southeast West and Southeast),
250
 (non-ISO) but the difference has
200 been narrowing (the
 ISO-NE regional standard
 MISO
150 West deviation declines on
 (non-ISO) Hawaii average by 23% per
100 year).
 CAISO NYISO
 50 Nationwide SPP Dashed segments of
 ERCOT lines indicate no data
 0 (i.e.,
Levelized PPA prices have followed LCOE lower in all regions,
 though the pace of decline has recently stagnated
 Full sample: 333 PPAs, 22.8 GWAC Post-2014 sample: 176 PPAs, 13.6 GWAC
Levelized PPA Price (2020 $/MWh) Levelized PPA Price (2020 $/MWh)
 CAISO
250 West (non-ISO) 100 CAISO West (non-ISO)
 20 MW MISO MISO SPP
 10 MW ERCOT PJM
 SPP
200 80 NYISO Southeast (non-ISO)
 ERCOT
 PJM ISO-NE Hawaii
 NYISO 60
150
 Southeast (non-ISO)
 500 MW
 550 MW ISO-NE
100 Hawaii 40

 50 20

 0 0
 2006 2008 2010 2012 2014 2016 2018 2020 2015 2016 2017 2018 2019 2020 2021
 PPA Execution Date PPA Execution Date

 o Power Purchase Agreement (PPA) prices are levelized over the full term of each contract, after accounting for any escalation
 rates and/or time-of-delivery factors, and are shown in real 2020 dollars
 o Aided by the 30% ITC, most recent PPAs in our sample are priced around $20/MWh for projects in CAISO and the non-ISO
 West, and $30-$40/MWh for projects elsewhere in the continental United States
 o Hawaiian PPAs are often higher-priced (and most include battery storage, and so are not shown here—see later section)
 o >95% of the sample is currently operational

 Utility-Scale Solar, 2021 Edition
 You can explore this data interactively at https://emp.lbl.gov/pv-ppa-prices 31
 http://utilityscalesolar.lbl.gov
Nationwide, average PPA prices have fallen by ~85% (or 15% per
year) since 2009, though the pace of decline has recently stagnated
Average Levelized PPA Price (2020 $/MWh)
 This graph focuses on national
 and regional average PPA
160 prices, rather than project-level
 CAISO (as in the prior slide).
140
 Southeast (non-ISO)
120 Note a slight uptick in the
 national average since 2019.
100
 Year-Region combinations with
 80
 PJM fewer than 2 PPAs are
 60 excluded from the graph
 MISO (dashed line segments indicate
 40 Nationwide that the line is skipping over
 20 ERCOT such years).
 West (non-ISO)
 0 The graph reflects PV-only
 2009 2010 2011 2012 2013 2014 2015 2016 2017 2018 2019 2020 2021(P)
 pricing, not PV+battery
 PPA Execution Year (PV+battery PPA prices are
 presented separately, in a later
 section).

 Utility-Scale Solar, 2021 Edition
 You can explore this data interactively at https://emp.lbl.gov/pv-ppa-prices 32
 http://utilityscalesolar.lbl.gov
Solar PPA prices are now often competitive with wind PPA prices, as
 well as the cost of burning fuel in existing gas-fired generators
Levelized PPA and Gas Price (2020 $/MWh) 2020 $/MWh
 180 50
 PV PPA prices Range of AEO21 natural gas fuel cost projections
 160
 140 40
 Levelized 20-year AEO21 reference case natural gas fuel cost projection
 120
 EIA gas price projections
 30
 100
 80
 20
 60
 40
 10
 20 Median PV PPA price (with 10th and 90th percentile range)
 Wind PPA prices
 0
 2009 2010 2011 2012 2013 2014 2015 2016 2017 2018 2019 2020 2021 0
 2022 2024 2026 2028 2030 2032 2034 2036 2038 2040
 PPA Execution Date and Gas Projection Year

 o Left graph shows that solar PPA prices have largely closed the gap with wind, and both are competitive with levelized gas price projections.
 o Right graph compares recent solar PPA prices to range of gas price projections from AEO 2021. Although solar PPAs signed post-2017 are
 initially priced higher than the cost of burning fuel in an existing combined-cycle natural gas unit (NGCC), over longer terms PV is potentially
 more competitive (depending on what happens to the price of natural gas), and can help protect against fuel price risk.
 o PV PPAs are priced to recover both capital and other ongoing operational costs—for an NGCC, this would add another ~$23-$49/MWh to fuel
 costs.

 Utility-Scale Solar, 2021 Edition
 33
 http://utilityscalesolar.lbl.gov
Levelized PPA prices track the LCOE of utility-scale PV

Sample: 817 projects totaling 33,599 MWAC Prior LCOE graphs exclude the ITC,
 but here we graph LCOE both with
Generation-Weighted Average LCOE and Levelized PPA Price (2020 $/MWh) and without the ITC, plotted against
 240 PPA prices by COD year (rather than
 by PPA execution date).
 200
 LCOE without the ITC
 Levelized PPA prices fall within the
 160
 range of the two LCOE curves over
 time, and since 2016 have closely
 120
 tracked LCOE with the ITC,
 LCOE with the ITC suggesting full pass-through of the
 80 credit and a competitive PPA market.
 PPA price
 40
 Also notable is the declining value of
 0 the ITC in $/MWh terms: while the
 COD: 2010 2011 2012 2013 2014 2015 2016 2017 2018 2019 2020 2021 credit has remained constant over
Projects: 10 28 39 38 62 85 145 159 93 91 67 TBD time in percentage terms (at 30%), it
 MW-AC: 175 423 894 1,344 3,152 2,840 7,377 3,991 3,929 4,379 5,095 TBD has shrunk in $/MWh terms along
 Commercial Operation Year with the CapEx to which it is applied.

 Utility-Scale Solar, 2021 Edition
 34
 http://utilityscalesolar.lbl.gov
LevelTen Energy utility-scale PV PPA price indices

LevelTen PPA Price Index (2020 $/MWh, 25th percentile of first-year offer price)
 To augment our PPA price
 sample, and to gain visibility
 $40 into corporate PPA pricing
 PJM (which is not well-represented
 $35
 MISO within our empirical PPA
 SPP sample), we present LevelTen
 $30
 CAISO Energy’s PPA Price Index.
 $25
 ERCOT
 $20
 LevelTen pricing represents the
 25th percentile of offers
 $15 (levelization details unclear),
 rather than pricing from
 $10 executed contracts.
 Note: LevelTen does not report PPA prices for NYISO or ISO-NE.
 $5
 In the five ISOs that LevelTen
 $0 tracks, offer prices rose
 2018-Q3 2019-Q1 2019-Q3 2020-Q1 2020-Q3 2021-Q1 gradually throughout 2020, but
 have mostly stabilized so far in
 2021.

 Utility-Scale Solar, 2021 Edition
 35
 http://utilityscalesolar.lbl.gov
Wholesale Market Value

 Utility-Scale Solar 2021 Edition
 http://utilityscalesolar.lbl.gov 36
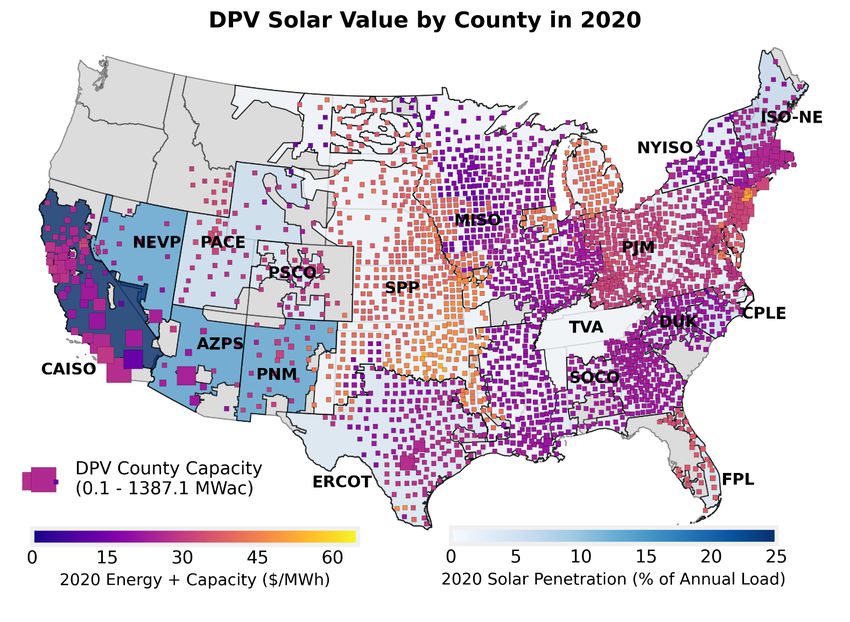
Wholesale market value analysis: data sets and methodology

We estimate the wholesale market value for each utility-scale PV project larger than 1 MW (as reported on Form EIA-860) and for
distributed PV (DPV) capacity for each county (as reported on Form EIA-861). We then aggregate the project-level data as generation-
weighted averages for all seven ISOs and ten additional balancing authorities.

We draw from project-level modeled hourly solar generation (using NREL’s System Advisor Model and site- and year-specific insolation
data from NREL’s National Solar Radiation Database) and de-bias the generation by leveraging ISO-reported aggregate solar generation
and plant-level reported generation by Form EIA-923.

Energy value is the product of hourly solar generation by plant or county and concurrent wholesale energy prices
 – Plant-level debiased hourly solar generation ∑ ℎ ∗ ℎ
 – Real-time energy price from nearest pricing node =
 ∑ ℎ
 – Focus on annual value of solar from all sectors

Capacity value is the product of a plant’s or county’s capacity credit and capacity prices
 – Capacity credit based on plant-level profile; varies by month, season, or year ∑ ∗ ∗
 – Capacity prices from respective ISO region; prices vary by month, season, or year =
 ∑
 – Estimate bilateral capacity prices for regions without organized capacity markets
 – Focus on annual value of solar from all sectors
 – Calculate capacity value for all solar, even if some solar does not participate in capacity markets

 Total market value is simply the sum of energy and capacity value and does not include any potential additional revenue streams
 (ancillary market revenues, renewable energy credits, infrastructure deferral, resilience, energy security, or any other environmental or
 social values that are not already internalized in wholesale energy and capacity markets).

 Utility-Scale Solar, 2021 Edition
 37
 http://utilityscalesolar.lbl.gov
Only two of the seven ISOs currently report solar curtailment:
CAISO and ERCOT
Monthly CAISO Solar Curtailment Monthly ERCOT Solar Curtailment Quarterly and Annual Solar
8% 16% 7% 6.7%
 ERCOT 6.3%
7% 14%
 6%
6% 12%
 5% 5.0%
5% 10%
 4%
4% 8% 3.3%
 Q4
3% 6% 3%
 CAISO 2.4%
 Q3
2% 4% 2%
 1.5%
1% 2% 1.0%
 1% 0.8% 0.9% Q2
 0.6%
0% 0% 0.1% 0.2% Q1
 Jan-Dec Jan-Dec Jan-Dec Jan-Dec Jan-Dec Jan-Dec 0%
 2015 2016 2017 2018 2019 2020 2015 2016 2017 2018 2019 2020
 2015 2016 2017 2018 2019 2020
 The orange columns represent curtailment in CAISO (left axis), the blue ones in ERCOT (right axis) CAISO ERCOT

CAISO: 1,659 GWh of solar curtailed in 2020, equivalent to the annual output of a hypothetical 725 MWAC PV project operating at an average CA capacity
factor of 26.1% (which would have been 27.5% if not for curtailment).
ERCOT: 671 GWh of solar curtailed in 2020, equivalent to the annual output of a hypothetical 385 MWAC PV project operating at an average TX capacity
factor of 19.9% (which would have been 21.5% if not for curtailment).
Much higher rate of curtailment in ERCOT (6.3%) than in CAISO (3.3%) in 2020, even though solar’s penetration rate is far lower in ERCOT (3%) than CAISO
(~23%).

 For more information please refer to Berkeley Lab’s Solar-to-Grid Publication: Utility-Scale Solar, 2021 Edition
 38
 https://emp.lbl.gov/renewable-grid-insights http://utilityscalesolar.lbl.gov
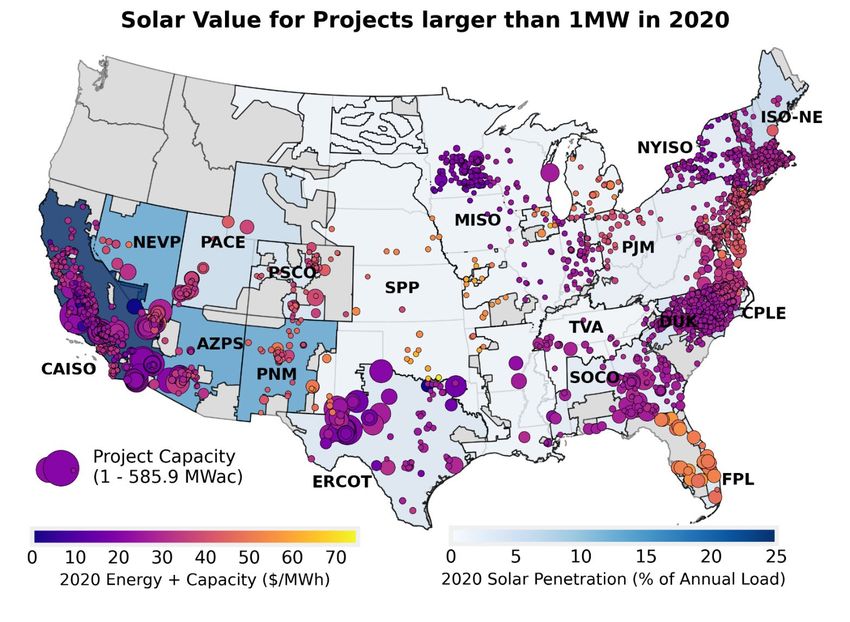
Solar's energy and capacity value varied by location

Solar’s value varies between regions (low in CAISO and MISO and high in SPP and FPL) and within regions (for example, western
ERCOT has lower solar values than eastern ERCOT). Some markets showed very little variation in solar value in 2020 (value
across ISO-NE differed by only 7%) while others had large discrepancies (values varied by up to 50% in ERCOT and NYISO).

 For more information please refer to Berkeley Lab’s Solar-to-Grid Publication: Utility-Scale Solar, 2021 Edition
 39
 https://emp.lbl.gov/renewable-grid-insights http://utilityscalesolar.lbl.gov
Here we roll up the plant- and county-level estimates from the previous
slide to regional averages (and also separate energy and capacity value)
 The regional solar value is the
 generation-weighted average
 value of all distributed and
 utility-scale solar generation in
 a given balancing authority.

 The energy value makes up
 the bulk of total market value,
 but capacity value is
 significant in eastern markets
 in particular.

 Fluctuations across years
 mostly reflect fluctuations in
 wholesale power prices, but in
 CAISO, the visible decline in
 value over time also reflects
 increasing solar penetration.
In 2020, market value was lowest in ERCOT ($23.7/MWh) and highest in SPP ($50.8/MWh).

 For more information please refer to Berkeley Lab’s Solar-to-Grid Publication: Utility-Scale Solar, 2021 Edition
 40
 https://emp.lbl.gov/renewable-grid-insights http://utilityscalesolar.lbl.gov
In a subset of regions for which we have sufficient PPA sample,
falling PPA prices have largely kept pace with declining solar value
Solar Value and PPA Price (2020 $/MWh) The green dots show the
100 average levelized solar PPA
 Average Levelized PPA Price Capacity Value price within each region
 90
 (by execution year) among new contracts signed
 80 in each year as reported by
 Energy Value
 70 Berkeley Lab, the yellow
 squares represent PPA price
 60
 Level10 PPA estimates by LevelTen. We
 50 do not have sufficient PPA
 40 data to present robust trends
 for each balancing authority.
 30
 20
 10
 While solar’s market value
 within several of these
 0 regions has declined over
 2012-20 2012-20 2012-20 2012-20 2012-20 2012-20 2012-20 2012-20 time, falling PPA prices have
 CAISO ERCOT SPP MISO PJM ISO-NE West Southeast largely kept pace, more or
 (non-ISO) (non-ISO) less maintaining solar’s
 competitiveness.
 For more information please refer to Berkeley Lab’s Solar-to-Grid Publication: Utility-Scale Solar, 2021 Edition
 41
 https://emp.lbl.gov/renewable-grid-insights http://utilityscalesolar.lbl.gov
Solar provides below-average value in regions with high solar
 penetration rates
 The “Value Factor” is defined as the
Solar Value Factor Solar Market Penetration ratio of solar’s total market value
 (both energy and capacity) to the
200% 20% market value of a “flat block” (i.e., a
 Solar Market Solar Value 2012-2020
 Factor
 24x7 block) of power.
 Penetration
150% 15% It indicates whether the total revenue
 captured by solar is higher (>100%)
 or lower (
Solar’s generation profile is the largest source of value differences
between solar and flat block in 2020
Wholesale Market Value in 2020 (2020 $/MWh) Solar Value Relative to Flat Block Value (% difference)
 Solar 100%
30 curtailment market $51
 location profile value
 75%
 Capacity
 Value 50%
20 $36

 $32
 25%
 Energy $24
 Value
10 0%
 $29 $24
 -25% Location
 $25 Curtailment
 0 Profile
 -50%
 Flat block Flat block Flat block Solar profile Value of $35 $31 $25 $21 $27 $25 $27
 at all nodes at solar nodes at solar nodes at solar nodes flat block
 (with curtailment) ($/MWh) CAISO ISO-NE ERCOT MISO NYISO PJM SPP

 On a national average basis, solar’s relative value is With the exception of ERCOT (where the location of
 enhanced by project location but hurt by solar’s solar plants is the largest driver of relative value),
 generation profile (and, to a lesser extent, by solar’s generation profile either hurts (in CAISO and
 curtailment). ISO-NE) or helps (in MISO, NYISO, PJM, and SPP)
 solar’s value the most (relative to a flat block).

 For more information please refer to Berkeley Lab’s Solar-to-Grid Publication: Utility-Scale Solar, 2021 Edition
 43
 https://emp.lbl.gov/renewable-grid-insights http://utilityscalesolar.lbl.gov
PV+Battery Hybrid Plants

 Utility-Scale Solar 2021 Edition
 http://utilityscalesolar.lbl.gov 44
For PV+battery hybrid plants, the battery cost adder scales with
increased storage capacity and duration
Sample: 18 projects totaling 180 MWAC of PV, 116 MWAC of battery Empirical cost sample for utility-scale
capacity, and 392 MWh of battery energy, with CODs from 2017-2019 PV+battery hybrid projects is still very
 thin, and does not include 2020.
 Bubble area = storage duration

 The median reported battery costs among
 11 projects with a 2019 COD was
 $1,100/kWh, representing a median cost
 adder of $1.54/WAC-PV, or 48% of overall
 hybrid project installed costs.

 Within this 2019 COD sample, the median
 battery capacity is 60% of the PV capacity
 and can release energy at rated power for
 a little more than 2 hours.

 Utility-Scale Solar, 2021 Edition
 45
 http://utilityscalesolar.lbl.gov
PPA prices for PV+battery hybrids have declined over time; Hawaii priced at a premium Levelized PPA Price (2020 $/MWh-PV) Levelized PPA Price (2020 $/MWh-PV) $140 Bubble area = battery capacity $140 Bubble area = PV capacity 13 MW battery 13 MW PV $120 $120 $100 Hawaii $100 Hawaii $80 $80 $60 $60 Other States Other States $40 $40 $20 30 MW battery $20 100 MW PV 380 MW battery 690 MW PV $0 $0 2015 2016 2017 2018 2019 2020 2021 2015 2016 2017 2018 2019 2020 2021 PPA Execution Date PPA Execution Date Levelized PPA Price (2020 $/MWh-PV) All three graphs show the same data from a sample of 47 PPAs (totaling 5.4 $140 100% battery:PV capacity Bubble area = battery:PV capacity GWAC of PV and 3.1 GWAC of battery); the only difference is what the bubble size represents $120 Hawaii Downward trend over time, particularly in HI, but refinement is complicated by $100 multi-dimensionality of these plants; “Other States” (in blue) are more $80 heterogeneous than HI in terms of solar resource $60 Battery:PV capacity ratio always at 100% in HI; lower on the mainland $40 Other States Battery duration ranges from 2-8 hours; 44 of the 47 plants shown have $20 durations ≥4 hours (other three are 3.8, 2, and 2 hours) 19% battery:PV capacity $0 2015 2016 2017 Utility-Scale 2018 Solar, 2021 2019 2020 Edition 2021 46 http://utilityscalesolar.lbl.gov PPA Execution Date
PPAs that price the PV and storage separately enable us to calculate a “levelized storage adder”—which depends on the battery:PV capacity ratio Levelized Storage Adder (2020 $/MWh-PV) Storage Contribution (Adder / Full PPA Price) 75-100% 60% $20 30 MW 50% (battery $15 capacity) 40% $10 300 MW 30% 40-50% 25-30% battery:PV capacity (battery capacity) 20% $5 10% $0 0% 0% 10% 20% 30% 40% 50% 60% 70% 80% 90% 100% Mar-17 Sep-17 Mar-18 Sep-18 Mar-19 Sep-19 Mar-20 Sep-20 Mar-21 Sep-21 Battery:PV Capacity PPA Execution Date Storage Contribution (Adder / Full PPA Price) 300 MW The “levelized storage adder”—expressed in the top-left graph in (battery 60% 20 MW capacity) $/MWh-PV, not $/MWh-stored—increases linearly with the (battery 50% capacity) battery:PV capacity ratio: ~$5/MWh-PV at 25% battery:PV 40% capacity, ~$10/MWh at 50%, ~$20/MWh at 100% Bottom-left graph presents the storage adder as a percentage of 30% the full PPA price (i.e., storage’s contribution to the overall price) 20% Top-right graph shows storage’s contribution holding fairly 10% steady, and a trend toward larger battery:PV capacity, over time 0% All batteries depicted on this slide have a Solar, Utility-Scale 4-hour 2021storage Edition 0% 10% 20% 30% 40% 50% 60% 70% 80% 90% 100% 47 Battery:PV Capacity duration http://utilityscalesolar.lbl.gov
Concentrating Solar Thermal Power (CSP)
 Plants

 Utility-Scale Solar 2021 Edition
 http://utilityscalesolar.lbl.gov 48
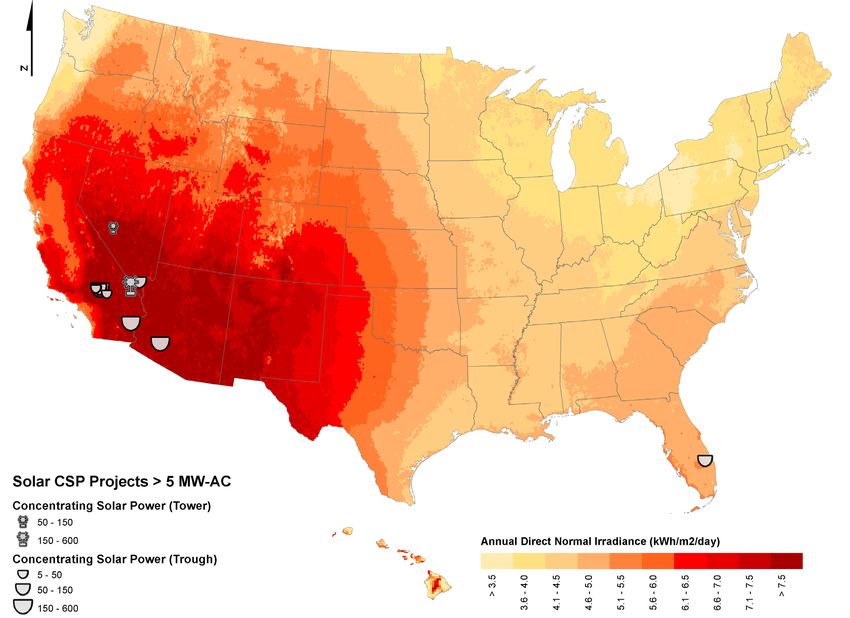
Sample description of CSP projects
 CSP project population: 16 projects totaling 1,781 MWAC After nearly 400 MWAC built in the late-
 1980s (and early-1990s), no new CSP was
 built in the U.S. until 2007 (68 MWAC), 2010
 (75 MWAC), and 2013-2015 (1,237 MWAC).

 Prior to the large 2013-15 build-out, all
 utility-scale CSP projects in the U.S. used
 parabolic trough collectors.

 The five 2013-2015 projects include:
 – 3 parabolic troughs (one with 6 hours of
 storage) totaling 750 MWAC (net) and
 – 2 “power tower” projects (one with 10
 hours of storage) totaling 487 MWAC (net).

 Utility-Scale Solar, 2021 Edition
 49
 http://utilityscalesolar.lbl.gov
Not much movement in the installed costs of CSP

CSP cost sample: 7 projects totaling 1,381 MWAC Small sample of 7 projects using
 different technologies makes it
 hard to identify trends. Newer
 projects (5 built in 2013-15) did
 not show cost declines, though
 some included storage or used
 new technology (power tower).

 PV costs have continuously
 declined and are now far below
 the historical CSP costs. While
 international CSP projects seem
 to be more competitive with PV,
 no new CSP projects are currently
 under active development in the
 U.S.

 Utility-Scale Solar, 2021 Edition
 50
 http://utilityscalesolar.lbl.gov
Despite improvements, most newer CSP projects continue to
 underperform relative to long-term expectations
 CSP price sample: 7 projects totaling 1,381 MWAC Power Towers: Ivanpah (377 MW) had its best
 year yet in 2020 (though still below long-term
Capacity Factor (solar portion only) expectations of ~27%), while Crescent Dunes (110
40% MW with 10 hours of storage) ceased to operate
 Average PV in states with CSP (CA, NV, AZ) Solana following a late-2019 PPA cancellation and
35% subsequent bankruptcy.
 Genesis
30% Trough with storage: Solana (250 MW trough
 Mojave
 project with 6 hours of storage) seems to have
25% leveled off around 35%, below long-term
 Nevada Solar One
 Ivanpah expectations of >40%.
20%
 SEGS III-IX Troughs without storage: Genesis continued to
15%
 match expectations in 2020, while Mojave has
10% been more variable. Both have performed better
 than the old SEGS projects (now decommissioned
 5% and being partially repowered with PV), and the
 Crescent
 SEGS I & II Dunes 2007 Nevada Solar One project.
 0%
 2008 2009 2010 2011 2012 2013 2014 2015 2016 2017 2018 2019 2020
 Only Solana and Genesis have matched or
 exceeded the average capacity factor among
 utility-scale PV projects across CA, NV, and AZ.

 Utility-Scale Solar, 2021 Edition
 51
 http://utilityscalesolar.lbl.gov
Though once competitive, CSP PPA prices have failed
to keep pace with PV’s PPA price decline
CSP price sample: 7 projects totaling 1,381 MWAC
 When PPAs for the most
 Levelized PPA Price (2020 $/MWh)
 recent batch of CSP projects
 $250 PV in CA, NV, AZ (for comparison)
 (with CODs of 2013-15) were
 signed back in 2009-2011,
 CSP trough, no storage they were still mostly
 $200 CSP trough, 6 hours storage competitive with PV.
 250 MW
 CSP tower, no storage
 $150 CSP tower, 10 hours storage
 But CSP has not been able to
 $100 keep pace with PV’s price
 decline. Partly as a result, no
 new PPAs for CSP projects
 $50
 The offtaker cancelled this PPA in
 have been signed in the U.S.
 October 2019, following prolonged since 2011 – though the
 $0
 underperformance. technology continues to
 2008 2009 2010 2011 2012 2013 2014 2015 2016 2017 2018 2019 2020 2021 advance overseas.
 PPA Execution Date

 Utility-Scale Solar, 2021 Edition
 52
 http://utilityscalesolar.lbl.gov
Capacity in Interconnection Queues

 Utility-Scale Solar 2021 Edition
 http://utilityscalesolar.lbl.gov 53
Scope of generator interconnection queue data

• Data compiled from interconnection queues for 7 ISOs and 35
 utilities, representing ~85% of all U.S. electricity load
 – Projects that connect to the bulk power system: not behind-the-meter

 – Includes all projects in queues through the end of 2020

 – Filtered to include only “active” projects: removed those listed as “online,”
 “withdrawn,” or “suspended”

• Hybrid / co-located projects were identified and categorized
 – Storage capacity for hybrids (i.e., broken out from generator capacity) was
 not available in all queues

• Note that being in an interconnection queue does not guarantee Coverage area of entities for which data was collected
 Data source: Homeland Infrastructure Foundation-Level Data (HIFLD)
 ultimate construction: majority of plants are not subsequently built

• More queue data and analysis are available at:
 https://emp.lbl.gov/publications/queued-characteristics-power-plants

 Utility-Scale Solar, 2021 Edition
 http://utilityscalesolar.lbl.gov 54
Looking ahead: Strong growth in the utility-scale solar pipeline

 460 GW of solar was in the queues
Capacity in Queues at Year-End (GW)
 at the end of 2020—170 GW of this
500
 Entered queues in the year shown total entered the queues in 2020
 (the remainder entered in earlier
 Entered queues in an earlier year
400 years, and remain active)
 Hatched portion indicates the amount of capacity proposed as part of a hybrid plant
300 Nearly 160 GW of the 460 GW of
 solar in the queues (i.e., 34%)
 includes a battery in a PV hybrid
200 configuration

100 Solar (both standalone and in
 hybrid form) is by far the largest
 resource within these queues,
 0 roughly equal to the amount of
 2014-2020 2014-2020 2014-2020 2014-2020 2014-2020 2014-2020 2014-2020
 Solar Wind Storage Gas Nuclear Coal Other
 wind, storage, and natural gas
 combined

 Graph shows solar and other capacity in 42 interconnection queues across the US: Utility-Scale Solar, 2021 Edition
 55
 Not all of these projects will ultimately be built! http://utilityscalesolar.lbl.gov
Looking ahead: Continued broadening of the market The growth of solar within these Solar Capacity in Queues at Year-End (GW) queues is widely distributed 100 across almost all regions of the Entered queues in the year shown country, with PJM and the non- Entered queues in an earlier year ISO West leading the way with 80 Hatched portion indicates the amount of nearly 90 GWAC each, followed capacity proposed as part of a hybrid plant by ERCOT, MISO, and the non- 60 ISO Southeast, each with ~60 GWAC 40 Nearly 90% of the solar capacity in CAISO’s queue at the end of 20 2020 was paired with a battery; in the non-ISO West, that 0 number is also relatively high, at 2014-20 2014-20 2014-20 2014-20 2014-20 2014-20 2014-20 2014-20 2014-20 67% PJM West ERCOT MISO Southeast CAISO SPP NYISO ISO-NE Both regions are grappling with (non-ISO) (non-ISO) “duck curve” issues due to solar’s relatively high market share Graph shows solar capacity in 42 interconnection queues across the US: Utility-Scale Solar, 2021 Edition 56 Not all of these projects will ultimately be built! http://utilityscalesolar.lbl.gov
Summary

Utility-Scale Solar 2021 Edition
http://utilityscalesolar.lbl.gov 57
Data Summary

 Utility-scale PV continued to lead solar deployment in 2020, with Texas adding the most new capacity. 81% of new projects and 89% of new capacity feature
 single-axis tracking.

 The median installed cost of projects that came online in 2020 fell to $1.4/WAC ($1.1/WDC), down 10% from 2019 and 75% from 2010.

 Average capacity factors range from 19% in the least-sunny regions to 30% where it is sunniest. Single-axis tracking adds roughly five percentage
 points to capacity factor in the regions with the strongest solar resource. Fleet-wide performance has declined at ~1.2%/year.

 Not including the ITC, the median LCOE from utility-scale PV has declined by 85% since 2010, to $34/MWh in 2020. Levelized PPA prices have kept
 pace, and—with the benefit of the ITC—currently range from $20/MWh in CAISO and the non-ISO West to $30-$40/MWh elsewhere.

 In higher-penetration markets like CAISO, the market value of solar has been declining, but falling PPA prices have largely kept pace, preserving
 solar’s net value.

 There has been much interest in hybridization (pairing PV with batteries). Our public data file includes metadata on >150 PV+battery projects that are
 operating or planned in 23 states. Some of these PV+battery hybrid projects have inked PPAs in the mid-$20/MWh range.

 Across all 7 ISOs and 35 additional utilities, there were 460 GW of solar in interconnection queues at the end of 2020. More than a third of this proposed solar
 capacity is paired with battery storage, with the highest concentration of these PV+battery hybrid plants in CAISO and non-ISO West.

 Utility-Scale Solar, 2021 Edition
 58
 http://utilityscalesolar.lbl.gov
Data and Methods

 Utility-Scale Solar 2021 Edition
 http://utilityscalesolar.lbl.gov 59
Summary of Data and Methods (1)
Much of the analysis in this report is based on primary data, the sources of which are listed below (along with some general secondary sources) by data
set. We collect data from a variety of unaffiliated and incongruous sources, often resulting in data of varying quality that must be synthesized and
cleaned in multiple steps before becoming useful for analytic purposes. In some cases, we essentially create new and useful data by piecing together
various snippets of information that are of less consequence on their own.

Technology Trends: Project-level metadata are sourced from a combination of Form EIA-860, FERC Form 556, state regulatory filings, interviews with
project developers and owners, and trade press articles. We independently verify much of the metadata—such as project location, fixed-tilt vs. tracking,
azimuth, module type—via satellite imagery. Other metadata are indirectly confirmed (or flagged, as the case may be) by examining project
performance—e.g., if a project’s capacity factor appears to be an outlier given what we think we know about its characteristics, then we dig deeper to
revisit the veracity of the metadata.

Installed Costs: Project-level CapEx estimates are sourced from a combination of Form EIA-860, Section 1603 grant data from the U.S. Treasury,
FERC Form 1, data from applicable state rebate and incentive programs, state regulatory filings, company financial filings, interviews with developers
and owners, trade press articles, and data previously gathered by NREL. CapEx estimates for projects built from 2013-2019 have been cross-checked
against confidential EIA-860 data obtained under a non-disclosure agreement (and we expect to receive similar data for 2020 projects and successive
years going forward). The close agreement between the confidential EIA data and our other sources in most cases provides comfort that our normal
data collection process (i.e., the process that we go through prior to receiving the confidential EIA data with a one-year lag) does, in fact, yield reputable
CapEx estimates. That said, we do caution readers to focus more on the overall trends rather than on individual project-level data points.

Capacity Factors: We calculate project-level capacity factors using net generation data sourced from a combination of FERC Electric Quarterly
Reports, FERC Form 1, Form EIA-923, and state regulatory filings. Because many projects file data with several of these sources, we are often able to
cross-reference (and correct, if needed) odd-looking data across several sources, thereby providing higher confidence in the veracity of the data.
 Utility-Scale Solar, 2021 Edition
 60
 http://utilityscalesolar.lbl.gov
Summary of Data and Methods (2)
PPA Prices: We gather PPA price data from a combination of FERC Electric Quarterly Reports, FERC Form 1, Form EIA-923, state regulatory filings,
company financial filings, and trade press articles. We only include a PPA within our sample if we have high confidence in all of the key variables such as
execution date, starting date, starting price, escalation rate (if any), time-of-day factor (if any), and term. By this process of exclusion, there is very little
chance for erroneous PPA price data to enter our sample. Instead, this winnowing process results in our PPA price sample being somewhat smaller than it
might otherwise be—though we are typically able to add back in any “incomplete” PPAs in subsequent years, once more data have become available with
the passage of time.

LCOE: Our project-level LCOE calculations draw upon the empirical project-level data presented throughout this report, including CapEx and capacity
factors, and are supplemented with assumptions about financing and other items, as described in more detail in earlier slides.

Market Value: We draw from project-level modeled hourly solar generation (using NREL’s System Advisor Model and site- and year-specific insolation data
from NREL’s National Solar Radiation Database) and de-bias the generation leveraging ISO-reported aggregate solar generation and plant-level reported
generation by EIA 923.

Energy value is the product of hourly solar generation by plant (utility-scale) or county (distributed PV) and the wholesale hourly real-time energy prices of
the nearest node (for ISOs) or the system-wide energy price (other Balancing Authorities).
Capacity value relies on the same reported and constructed generation profiles as does energy value to assess the “capacity credit” of solar according to
each ISO’s rules in place at the time (for Balancing Authorities we examine the historical plant-level performance over the top 100 load hours over the past
3 years). We then multiply the resulting capacity credit by historical zonal capacity prices to arrive at capacity value.

For more information, see Berkeley Lab’s forthcoming publication: “Solar-to-Grid: Trends in System Impacts, Reliability, and Market Value in the United
States with Data Through 2020.” https://emp.lbl.gov/renewable-grid-insights

 Utility-Scale Solar, 2021 Edition
 61
 http://utilityscalesolar.lbl.gov
You can also read