Validity of the Food Insecurity Experience Scale (FIES) for Use in League of Arab States (LAS) and Characteristics of Food Insecure Individuals by ...

Page created by Peggy Brooks
 
CONTINUE READING
Validity of the Food Insecurity Experience Scale (FIES) for Use in League of Arab States (LAS) and Characteristics of Food Insecure Individuals by ...
ORIGINAL RESEARCH                                                                                                                 CURRENT DEVELOPMENTS IN NUTRITION

Food and Nutrition Policy

Validity of the Food Insecurity Experience Scale (FIES) for Use in League
of Arab States (LAS) and Characteristics of Food Insecure Individuals by
the Human Development Index (HDI)
Olfat B Sheikomar,1 Wesley Dean,2 Hala Ghattas,3 and Nadine R Sahyoun1

                                                                                                                                                                                                     Downloaded from https://academic.oup.com/cdn/article/5/4/nzab017/6158388 by guest on 28 April 2021
1
 Department of Nutrition and Food Science, University of Maryland, College Park, MD, USA; 2 Department of Food and Resource Economics, University of
Copenhagen, Copenhagen, Denmark; and 3 Center for Research on Population and Health, American University of Beirut, Beirut, Lebanon

ABSTRACT
Background: The Food Insecurity Experience Scale (FIES) is a UN FAO Voices of the Hungry (FAO-VoH) experiential metric of food insecurity (FI). It
was pilot tested in some countries but not in Arab speaking ones and validated using global data. Yet, its psychometric properties may vary in the
League of Arab States (LAS) due to cultural and linguistic differences.
Objectives: 1) assess the validity of FIES for use in the LAS region, 2) determine the prevalence of FI, by gender, age group, and the human
development index (HDI), and 3) examine sociodemographic characteristics of severe FI individuals.
Methods: To assess the psychometric properties of FIES, Rasch modeling was applied to the 2014–2015 Gallop World Poll (GWP) in the LAS.
Prevalence and characteristics of severely FI individuals were assessed using the 2014–2017 GWP data of 62,261 respondents.
Results: Overall, FIES met the Rasch model assumptions of equal discrimination and conditional independence. Infit statistics for FIES items, in
most LAS countries, were 1.3. Outfit statistics >2.0, indicating erratic responses, were noted in 26% of the LAS countries. Significant correlations were found (≥0.4)
between items in Algeria, Tunisia, and Lebanon. The overall prevalence of severe FI was 15.7%. At highest risk were those aged ≥50 y compared
with younger adults (16.5% versus 15.5%, respectively, P
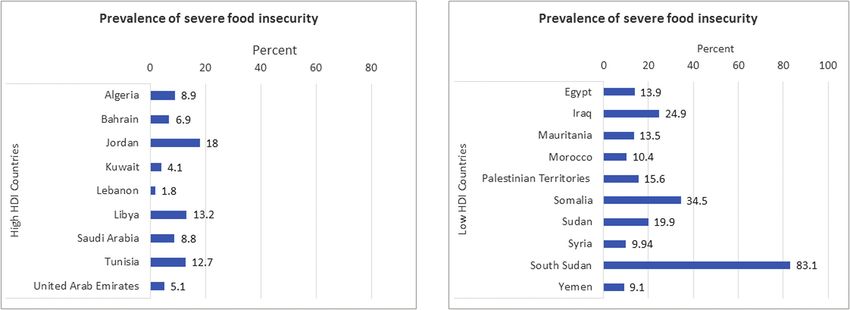
Validity of the Food Insecurity Experience Scale (FIES) for Use in League of Arab States (LAS) and Characteristics of Food Insecure Individuals by ...
2 Sheikomar et al.

study measured income and food consumption (6) to report on food se-          35,064 individuals, after excluding those aged 150 countries (20, 21). However,
since a global standard was used to validate the measure, there is a          Demographic and socioeconomic variables
need for regional psychometric analysis of the tool to determine its          Demographic and socioeconomic variables included in this analysis
applicability. This tool has also been validated for sub-Saharan Africa       were: age, household size, and number of children aged under 15 y
and its applicability to that region of the world was determined but          residing in the household, and these were examined as dichotomous
with several caveats (22). The overall goal of this study was to define       and continuous variables. Whereas the variables: gender, marital status
a standard metric for the LAS that can be used to identify common             (married and domestic partner compared with never married, divorced,
determinants of FI in its countries.                                          separated, or widowed), area of residence (living in a rural area or on a
    We, therefore, focused on Arabic-speaking countries to minimize           farm, a small town or village, compared with a large city, and a suburb
the variation in the language of the translated FIES. In addition, we used    of a large city), and employment status (employed or self-employed full
national indicators of the Human Development Index (HDI) and the              time, employed part-time do not want/want full-time work, compared
Political Stability and the Absence of Violence and Terrorism (PSAVT)         with unemployed, out of workforce) were examined as dichotomous
to control for the variability in the socioeconomic status and political      variables. After accounting for the diverse national classifications of ed-
unrest in the region. The specific objectives of this study were to: 1) as-   ucation across countries and making them comparable, educational at-
sess the internal validity of FIES for use in the LAS region, 2) assess the   tainment was categorized as: 1) 8 y of primary education, 2) secondary
prevalence of FI, by age and gender, stratified by the HDI, and 3) deter-     or high school completion, and 3) 1 or more years of a college education.
mine the sociodemographic and economic characteristics of individuals             To calculate income, the survey inquired about monthly household
with severe FI in that region.                                                income from all sources, including wages and salaries, and remittances
                                                                              in local currency from all family members. If respondents had difficulty
                                                                              answering this question, they were asked to select from an income
Methods                                                                       range, and the midpoint of that range was used for analysis. Household
                                                                              income in local currency was converted to international dollars (ID)
Study design                                                                  using the World Bank’s purchasing power parity conversion factor to
Data for this analysis were obtained from the GWP surveys conducted           make income comparable across countries. The income per capita was
in 19 LAS countries, areas, or territories. GWP is a series of complex        then derived by dividing income in ID by household headcount (23,
cross-sectional surveys conducted annually in >150 countries. The tar-        24). In this analysis, household income per capita was examined as
get population from each country is a nationally representative civil-        income quintiles.
ian, noninstitutionalized population of individuals aged 15 y and older.
Data were collected through 1-h, face-to-face interviews, or 30-min           Country-level variables
telephone calls with typically 1000 respondents from each country per         HDI.
survey year using multistage probability sampling (23). The difference        Economic and human development vary widely between LAS countries.
in time allocated to the interviews is due to the additional questions ad-    These analyses were stratified by HDI, which is a statistic composite of
ministered to individuals during the face-to-face interviews compared         3 dimensions related to human development: 1) a long and healthy life,
with those on the telephone calls. The 2014 and 2015 GWP data of              measured by life expectancy at birth, 2) education, assessed by average

                                                                                                            CURRENT DEVELOPMENTS IN NUTRITION
Validity of the food insecurity experience scale 3

TABLE 1 Questions of the Food Insecurity Experience Scale (FIES)
                                                     During the last 12 mo, was there any time when …:
                                                                                                                                                          Assumed
                                Questions                                                  Label                 Domains of FI construct                severity of FI
Q1                You were worried you would not have enough                            WORRIED                   Uncertainty and worry                      Mild
                    food to eat because of a lack of money or other                                                   about food
                    resources?1
Q2                You were unable to eat healthy and nutritious food                     HEALTHY                 Inadequate food quality                     Mild
                    because of a lack of money or other resources?
Q3                You ate only a few kinds of foods because of a lack                   FEWFOOD                  Inadequate food quality                     Mild
                    of money or other resources?
Q4                You had to skip a meal because there was not                           SKIPPED                 Insufficient food quantity                Moderate
                    enough money or other resources to get food?

                                                                                                                                                                             Downloaded from https://academic.oup.com/cdn/article/5/4/nzab017/6158388 by guest on 28 April 2021
Q5                You ate less than you thought you should because                       ATELESS                 Insufficient food quantity                Moderate
                    of a lack of money or other resources?
Q6                Your household ran out of food because of a lack                       RUNOUT                  Insufficient food quantity                Moderate
                    of money or other resources?
Q7                You were hungry but did not eat because there                          HUNGRY                  Insufficient food quantity                  Severe
                    was not enough money or other resources for
                    food?
Q8                You went without eating for a whole day because                        WHLDAY                  Insufficient food quantity                  Severe
                    of a lack of money or other resources?
1
 “Other resources” is used in all the questions to make it suitable for respondents who usually acquire food in ways other than purchasing it with money. Interviewers are
trained to emphasize the expression “because of a lack of money or other resources” to avoid receiving affirmative responses due to other reasons such as dieting or
fasting (25).

years of schooling for adults aged 25 and over, and expected years of                  items and their functioning (30). Rasch modeling was used to provide
schooling for children, and 3) having a decent standard of living, mea-                a theoretical basis to link the FIES responses to the measure of severity
sured by gross national income per capita (26). In 2017, countries were                of FI and place responses to the items and the level of FI measured by
classified by the United Nations Development Program as: 1) very high                  the items on the same continuum scale (17, 31, 32). The responses to
HDI (Bahrain, Kuwait, Oman, Qatar, Saudi Arabia, United Arab Emi-                      the items are a logistic function of the difference between the severity
rates [UAE]), 2) high HDI (Algeria, Jordan, Lebanon, Libya, Tunisia),                  of a respondent’s FI status and the severity of FI measured by each item
3) medium HDI (Egypt, Iraq, Morocco, Palestinian Territories), and 4)                  (33). For example, if the respondent’s level of severity of FI is lower than
low HDI (Comoros, Djibouti, Mauritania, Somalia, Sudan, South Su-                      the severity of FI measured by the item, the probability of affirming
dan, Syria, Yemen) (26, 27). Data from very high and high HDI coun-                    that item is low. Individuals with missing responses to any of the 8 FIES
tries and those from low and very low were combined.                                   items were excluded from the Rasch analysis and in the computation
                                                                                       of the prevalence rates. A high proportion of missing responses can
PSAVT.                                                                                 indicate questions that are not easy to understand. The total score of
Considering the political unrest in some countries of the LAS, it was                  the FIES ranges from 0 to 8. For these analyses, extreme scores of 0 and
controlled for in these analyses using 1 of the World Bank’s country-                  8 were excluded to avoid potential bias due to the large proportion of
level indicators, PSAVT (28). This measure captures the likelihood that                these extreme values (17, 34).
the government will be destabilized under violence and the frequency                       We assessed adherence of the data from each country to the assump-
of politically motivated violence and terrorism. Generally, the perfor-                tions of the Rasch model of: 1) equal discrimination, meaning that the
mance score ranges from −2.5 to 2.5 and the highest score reflects the                 performance of all items included in the scale is consistently and equally
best situation (29). In these analyses, the LAS countries were strati-                 related to food security, and 2) conditional independence and unidi-
fied into 3 categories based on tertiles of the PSAVT 2017 score: 1)                   mensionality, which means that responses to the items are independent
high politically stable countries (Jordan, Kuwait, Mauritania, Morocco,                and only measure 1 latent trait, that is, FI. Also, the correlations between
UAE, 2) medium politically stable countries (Algeria, Bahrain, Egypt,                  items are entirely due to their common association with this latent trait;
Saudi Arabia, Tunisia), and 3) low politically stable countries (Iraq,                 thus, they should be uncorrelated after controlling for the latent trait
Lebanon, Libya, Palestinian Territories, Somalia, South Sudan, Sudan,                  (17). Meeting the assumptions is a precondition to the FIES’s validity
Syria, Yemen) (29).                                                                    and reliability to measure the severity of FI and make the raw scores a
                                                                                       meaningful indicator of the severity level of FI (17, 34).
Statistical analysis                                                                       We assessed the assumption of equal discrimination using fit statis-
Rasch modeling.                                                                        tics (infit and outfit statistics) and overall model fit (reliability). Fit
Rasch modeling, which is a single-parameter logistic measurement                       statistics are chi-square-type statistics that compare observed and ex-
model based on the Item Response Theory, was used to assess the psy-                   pected responses of each item (35). Infit is mainly used to assess the
chometric properties of the FIES. Rasch is a statistical technique used                assumption by checking the performance of the items in the scale, and
to develop and validate survey instruments by evaluating individual                    outfits identify items that need improvement and those with erratic re-

CURRENT DEVELOPMENTS IN NUTRITION
4 Sheikomar et al.

sponses (25). The ideal value of all item-infit is 1.0, but values in the     However, we computed the prevalence rates of FI in Syria using the over-
range of 0.7 to 1.3 are considered acceptable. An Item-infit value higher     all FI thresholds estimated for the LAS. Raw score parameters for each
than 1.3 indicates higher proportions of unexpected responses (misfit),       country were then adjusted using the means and SDs of the adjusted
implying weaker discrimination, which should be identified for further        item severity parameters after excluding unique items (37). Finally, we
investigation (35, 25). An elevated outfit value can occur if there are a     specified the regional thresholds for moderate and severe FI following
few highly unexpected observations (denials of the least severe items but     the FAO-VoH thresholds as food secure (raw score = 0–3), moderate
affirm the most severe ones), or if an item is highly discriminative, mis-    FI (raw score = 4–6), and severe FI (raw score = 7–8). We then plotted
understood, or miscoded. However, outfits are profoundly affected by a        raw score parameter estimates of each country against the regional one
few random or erratic responses (outliers). Therefore, if the infit statis-   to determine moderate FI and severe FI thresholds for each country.
tics are within the acceptable range, high outfits (≥2), are not usually          Data were analyzed using the statistical software package R (version
criteria for eliminating items. These items need reasonable clarification     3.2.3; R Foundation), Excel 2010, and SAS (version 9.4; SAS Institute
to determine if there is an issue with the items (35). In contrast, lower     Inc.). Descriptive characteristics were weighted to adjust for complex

                                                                                                                                                             Downloaded from https://academic.oup.com/cdn/article/5/4/nzab017/6158388 by guest on 28 April 2021
infits may indicate the presence of redundant items that measure the          survey design. To assess for differences in characteristics between the
same level of FI (34, 25), which may undervalue the item in its contri-       food secure and FI individuals by the country’s HDI levels , the t-test for
bution to the overall measure. To provide a more comparable measure           continuous variables and chi-square for categorical variables were used
of model fit across countries, the overall model fit of the FIES items was    and considered statistically significant at P
Validity of the food insecurity experience scale 5

                                                                                                                                                                                                                                                                                         “runout” in Algeria, the item “hungry” in Bahrain, and for the item
                                                                                                                                       Outfit

                                                                                                                                                 2.51∗∗
                                                                                                                                                 2.53∗∗

                                                                                                                                                 4.34∗∗

                                                                                                                                                 2.23∗∗

                                                                                                                                                 3.19∗∗
                                                                                                                                                 1.68

                                                                                                                                                 1.01

                                                                                                                                                 0.90

                                                                                                                                                 1.05
                                                                                                                                                 1.01
                                                                                                                                                 0.77

                                                                                                                                                 1.61

                                                                                                                                                 1.05

                                                                                                                                                 1.86
                                                                                                                                                 1.65
                                                                                                                                                 1.68

                                                                                                                                                 0.79
                                                                                                                                                 0.57

                                                                                                                                                 1.82

                                                                                                                                                 1.16
                                                                                                                                                                                                                                                                                         “whlday” in Lebanon (Table 2).
                                                                                                                                   WHLDAY

                                                                                                                                                                                                                                                                                             Finally, the overall model fit using the Rasch reliability assessment
                                                                                                                                                                                                                                                                                         was 0.71 for the LAS region (Supplemental Table 2). Countries had re-

                                                                                                                                                 1.44∗
                                                                                                                                Infit
                                                                                                                                                 1.15

                                                                                                                                                 0.99

                                                                                                                                                 1.23
                                                                                                                                                 1.25

                                                                                                                                                 1.20

                                                                                                                                                 1.10
                                                                                                                                                 1.13
                                                                                                                                                 1.09
                                                                                                                                                 1.12

                                                                                                                                                 1.05

                                                                                                                                                 1.33
                                                                                                                                                 1.29
                                                                                                                                                 1.09
                                                                                                                                                 1.30

                                                                                                                                                 1.20

                                                                                                                                                 0.93
                                                                                                                                                 0.84

                                                                                                                                                 1.26

                                                                                                                                                 1.07
                                                                                                                                                                                                                                                                                         liability values within an acceptable range of 0.70 to 0.80. The lowest
                                                                                                                                                                                                                                                                                         Rasch reliability was 0.69 in Saudi Arabia, Somalia, South Sudan, and
                                                                                                                                                                                                                                                                                         Syria, and the highest was 0.77 in Palestinian Territories and Yemen.
                                                                                                                                       Outfit
                                                                                                                                                 0.77

                                                                                                                                                 0.90

                                                                                                                                                 0.79
                                                                                                                                                 0.74

                                                                                                                                                 0.75

                                                                                                                                                 0.78
                                                                                                                                                 0.79
                                                                                                                                                 0.70
                                                                                                                                                 1.21

                                                                                                                                                 0.63
                                                                                                                                                 0.56
                                                                                                                                                 0.67
                                                                                                                                                 0.76
                                                                                                                                                 0.61
                                                                                                                                                 0.53

                                                                                                                                                 0.78

                                                                                                                                                 0.85
                                                                                                                                                 0.82

                                                                                                                                                 0.95

                                                                                                                                                 0.88
                                                                                                                                                                                                                                                                                         These levels of reliability for a scale comprised of 8 items reflect a rea-
                                                                                                                                   HUNGRY

                                                                                                                                                                                                                                                                                         sonably good model fit (25).
                                                                                                                                                 0.82

                                                                                                                                                 0.90
                                                                                                                                                 0.88

                                                                                                                                                 0.83

                                                                                                                                                 0.87
                                                                                                                                                 0.91
                                                                                                                                                 0.83

                                                                                                                                                 0.88
                                                                                                                                                 0.80

                                                                                                                                                 0.79
                                                                                                                                                 0.71
                                                                                                                                                 0.88
                                                                                                                                                 0.92
                                                                                                                                                 0.79
                                                                                                                                                 0.78

                                                                                                                                                 0.86

                                                                                                                                                 0.88
                                                                                                                                                 0.80

                                                                                                                                                 0.89

                                                                                                                                                 0.92
                                                                                                                                Infit

                                                                                                                                                                                                                                                                                         Conditional independence of the items
                                                                                                                                                                                                                                                                                         Overall, there were no significant correlations between the items in the

                                                                                                                                                                                                                                                                                                                                                                       Downloaded from https://academic.oup.com/cdn/article/5/4/nzab017/6158388 by guest on 28 April 2021
                                                                                                                                                                                                                                                                                         combined LAS data. However, at the country level, high correlations
                                                                                                                                       Outfit
                                                                                                                                                 0.95

                                                                                                                                                 1.22

                                                                                                                                                 0.95
                                                                                                                                                 0.66

                                                                                                                                                 1.23

                                                                                                                                                 1.02
                                                                                                                                                 0.75
                                                                                                                                                 0.87
                                                                                                                                                 0.93

                                                                                                                                                 0.89
                                                                                                                                                 0.53
                                                                                                                                                 1.10
                                                                                                                                                 1.15
                                                                                                                                                 0.79
                                                                                                                                                 0.84

                                                                                                                                                 0.77

                                                                                                                                                 1.15
                                                                                                                                                 0.91

                                                                                                                                                 0.79

                                                                                                                                                 1.01
TABLE 2 Item fit statistics1,2 by countries of the League of Arab States (LAS), Gallop World Poll (GWP) surveys 2014 and 2015

                                                                                                                                                                                                                                                                                         (≥0.4) were found for the items “runout” and “hungry” in Algeria and
                                                                                                                                   RUNOUT

                                                                                                                                                                                                                                                                                         Tunisia, and for the items “hungry” and “whlday” in Lebanon. There
                                                                                                                                                                                                                                                                                         was, however, no indication of multidimensionality of the FIES, since
                                                                                                                                                 0.95

                                                                                                                                                 0.99
                                                                                                                                                 0.81

                                                                                                                                                 0.93

                                                                                                                                                 1.00
                                                                                                                                                 0.77
                                                                                                                                                 0.95

                                                                                                                                                 0.97
                                                                                                                                                 1.07

                                                                                                                                                 0.92
                                                                                                                                                 0.63
                                                                                                                                                 0.97
                                                                                                                                                 1.07
                                                                                                                                                 0.98
                                                                                                                                                 0.90

                                                                                                                                                 0.87

                                                                                                                                                 1.06
                                                                                                                                                 0.99

                                                                                                                                                 0.88

                                                                                                                                                 1.00
                                                                                                                                Infit

                                                                                                                                                                                                                                                                                         there were no significant correlations between any 3 adjacent items of
                                                                                                                                                                                                                                                                                         between 0.25 and 0.40.
                                                                                                                                        Outfit
                                                                                                                                                 0.78

                                                                                                                                                 0.89

                                                                                                                                                 0.68
                                                                                                                                                 0.97

                                                                                                                                                 0.83

                                                                                                                                                 0.96
                                                                                                                                                 0.83
                                                                                                                                                 0.79
                                                                                                                                                 0.66

                                                                                                                                                 0.51
                                                                                                                                                 1.21
                                                                                                                                                 0.64
                                                                                                                                                 0.71
                                                                                                                                                 0.80
                                                                                                                                                 0.84

                                                                                                                                                 0.72

                                                                                                                                                 0.78
                                                                                                                                                 1.01

                                                                                                                                                 0.95

                                                                                                                                                 0.69

                                                                                                                                                                                                                                                                                         Severity order of FIES items
                                                                                                                                   ATELESS

                                                                                                                                                                                                                                                                                         The severity level of FI measured by the items was assessed through
                                                                                                                                                                                                                                                                                         the proportions of respondents affirming each item, and by examining
                                                                                                                                                 0.85

                                                                                                                                                 0.93
                                                                                                                                                 1.03

                                                                                                                                                 0.87

                                                                                                                                                 0.98
                                                                                                                                                 0.91
                                                                                                                                                 0.91

                                                                                                                                                 0.79

                                                                                                                                                 0.70
                                                                                                                                                 0.84

                                                                                                                                                 0.80

                                                                                                                                                 0.83
                                                                                                                                                 1.03

                                                                                                                                                 0.87
                                                                                                                                                 0.92

                                                                                                                                                 0.78

                                                                                                                                                 1.08
                                                                                                                                                 0.73
                                                                                                                                                 0.80
                                                                                                                                                 0.92
                                                                                                                                Infit

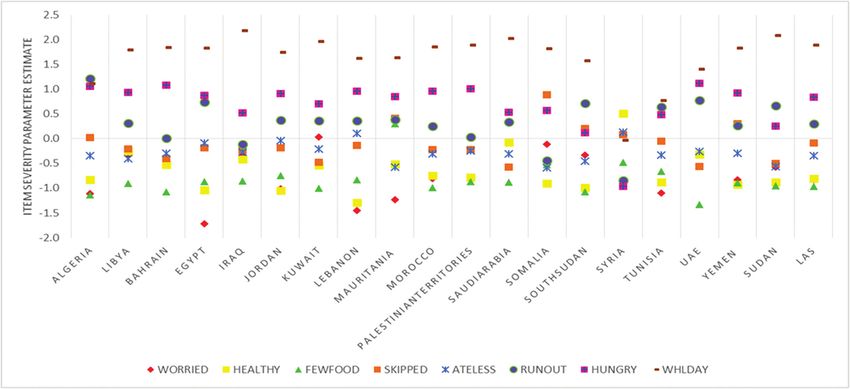
                                                                                                                                                                                                                                                                                         the relative order of the severity parameters of the items in logit scale.
                                                                                                                                                                                                                                                                                         The overall LAS item severity parameters ranged from –0.83 to 1.90
                                                                                                                                                                                                                                                                                         (2.73 logits), and a similar range was found in most countries with
                                                                                                                                        Outfit
                                                                                                                                                 1.03

                                                                                                                                                 0.98
                                                                                                                                                 0.82

                                                                                                                                                 1.04

                                                                                                                                                 1.01
                                                                                                                                                 1.00

                                                                                                                                                 0.90

                                                                                                                                                 0.70
                                                                                                                                                 0.92

                                                                                                                                                 0.92

                                                                                                                                                 0.96
                                                                                                                                                 1.02
                                                                                                                                                 0.91

                                                                                                                                                 0.86

                                                                                                                                                 1.12
                                                                                                                                                 0.92
                                                                                                                                                 0.96
                                                                                                                                                 1.21
                                                                                                                                                 0.89

                                                                                                                                                 1.34

                                                                                                                                                                                                                                                                                         few exceptions (Table 3 and Figure 1). The observed severity level
                                                                                                                                   SKIPPED

                                                                                                                                                                                                                                                                                         of FI measured by items 1–5 was different from the level of FI they
                                                                                                                                                                           Infit item-infit mean square statistic, ∗ infit >1.4; 2 Outfit item-outfit mean square statistic, ∗∗ outfit >2.0.

                                                                                                                                                                                                                                                                                         were designed to measure, which indicates disordering of the items in
                                                                                                                                                 1.00

                                                                                                                                                 0.97

                                                                                                                                                 0.95
                                                                                                                                                 0.87

                                                                                                                                                 1.01

                                                                                                                                                 1.06
                                                                                                                                                 1.01

                                                                                                                                                 0.89
                                                                                                                                                 0.95

                                                                                                                                                 0.99

                                                                                                                                                 0.95
                                                                                                                                                 1.02
                                                                                                                                                 0.93

                                                                                                                                                 0.96
                                                                                                                                                 0.92

                                                                                                                                                 1.17

                                                                                                                                                 1.03
                                                                                                                                                 0.90
                                                                                                                                                 1.01
                                                                                                                                                 1.09
                                                                                                                                Infit

                                                                                                                                                                                                                                                                                         most of the countries and in the aggregated LAS data. Items measuring
                                                                                                                                                                                                                                                                                         more severe FI; “hungry” and “whlday,” performed as expected in most
                                                                                                                                                                                                                                                                                         cases. Since the relative disordering of the item severity was reasonably
                                                                                                                                       Outfit
                                                                                                                                                 1.01

                                                                                                                                                 1.21
                                                                                                                                                 0.95

                                                                                                                                                 1.44
                                                                                                                                                 1.97

                                                                                                                                                 0.95

                                                                                                                                                 0.98
                                                                                                                                                 0.78

                                                                                                                                                 1.13
                                                                                                                                                 0.93
                                                                                                                                                 1.02
                                                                                                                                                 1.01
                                                                                                                                                 1.01

                                                                                                                                                 0.71
                                                                                                                                                 0.88

                                                                                                                                                 0.52

                                                                                                                                                 0.87
                                                                                                                                                 0.75
                                                                                                                                                 0.91
                                                                                                                                                 0.72

                                                                                                                                                                                                                                                                                         similar across the LAS countries, this indicates that severe FI was
                                                                                                                                  FEWFOOD

                                                                                                                                                                                                                                                                                         experienced similarly in the LAS.
                                                                                                                                                                                                                                                                                             Nevertheless, the proportion of respondents affirming items mea-
                                                                                                                                                 0.95

                                                                                                                                                 0.97

                                                                                                                                                 1.01
                                                                                                                                                 0.95
                                                                                                                                                 0.87

                                                                                                                                                 1.01
                                                                                                                                                 0.92
                                                                                                                                                 0.96
                                                                                                                                                 1.06
                                                                                                                                                 0.97
                                                                                                                                                 1.21
                                                                                                                                                 0.92
                                                                                                                                                 0.94

                                                                                                                                                 0.90
                                                                                                                                                 0.89

                                                                                                                                                 0.77

                                                                                                                                                 0.96
                                                                                                                                                 0.84
                                                                                                                                                 0.88
                                                                                                                                                 0.96
                                                                                                                                Infit

                                                                                                                                                                                                                                                                                         suring more severe FI, items 6–8, were lower than the proportion of
                                                                                                                                                                                                                                                                                         affirmative responses to items measuring less severe FI, except for
                                                                                                                                                                                                                                                                                         Syria and Somalia (Supplemental Figure 1). As the severity of the
                                                                                                                                        Outfit

                                                                                                                                                 2.85∗∗

                                                                                                                                                 2.22∗∗

                                                                                                                                                 2.01∗∗

                                                                                                                                                                                                                                                                                         item increased, the proportion of affirmative responses decreased. For
                                                                                                                                                 1.10

                                                                                                                                                 1.23
                                                                                                                                                 1.33
                                                                                                                                                 1.25
                                                                                                                                                 1.42
                                                                                                                                                 1.02
                                                                                                                                                 0.80
                                                                                                                                                 1.23
                                                                                                                                                 1.11
                                                                                                                                                 1.11
                                                                                                                                                 1.18
                                                                                                                                                 0.95

                                                                                                                                                 1.72
                                                                                                                                                 0.98

                                                                                                                                                 0.81

                                                                                                                                                 1.20
                                                                                                                                                 0.94
                                                                                                                                   HEALTHY

                                                                                                                                                                                                                                                                                         instance, ∼63% of the population reported being worried about having
                                                                                                                                                                                                                                                                                         enough food, with 16% of the population reporting going hungry for
                                                                                                                                                 1.51∗

                                                                                                                                                                                                                                                                                         the whole day (Supplemental Figure 2). However, among the items
                                                                                                                                Infit
                                                                                                                                                 1.06

                                                                                                                                                 1.14
                                                                                                                                                 1.26
                                                                                                                                                 1.21
                                                                                                                                                 1.09
                                                                                                                                                 1.07
                                                                                                                                                 1.01
                                                                                                                                                 1.15
                                                                                                                                                 1.00
                                                                                                                                                 1.04
                                                                                                                                                 1.08
                                                                                                                                                 0.96
                                                                                                                                                 1.03
                                                                                                                                                 1.06

                                                                                                                                                 0.97
                                                                                                                                                 1.15

                                                                                                                                                 1.04
                                                                                                                                                 1.02
                                                                                                                                                 1.03

                                                                                                                                                                                                                                                                                         measuring less severe FI, the item “fewfood” had the highest affirmative
                                                                                                                                                                                                                                                                                         responses in most of the countries. Also, the order of severity of FI
                                                                                                                                       Outfit

                                                                                                                                                 2.79∗∗

                                                                                                                                                 2.08∗∗

                                                                                                                                                                                                                                                                                         measured by the items “skipped” and “ateless” were reversed in some
                                                                                                                                                 1.37

                                                                                                                                                 1.02
                                                                                                                                                 0.78
                                                                                                                                                 1.11

                                                                                                                                                 1.37

                                                                                                                                                 1.28
                                                                                                                                                 1.35
                                                                                                                                                 1.17
                                                                                                                                                 0.85
                                                                                                                                                 1.29

                                                                                                                                                 1.03

                                                                                                                                                 1.72
                                                                                                                                                 0.84
                                                                                                                                                 1.18

                                                                                                                                                 1.33

                                                                                                                                                 0.48
                                                                                                                                                 1.61
                                                                                                                                                 1.14
                                                                                                                                  WORRIED

                                                                                                                                                                                                                                                                                         countries (Supplemental Figure 2).
                                                                                                                                                                                                                                                                                             It is worth mentioning that the proportions of missing responses to
                                                                                                                                                                                                                                                                                         any of the 8 FIES questions were
6 Sheikomar et al.

                  TABLE 3 The overall proportion of affirmative responses to Food Insecurity Experimental Scale
                  (FIES) items, item severity parameters, and item fit statistics of the League of Arab States (LAS),
                  Gallop World Poll (GWP) surveys 2014 to 2017
                                                Affirmative responses
                  Item                               (weighted%)                     Severity ± SE1                Infit2             Outfit3
                  WORRIED                                  63.0                       − 0.83   ±   0.08             1.13               1.37
                  HEALTHY                                  62.1                       − 0.82   ±   0.08             1.06               1.10
                  FEWFOOD                                  65.7                       − 0.97   ±   0.08             0.95               1.01
                  SKIPPED                                  48.7                       − 0.09   ±   0.08             1.00               1.03
                  ATELESS                                  53.5                       − 0.34   ±   0.08             0.85               0.78
                  RANOUT                                   42.0                         0.30   ±   0.08             0.95               0.95
                  HUNGRY                                   32.4                         0.83   ±   0.10             0.82               0.77
                  WHLDAY                                   15.9                         1.90   ±   0.14             1.15               1.68

                                                                                                                                                               Downloaded from https://academic.oup.com/cdn/article/5/4/nzab017/6158388 by guest on 28 April 2021
                  1
                    Severity parameter of the FIES items. The calibrations were estimated on a logit scale (with equal discrimination = 1), mean
                  set to 0, and SD of 1.
                  2
                    Infit, item-infit mean square statistic.
                  3
                    Outfit, item-outfit mean square statistic.

(Supplemental Figure 3). Subsequently, the raw scores were stratified              cal unrest had the highest prevalence of severe FI; including South Su-
into 3 categories: food secure (0–3), moderately FI (4–6), and severely            dan, Somalia, Iraq, Sudan, and Palestinian Territories (Figure 2). Adults
FI (7, 8). The thresholds of moderate and severe FI for each country are           aged 50 y and older were at significantly higher risk of severe FI com-
shown in Supplemental Figure 4 where each country’s adjusted raw                   pared with younger adults (16.5% and 15.5% respectively, P
Validity of the food insecurity experience scale 7

                                                                                                                                                               Downloaded from https://academic.oup.com/cdn/article/5/4/nzab017/6158388 by guest on 28 April 2021
FIGURE 2 Country-based prevalence of severe food insecurity (FI) by the Human Development Index (HDI), Gallop World Poll (GWP)
surveys 2014 to 2017.

in low HDI countries. Also, there were no significant differences in the        cognitive testing to ensure that respondents understand the questions as
prevalence of FI, by employment status, for individuals in countries with       intended.
low HDI or marital status in countries with high HDI. The results of the            High outfit values were observed for the item “whlday” in several
logistic regression analysis showed that lower educational attainment,          countries. Similar results of high outfits for the item “whlday” were re-
lower income, lower PSAVT score, large household size, and greater              ported in the validation study for the FIES in Sub-Saharan Africa (22)
numbers of children were most significantly associated with severe FI           and by FAO-VoH in the global 2014 GWP data (17). This high outfit for
in countries in both HDI levels. However, living in rural areas (com-           the item “whlday” in these countries may have resulted from the high
pared with urban ones) was associated with severe FI in countries with          proportion of affirmed responses to going without food for the whole
high HDI only, whereas employment was associated with severe FI in              day, resulting in subsequent exclusion of these responses from the Rasch
low HDI countries (results not shown).                                          analysis, leading to less precise estimates (22). These results suggest that
                                                                                some respondents gave unlikely responses for this item based on their
                                                                                answers to other items, meaning that they may not have been their real
                                                                                experiences. The item “whlday” may require cognitive testing in LAS.
Discussion                                                                      This is also true for the items “worried” and “healthy” in some coun-
                                                                                tries, to ensure that the questions are understood as intended, and to
This study used Rasch modeling to assess the internal validity of FIES          improve the wording of the questions, if necessary. Nevertheless, since
in measuring FI in the LAS. Overall, based on the reliability scores, the       high item outfits may be due to a small proportion of erratic responses,
fit statistics, and the correlations of item residuals, the FIES met the as-    and given the observed good infit statistics for these items, these high
sumption of equal discrimination and conditional independence; hence            outfits may not be indicative of any violation of the Rasch assumptions
has satisfactory psychometric properties and is thus valid for use in the       or cause a threat to the validity of the FIES.
LAS region but with some caveats.                                                   Our results also show that the FIES is unidimensional, measuring the
     The high infits for the items “worried,” in Sudan and the items            one construct of FI. The correlations between residuals of some items
“healthy” and “whlday” in Syria suggest that these items are weakly as-         in Algeria, Tunisia, and Lebanon may be explained by the fact that these
sociated with FI in these countries. In contrast, the low infit for the         countries were highly food secure, with a large number of extreme val-
items “worried” and “runout” in Syria highly indicate possible redun-           ues (zeros) and so the data were excluded from the Rasch analysis. Fur-
dancy of one of these items, that is, they may be measuring the same            ther testing should be done when more data become available, and cog-
level of FI. Nevertheless, the high and low infits in Sudan and Syria may       nitive testing may be required for these items to ensure that they do not
be attributed to the small nonextreme sample sizes, which provide less          measure the same experience.
precise estimates due to the potential to inflate margins of error of the           Our results indicate that there are some inconsistencies in the con-
infit statistic (25). Thus, for these 2 countries, further testing is recom-    ceptual order of the severity of FI measured by some items. In partic-
mended in larger samples. Larger samples may decrease the effect of the         ular, a shift in the order of the 3 items measuring the less severe levels
erratic responses or measurement errors and improve infit values for the        of FI. The item “fewfood” was found to measure the least severe level
specific problematic items (17, 30, 33). Infit statistics in the range of 1.3   of FI instead of the item “worried” as conceptualized in FIES. A possi-
to 1.5, such as in Sudan, indicate that the item can still be used, but im-     ble explanation for this finding may be related to religious and fatalistic
provements are recommended (2). Improvements can be made through                beliefs of people in the LAS region that God will provide and so there

CURRENT DEVELOPMENTS IN NUTRITION
8 Sheikomar et al.

TABLE 4 Sociodemographic and economic characteristics of severe food insecure (FI) respondents, by the Human Development
Index (HDI) and within-group comparisons,1 Gallop World Poll (GWP) surveys 2014 to 2017
                                                                              Overall                          High HDI2                   Low HDI3
Characteristics                                                        n        Weighted %                n        Weighted %         n       Weighted %
Food insecurity                                                      9015            15.7              2508              8.3∗∗∗     6507          24.9∗∗∗
Age group
  Younger adult (19 y to 49)                                         7167            15.5∗             1971              8.1∗       5196          25.1
  Older adult (50+)                                                  1848            16.5               537              9.3        1311          24.1
Gender
  Men                                                                4320            14.1∗∗∗           1330              7.6∗∗∗     2990          23.8∗∗
  Women                                                              4695            17.6              1178              9.4        3517          25.9
Education
  6 members                                         3698            22.0               764             12.3        2934          28.2
  Household with 0–3 children                                        6145            12.6∗∗∗           2071              7.7∗∗∗     3870          20.5∗∗∗
  Household with ≥4 children                                         3074            28.5               437             13.8        2637          35.0
Income quintile
  Lowest                                                             2786            26.8∗∗∗             962            17.8∗∗∗     1824          38.0∗∗∗
  Second                                                             2078            18.8                614            10.5        1824          29.1
  Middle                                                             1693            14.4                449             6.9        1244          23.7
  Fourth                                                             1375            11.1                283             4.1        1092          19.7
  Highest                                                            1083             7.8                200             2.6         883          14.2
Political score (PSAVT)4
  Low                                                                5547            25.2∗∗∗            352              6.8∗∗∗     5195          32.2∗∗∗
  Medium                                                             1648            10.2              1163              9.3         485          13.9
  High                                                               1820             9.3               993              8.0         827          11.8
1
  Chi-square tests were used to evaluate the distributions
2
  High HDI includes Lebanon, Saudi Arabia, Jordan, Algeria, Bahrain, Kuwait, Libya, Tunisia, and United Arab Emirates.
3
  Low HDI includes Egypt, Morocco, Syria, Palestine Territories, Mauritania, Iraq, Somalia, Sudan, Yemen, and South Sudan.
4
  Political Stability and the Absence of Violence and Terrorism:
1) Low: Syria, Lebanon, Palestine Territories, Iraq, Somalia, Sudan, Libya, Yemen, and South Sudan.
2) Medium: Egypt, Saudi Arabia, Algeria, Bahrain, and Tunisia.
3) High: Morocco, Jordan, Mauritania, Kuwait, and the United Arab Emirates.
∗
  Significantly different at P ≤0.05.
∗∗
   Significantly different at P ≤0.01.
∗∗∗
    Significantly different at P ≤0.0001.

is no need to worry. Similarly, the high response to the item eat “few-                  In this study we found a higher prevalence of severe FI in the LAS
food” may also represent cultural eating patterns in some countries of               (15.7%) than in other geographical classifications of the region. For ex-
this region and may not necessarily be an indication of FI. Neverthe-                ample, using FIES, the FAO report of the NENA region, showed a severe
less, since all the LAS countries showed the same disordering of these               FI prevalence of 9.5% in 2014–2015 (14) and 10.3% in the WANA region
items, it indicates consistency of FIES in measuring FI in this region.              in 2014–2015 (38). This difference in prevalence may be due to the dif-
This disordering did not affect the overall measurement of FI in this                ferent countries that are included in these regional surveys. Our study
study since the least 3 items were categorized similarly as food secure.             found that the aggregated prevalence of severe FI from 2014 to 2017
To overcome the limitation of the disordering of the items we examined               is quite varied in individual countries of the LAS region. Additionally,
the FI as a dichotomous variable as food secure and moderate FI ver-                 the overall prevalence of FI in this region should be considered provi-
sus severe FI. Nevertheless, these items may also need to be cognitively             sional and explained with caution since a wide variation in economic
tested.                                                                              status characterizes the LAS region and also due to small samples in

                                                                                                                      CURRENT DEVELOPMENTS IN NUTRITION
Validity of the food insecurity experience scale 9

some countries. Different patterns of FI emerged when countries were           vide additional information to better understand the causes of FI in that
grouped by economic level. Our study showed that as the level of in-           region.
come, HDI, or political score falls, the prevalence of severe FI increases.        In LAS, a common threshold of severe FI exists for adults using FIES.
The same pattern was also reported in the 2018 and 2020 FAO reports            These results indicate that FI is experienced similarly across the LAS
(15, 39).                                                                      with few exceptions, and it is comparable across countries and popula-
    The country-level prevalence of severe FI also varied by political sta-    tions of that region. Cognitive testing is recommended for certain ques-
bility, indicating a need for an in-depth assessment of the determinants       tions of the FIES tool to possibly guide the improvement of items that
of severe FI, tailored interventions, and continued monitoring of FI in        are correlated and those with high outfit statistics. Additionally, a closer
this region. The politically unstable countries of Iraq, South Sudan, So-      examination of the order of FIES items for LAS is warranted. The dis-
malia, and Syria had the highest prevalence of severe FI. Although as-         ordering of the severity level of FI measured by some items observed in
sessing FI in real-time is difficult, such surveys may provide the best        this study, indicates that the items may need to be reordered to better
possible snapshot at the time of conflict; however, it might change in the     measure the least severe category of FI. At a regional level, FIES is rec-

                                                                                                                                                                   Downloaded from https://academic.oup.com/cdn/article/5/4/nzab017/6158388 by guest on 28 April 2021
course of new conflict dynamics. In this study, Yemen had a lower level        ommended for use especially for comparative purposes to other regions
of severe FI, which might be the result of a sampling error due to active      of the world. However, country-based surveys may be better served by
conflict in the country; however, the prevalence of combined moderate          using locally developed and tested instruments.
and severe FI was quite high. These results may also be quite different in
the current circumstances due to the ongoing war and pandemic. Simi-
                                                                               Acknowledgments
larly, the prevalence of combined moderate and severe FI was 46.7% and
                                                                               We thank FAO-VoH for the data license.
severe FI was 20% in Sudan. Therefore, the high prevalence of FI in this
                                                                                  The authors’ responsibilities were as follows—OBSH and NS: con-
country might be due to the prolonged conflict, with resultant environ-
                                                                               ceived the study; OBSH: analyzed the data; OBSH and NS: interpreted
mental degradation, and poverty that increases the risk of FI (40). Sudan
                                                                               the data and made critical revisions of the manuscript; OBSH and NS:
is one of the wealthiest countries in Africa in terms of natural resources,
                                                                               wrote the manuscript and had primary responsibility for the final con-
but the majority (80%) of the population depend on agricultural activ-
                                                                               tent; and all authors: read and approved the final manuscript.
ity for their livelihood (41). In conflict situations, many factors may ex-
acerbate FI and malnutrition and their consequences. Conflict impacts
access to and utilization of food, water, and health care, leading to mal-     Data Availability
nutrition.
    Individuals with severe FI were characterized by lower educational         Data obtained through a license from FAO-VoH; part of the data is not
attainment, lower incomes, unemployment, rural residence, and hav-             available for public access, data used for this analysis will be furnished
ing >3 children in the household. These findings were not surpris-             upon request.
ing since these characteristics are associated with resource access and
have been reported in previous studies conducted in different coun-
                                                                               References
tries of the LAS region (5, 7–10, 13, 14, 16, 42). FI was more preva-
lent in women than men, irrespective of HDI. However, women in                  1. Jonathan Masters DE, Mohammed AS. The Arab League, Council on Foreign
high HDI countries had a lower risk of severe FI compared with those               Relations. 2014, Available at: https://www.cfr.org/backgrounder/arab-leag
living in low HDI countries, which might be due to better educa-                   ue.
tional and employment opportunities, and potentially due to social              2. United Nations (UN). The Arab Millennium Development Goals Report:
services available in high HDI countries. Estimates of FI in other re-             Facing Challenges and Looking Beyond 2015, United Nations and League
                                                                                   of Arab States, 2015. Available at: https://www.unep.org/ar/node/10891.
gions of the world, by gender, also point to a gender gap according             3. Pérez-Escamilla R, Gubert MB, Rogers B, Hromi-Fiedler A. Food security
to the FAO report, and the prevalence of FI is higher among women                  measurement and governance: assessment of the usefulness of diverse food
in every continent (15). Given the primary role women play in the                  insecurity indicators for policymakers - ScienceDirect. Global Food Security
households as caretakers, producing and preparing food, FI may hin-                2017;14:96–104.
der them from having time for jobs outside of the home, leading to              4. Jones AD, Ngure FM, Pelto GH, Young SL. What are we assessing when we
                                                                                   measure food security? A compendium and review of current metrics. Adv
a vicious cycle of poverty and FI. Future studies of women and older               Nutr 2013;4(5):481–505.
adults of that region may inform policies targeted to these vulnerable          5. Kabbani N, Wehelie Y. Survey results on hunger and food insecurity in
groups.                                                                            Yemen. Topics in Middle Eastern and North African Economies 2005;7.
    The strengths of our study include the use of large nationally rep-         6. Gordon NH, Halileh S. An analysis of cross sectional survey data of stunting
resentative samples from 19 countries of the LAS, which allow for the              among Palestinian children less than five years of age. Matern Child Health J
                                                                                   2013;17(7):1288–96.
generalizability of the results to that region. Also, using the same instru-    7. Bawadi HA, Tayyem RF, Dwairy AN, Al-Akour N. Prevalence of food
ment to assess food security in this study allows for comparison across            insecurity among women in northern Jordan. J Health Popul Nutr
countries and populations and within countries over time. FIES is an               2012;30(1):49–55.
easy tool to use which allows for real-time monitoring and generation           8. Doocy S, Sirois A, Anderson J, Tileva M, Biermann E, Storey JD, Burnham
of food security information that may guide actions and interventions.             G. Food security and humanitarian assistance among displaced Iraqi
                                                                                   populations in Jordan and Syria. Soc Sci Med 2011;72(2):273–82.
Limitations of this study are related to the cross-sectional study de-          9. Ghattas H, Sassine AJ, Seyfert K, Nord M, Sahyoun NR. Prevalence and
sign which does not allow for inference of causality of FI and responses           correlates of food insecurity among Palestinian refugees in Lebanon: data
may be biased due to self-reported data. Qualitative studies can pro-              from a household survey. PLoS One 2015;10(6):e0130724.

CURRENT DEVELOPMENTS IN NUTRITION
10   Sheikomar et al.

10. Ghattas H, Sassine AJ, Seyfert K, Nord M, Sahyoun NR. Food insecurity           25. FAO, Methods fore estimating comparable rates of food insecurity experienced
    among Iraqi refugees living in Lebanon, 10 years after the invasion of Iraq:        by adults throughout the world, 2016. Rome, FAO. Available at: http://www.
    data from a household survey. Br J Nutr 2014;112(1):70–9.                           fao.org/3/a-i4830e.pdf,.
11. Ghattas H, Barbour JM, Nord M, Zurayk R, Sahyoun NR. Household                  26. United Nations Development Programme (UNDP). [ Internet]. Available at:
    food security is associated with agricultural livelihoods and diet quality          http://hdr.undp.org/en/content/human-development-index-hdi, 2016.
    in a marginalized community of rural Bedouins in Lebanon. J Nutr                27. UNDP, 2020, [Internet]. Human Development Data Center.United Nations
    2013;143(10):1666–71.                                                               Development Programme. Available at: http://hdr.undp.org/en/data.
12. Food USDA. U.S. Household Food Security Survey Module. [Internet].              28. WB, 2020. [Internet]. Political Stability and Absence of Violence/Terrorism:
    Available at: https://snaped.fns.usda.gov/library/materials/us-household-f          Estimate. Available at: https://datacatalog.worldbank.org/political-stability-
    ood-security-survey-module, 2009.                                                   and-absence-violenceterrorism-estimate.
13. Sahyoun NR, Nord M, Sassine AJ, Seyfert K, Hwalla N, Ghattas H.                 29. WB, 2020. [Internet]. Worldwide Governance Indicators. The World Bank.
    Development and validation of an Arab family food security scale. J Nutr            Available at: https://datacatalog.worldbank.org/dataset/worldwide-govern
    2014;144(5):751–7.                                                                  ance-indicators.
14. FAO. Regional Overview of Food Insecurity – Near East and North Africa:         30. Gordon RA. Measuring constructs in family science: how can item response

                                                                                                                                                                         Downloaded from https://academic.oup.com/cdn/article/5/4/nzab017/6158388 by guest on 28 April 2021
    Strengthening Regional Collaboration to Build Resilience for Food Security          theory improve precision and validity? Fam Relat 2015;77(1):147–76.
    and Nutrition. Cairo, Egypt, 2015.                                              31. Tatum DS. Rasch analysis: an introduction to objective measurement.
15. FAO, IFAD, UNICEF, WFP and WHO. The State of Food Security and                      Laboratory Medicine 2000;31(5):272–4.
    Nutrition in the World 2019: Safeguarding against economic slowdowns and        32. Food and Agriculture Organization (FAO). An Introduction to the Basic
    downturns, Rome, 2019.                                                              Concepts of Food Security. European Commission-FAO Food Security
16. FAO. Near East and North Africa Regional Overview of Food Insecurity                Program, 2008.
    2016. Cairo, Egypt, 2017; 35.                                                   33. Nord M. Introduction to Item Response Theory Applied to Food Security
17. Nord MC, Carlo, Viviani S. Methods for estimating comparable prevalence             Measurement: Basic Concepts, Parameters and Statistics. Rome: FAO, 2014.
    rates of food insecurity experienced by adults in 147 countries and             34. Cafiero CV, Sara, Nord M. Food security measurement in a global context:
    areas – IOPscience. J Phys: Conf Ser 2016;772 doi: 10.1088/1742-                    the food insecurity experience scale - ScienceDirect. 2017;116:146–52.
    6596/772/1/012060.                                                              35. Wright B, Linacre J, 2016. [Internet]. Available at: https://www.rasch.org/rm
18. Ballard TJ, Kepple AW, Cafiero C. The Food Insecurity Experience Scale:             t/rmt83b.htm, (accessed 12/6/2016).
    Development of a Global Standard for Monitoring Hunger Worldwide.               36. Yang FM, Kao ST. Item response theory for measurement validity. Shanghai
    Rome: Food and Agriculture Organization of the United Nations,                      Arch Psychiatry, 2014:171–7.
    2013.                                                                           37. Ballard TK, Anne, Cafiero C. The Food Insecurity Experience Scale:
19. Smith MD, Rabbitt MP, Coleman-Jensen A. Who are the world’s food                    Development of a Global Standard for Monitoring Hunger Worldwide.
    insecure? New evidence from the Food and Agricultural Organization’s Food           Technical Paper. Rome, 2017.
    Insecurity Experience Scale. World Dev 2017;93:402–12.                          38. FAO, IFAD, UNICEF, WFP, WHO. The State of Food Security and Nutrition
20. Cafiero C, Nord M, Viviani S, Del Grossi ME, Ballard T, Kepple A, Miller            in the World 2017. Building Resilience for Peace and Food Security. Rome:
    M, Nwosu C. Methods for estimating comparable prevalence rates of food              FAO, 2017.
    insecurity experienced by adults in 147 countries and areas. Rome: Food and     39. FAO I, UNICEF, WFP, WHO. The State of Food Security and Nutrition in
    Agriculture Organization of the United Nations, 2016.                               the World 2020. Rome, 2020.
21. Ballard TJ, Kepple AW, Cafiero C, Schmidhuber J. Better measurement of          40. WFP., 2019 [Internet]. Sudan Country Brief. World Food Programme.
    food insecurity in the context of enhancing nutrition1 . Ernahrungs Umschau         Available at: https://www.wfp.org/countries/sudan.
    2014;61(2):38–41.                                                               41. Ibnouf FO. The role of women in providing and improving household
22. Wambogo EA, Ghattas H, Leonard KL, Sahyoun NR. Validity of the food                 food security in Sudan: implications for reducing hunger and malnutrition.
    insecurity experience scale for use in sub-Saharan Africa and characteristics       Journal of International Women’s Studies 2009;10(4):144–67.
    of food-insecure individuals. Curr Dev Nutr 2018;2(9):nzy062.                   42. Salti N, Ghattas H. Food insufficiency and food insecurity as risk factors for
23. Gallup. Worldwide Research Methodology and Codebook. 2015.                          physical disability among Palestinian refugees in Lebanon: evidence from an
24. Gallup World Poll (GWP). Gallup World Poll Research Design. 2006.                   observational study. Disability and Health Journal 2016;9(4):655–62.

                                                                                                                     CURRENT DEVELOPMENTS IN NUTRITION
You can also read