Variation in thermal biology of three closely related lizard species along an elevation gradient - Bob Wong
←
→
Page content transcription
If your browser does not render page correctly, please read the page content below

Biological Journal of the Linnean Society, 2019, 127, 278–291. With 4 figures.

Variation in thermal biology of three closely related
lizard species along an elevation gradient
ANNA F. SENIOR1*, , ZAK S. ATKINS2, NICK CLEMANN3, MICHAEL G. GARDNER4,5,
MELLESA SCHRODER6, GEOFFREY M. WHILE7, BOB B. M. WONG1 and

                                                                                                                            Downloaded from https://academic.oup.com/biolinnean/article-abstract/127/2/278/5479372 by guest on 23 May 2019
DAVID G. CHAPPLE1,
1
 School of Biological Sciences, Monash University, Clayton, VIC 3800, Australia
2
 Department of Ecology, Environment and Evolution, La Trobe University, Bundoora, VIC 3086,
Australia
3
 Arthur Rylah Institute for Environmental Research, Victorian Department of Environment, Land, Water
and Planning, Heidelberg, VIC 3084, Australia
4
 College of Science and Engineering, Flinders University, Adelaide, SA 5001, Australia
5
 College of Science and Engineering, Flinders University, Adelaide, SA 5001, Australia
6
 NSW National Parks and Wildlife Service, Southern Ranges Branch, Jindabyne, NSW 2627, Australia
7
 School of Biological Sciences, University of Tasmania, Hobart, TAS 7005, Australia

Received 11 January 2019; revised 3 March 2019; accepted for publication 12 March 2019

The critical thermal limits of organisms and the thermal sensitivity of their performance tend to vary predictably
across latitudinal gradients. There has been comparatively less investigation into variation in thermal biology
with elevation, despite similar gradients in environmental temperatures. To redress this, we examined critical
thermal limits (CTmin and CTmax), thermal sensitivity of locomotor performance, and shelter site attributes, in
three lizard species that replace one another along a contiguous elevation gradient in south-eastern Australia. The
species examined consisted of a highland specialist, Liopholis guthega, mid-elevation species, Liopholis montana,
and lowland species, Liopholis whitii. We found similar habitat attributes between the species, but L. guthega
predominantly occurred in open habitat, which might reflect a strategy for maximizing exposure to insolation. We
found intraspecific variation in lizard thermal traits, most notably in cold tolerance of L. guthega and in both heat
and cold tolerance of L. whitii, suggesting population-specific variables acting on thermal physiology rather than a
species distribution maintained by distinct thermal tolerances. This study represents one of the few examinations of
thermal trait variability within and between species with elevation in a temperate system and provides evidence for
thermal physiology driven by adaptation and/or physiological plasticity to local conditions.

ADDITIONAL KEYWORDS: alpine – distribution range – Liopholis – montane – reptile – skink – thermal
tolerance.

                    INTRODUCTION                                    of climate change, with ectotherms likely to be most
                                                                    affected (Kearney et al., 2009; Sinervo et al., 2010;
Understanding the link between geographical
                                                                    Böhm et al., 2016; Winter et al., 2016). Dependent
range, physiology and temperature is fundamental
                                                                    on external heat sources, ectotherms must maintain
in the field of macro-ecology, yet the mechanisms
                                                                    body temperatures within a narrow range essential
responsible for patterns in species distribution
                                                                    for performance by adjusting thermoregulatory
remain poorly understood (Caldwell et al., 2015; Oyen
                                                                    behaviours (Caldwell et al., 2017) or through
et al., 2016). This link is increasingly relevant because
                                                                    long-term changes in thermal sensitivity through
widespread range shifts are predicted as an outcome
                                                                    acclimatization or adaptation, or both (Gvoždík &
                                                                    Castilla, 2001; Sheldon & Tewksbury, 2014; Llewelyn
                                                                    et al., 2018). The experimental establishment of the
*Corresponding author. E-mail: anna.senior@monash.edu               upper and lower thermal limits [also referred to as

© 2019 The Linnean Society of London, Biological Journal of the Linnean Society, 2019, 127, 278–291                 278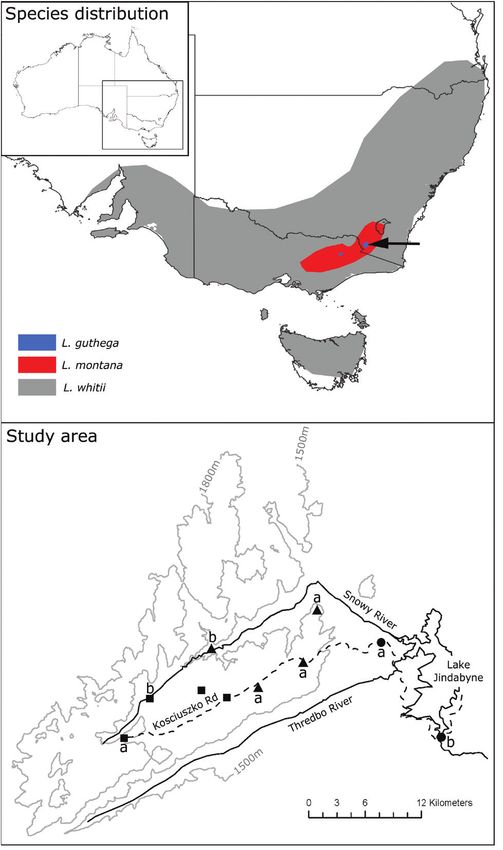
VARIATION IN THERMAL BIOLOGY OF LIZARDS                 279

critical thermal maximum (CTmax) and critical                    of one population per species (Herrando-Pérez et al.,
thermal minimum (CTmin)] of an organism allows us                2018). Underlying this methodology is the assumption
to estimate this range (Sheldon & Tewksbury, 2014).              that intraspecific variation in thermal tolerances
The CTmin and CTmax are the temperatures at                      is negligible compared to interspecific variation
which an organism loses critical motor function and              and is unlikely to effect overall patterns (Herrando-
the ability to escape from conditions that could lead            Pérez et al., 2018). In order to evaluate interspecies
to death (Oyen et al., 2016).                                    vulnerability to climate change comprehensively, there
   In ectotherms, behavioural thermoregulation can               is a need to incorporate thermal biology measures
shield some physiological traits from selection (the             across the geographical range of species. Studies
Bogert effect) more so than others, which cannot be              that examine clinal variation in intraspecific thermal

                                                                                                                           Downloaded from https://academic.oup.com/biolinnean/article-abstract/127/2/278/5479372 by guest on 23 May 2019
as easily buffered and are thus exposed to stronger              tolerance are an important component in better
selection (Muñoz et al., 2014). In diurnal species, cold         understanding interspecific variation. However, studies
temperatures cannot be buffered at night as easily as            have tended to examine variation in one species over
hot temperature can be during the day (Muñoz et al.,             an elevation gradient (Gvoždík & Castilla, 2001) or in
2014). Trends in critical thermal maxima are therefore           multiple species collected from different elevations,
not as pronounced as in critical thermal minima, and             and understanding of intraspecific differences relative
upper thermal limits (compared with lower thermal                to interspecific differences is lacking (Huang et al.,
limits) are typically more conserved among populations           2006; Caldwell et al., 2015). Temperate systems are
(Moritz et al., 2012; Kellermann et al., 2012; Pontes-           often harsher and more seasonal than their tropical
da-Silva et al., 2018) and species (Addo-Bediako et al.,         counterparts (Barve & Dhondt, 2017; Bastianelli et al.,
2000; Araújo et al., 2013).                                      2017). Thus, ectotherms living at high elevations in
   Long-term fluctuations in temperature, such as those          high latitudes are expected to have relatively wide
experienced across environmental gradients, are likely           tolerance breadths driven by cold tolerance compared
to lead to evolutionary processes acting to widen the            with lowland species and tropical species (Clusella-
breadth of thermal tolerance (Gvoždík & Castilla, 2001;          Trullas & Chown, 2014; Oyen et al., 2016), yet
Sheldon & Tewksbury, 2014), leading to observable                temperate systems are also poorly represented in the
geographical patterns in thermal tolerances, such as             literature.
decreases in critical thermal minima with increasing                The Australian scincid lizard genus Liopholis
latitude (Gaston & Chown, 1999; Addo-Bediako                     includes three species occurring along an elevation
et al., 2000; Oyen et al., 2016). Organisms that occur           gradient in temperate south-eastern Australia.
across elevation gradients also experience extreme               Liopholis guthega is the continent’s highest elevation
fluctuations in seasonal and daily temperatures over             reptile (Atkins, 2018), occurring in two restricted
comparatively short geographical distances, and                  regions from 1600 m above sea level (a.s.l.) up to
differences in environmental temperature are highly              2170 m. The narrow elevational band occupied by
pronounced across small spatial scales, resulting in             this species abuts the ranges of its closest relatives,
strong elevational stratification of habitat, thermal            Liopholis montana and Liopholis whitii, two species
niches and species endemism at different elevations              that extend to lower elevations (Donnellan et al.,
(Dirnböck et al., 2011; McCain & Colwell, 2011; Gifford          2002; Chapple & Keogh, 2004; Chapple et al., 2005;
& Kozak, 2012; Clusella-Trullas & Chown, 2014;                   Fig. 1). The mountain skink (L. montana) occupies
Oyen et al., 2016). Despite this, very little has been           subalpine to montane environments (between
done to examine thermal tolerance variability and                1800 and 900 m) throughout the southern Great
elevation (Gaston & Chown, 1999; Oyen et al., 2016),             Dividing Range (Donnellan et al., 2002). White’s
and the factors underlying species elevational range             skink (L. whitii) is a widespread species occurring
limits remain unknown for most organisms (Gifford                throughout eastern Australia, from sea level to 1400
& Kozak, 2012; Rodríguez-Castañeda et al., 2017).                m (Wilson & Swan, 2010; W. Osborne, unpublished
Detailed studies on closely related species across               data). Thus, this species group provides an excellent
elevation gradients allow us to examine the link                 model to investigate ecological and physiological
between thermal tolerance, elevation and distribution,           trait variability with elevation. Both the high and
and present an opportunity to study environmental                mid-elevation species experience extended snow
factors limiting populations locally.                            cover for several months of the year, with the activity
   Furthermore, studies that model the response of               season decreasing in length at higher elevations. The
a species to climate change using thermal tolerance              genetic split between the three is thought to have
measures are becoming more prevalent in the literature           occurred in response to rapid cooling and drying
(Caldwell et al., 2015; Wright et al., 2016; Atkins,             of southeast Australia during the late Miocene to
2018; Herrando-Pérez et al., 2018). These models are             Pliocene (2–5 Mya; Chapple & Keogh, 2004; Chapple
frequently built on estimated critical thermal limits            et al., 2005). It is likely that the Liopholis species

© 2019 The Linnean Society of London, Biological Journal of the Linnean Society, 2019, 127, 278–291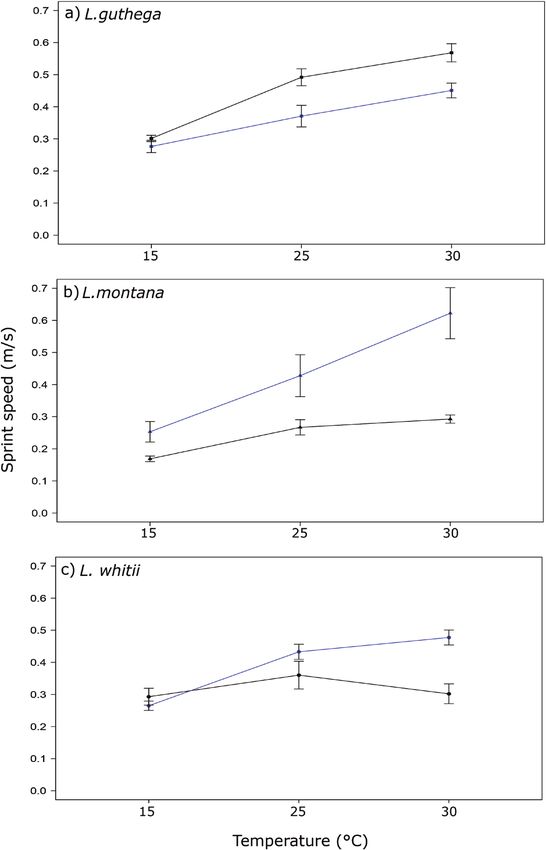
280    A. F. SENIOR ET AL.

                                                                                                                                 Downloaded from https://academic.oup.com/biolinnean/article-abstract/127/2/278/5479372 by guest on 23 May 2019

Figure 1. Map showing contrasting broad-scale distribution of Liopholis species in south-eastern Australia, with detail
of study area showing localities where Liopholis populations were found along an elevational cline in Kosciuszko National
Park. Symbols are as follows: squares, Liopholis guthega; triangles, Liopholis montana; circles, Liopholis whitii. Populations
of each species used in thermal assays are denoted by: a, highest population; b, lowest population. An additional two
L. guthega populations not sampled have been included to illustrate the spatial proximity of L. guthega and L. montana
populations within the study area.

                           © 2019 The Linnean Society of London, Biological Journal of the Linnean Society, 2019, 127, 278–291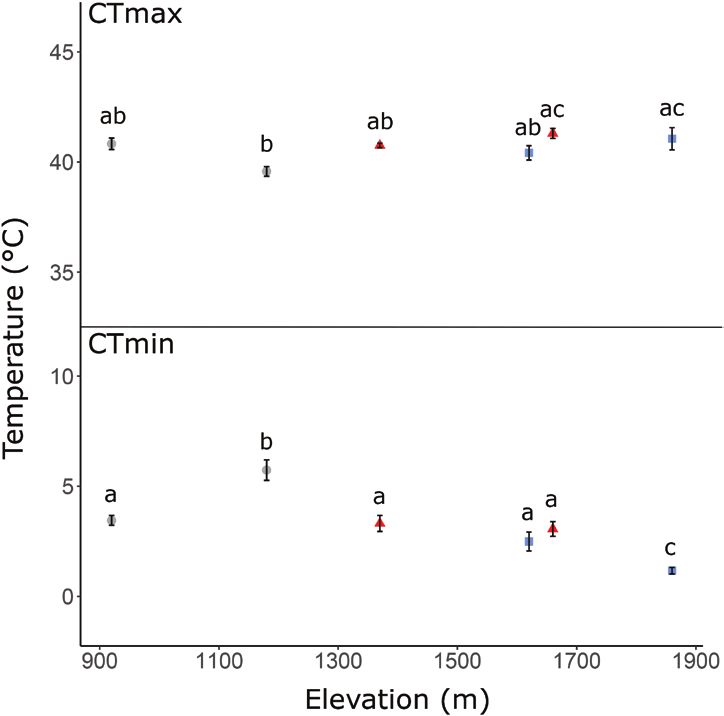
VARIATION IN THERMAL BIOLOGY OF LIZARDS                                   281

distributions have radiated and contracted several                          distributions and any occurrences of sympatry.
times with the alpine zone during subsequent                                Surveys targeted previous species records (Atlas of
Pleistocene glacial cycles (Chapple et al., 2005). The                      Living Australia, 2016), which were located primarily
three species are similar morphologically and most                          in areas with granite outcrops and subsurface boulders
probably occupy similar ecological niches, appearing                        in open snow gum (Eucalyptus pauciflora) woodland
to be largely allopatric in occurrence despite some                         or tall open forest (Donnellan et al., 2002; Chapple
broader scale overlap in elevational range.                                 et al., 2005; Atkins, 2018). Searches were extended
  There are concerns that changing environmental                            from these points, following topographic contours
conditions associated with climate change might                             up to 5 km from records. Based on these surveys, we
erode species’ thermal niches and increase likelihood                       identified a high- and low-elevation populations for

                                                                                                                                                       Downloaded from https://academic.oup.com/biolinnean/article-abstract/127/2/278/5479372 by guest on 23 May 2019
of secondary contact. The range-restricted alpine                           each species, which were then used for the sampling
endemic, L. guthega, is likely to experience an                             component of the study. To limit confounding seasonal
expansion of activity season (Atkins, 2018), but a                          effects on thermal physiology, sites that were closest in
limited dispersal capacity might leave it vulnerable                        elevation were sampled within 1 month of each other
to habitat incursion by other Liopholis (Atkins,                            (Table 1). Seasonal variability in critical thermal
2018). Here, we investigate distribution and habitat                        tolerances has been examined in the low-elevation
parameters and examine intra- and interspecific                             population of L. whitii (our unpublished data). We
variation in thermal physiology to understand                               found that CTmin increased monthly throughout
the drivers of elevational distribution in these                            the active season but CTmax did not. The range
species. If discrete thermal tolerances are driving                         of CTmin recorded for L. whitii (low elevation)
the species’ distribution, we would expect a species                        throughout the season was much higher than CTmin
difference in CTmin, with mid-elevation and lowland                         recorded for L. guthega at the highest sample site
species constrained from high elevations by a lesser                        along the gradient, and lower than CTmin recorded
tolerance to cold compared with the high-elevation                          for L. whitii (high-elevation site), reflecting the main
congener. A difference in critical thermal minima may                       findings of this study. Thus, we believe that the results
correspond to thermal dependence of performance,                            presented here are indicative of true patterns rather
with high-elevation species able to perform better at                       than seasonal variability of critical thermal limits.
lower temperatures. There might also be a species                           We collected both males and females for two reasons.
difference in CTmax, with the higher-elevation                              First, rarity of L. guthega (Endangered; Clemann et al.,
species, L. guthega and L. montana, being less                              2018) and L. montana (Near Threatened; Clemann
tolerant to warm temperatures experienced over                              et al., 2018) meant that both sexes were needed to
longer periods at lower elevations, thus limiting their                     maximize sample size. Second, we saw an opportunity
distribution.                                                               to undertake a ‘between-sex’ comparison, albeit
                                                                            only between gravid females and males, because all
                                                                            captured females were gravid. Skinks were caught by
                                                                            hand or with the aid of a noose pole, from the entrance
              MATERIAL AND METHODS
                                                                            to burrows or sheltering crevices.
                 Habitat and distribution                                      Attributes of the habitat surrounding these active
Surveys for Liopholis populations were undertaken                           shelter sites were recorded by placing a 5 m2 quadrat,
between 920 and 1860 m a.s.l., between November                             divided into four 1.25 m2 subregions, at the location
and March in 2016–2018, to identify elevational                             of each collected skink. The percentage cover of rock,

Table 1. Collection site details presented from lowest to highest elevation

Species                           Elevation               Capture                 Snout–vent length                  N (female:male)
                                  (m a.s.l.)              month                   (cm; mean ± SE)

Liopholis whitii                   920–930                November                77.25 ± 0.99                       20 (12:8)
Liopholis whitii                  1180–1190               November                75.21 ± 1.54                       14 (6:8)
Liopholis montana                 1340–1370               March                   89.50 ± 2.74                        8 (4:4)
Liopholis guthega                 1620–1650               February                93.31 ± 1.47                       10 (0:10)
Liopholis montana                 1640–1660               December                92.33 ± 1.90                       10 (4:6), 2 (1:1), 2 (0:2)*
Liopholis guthega                 1840–1860               December                98.26 ± 1.21                       19 (10:9)

Only Liopholis guthega males were collected from the lower-elevation site, because survey times for this site coincided with birthing times for this
species. *High-elevation Liopholis montana was made up of a composite of three nearby sites from similar elevations.

© 2019 The Linnean Society of London, Biological Journal of the Linnean Society, 2019, 127, 278–291
282 A. F. SENIOR ET AL.
soil and leaf litter was recorded, as were ground cover A thermocouple probe (Eutech Instruments; EcoScan
(< 30 cm), mid-storey (> 30 cm high) and trees (tree JKT; accuracy ± 0.5 °C) was inserted ~1 cm into the
trunks and low-lying branches) for each subregion. cloaca to determine the starting temperature (15 ± 2 °C)
The percentage of canopy cover was estimated from and was then taped (Leukopor tape) around the tail to
a photograph taken directly above the centre of the ensure the thermocouple remained in the cloaca for the
quadrat. Leaf litter depth (in millimetres) was measured entirety of the trial. Each lizard was placed in a clear,
at four points, and total log length within the quadrat lidless, plastic container (25 cm × 13 cm × 23 cm), which
was measured (in metres). Substrate temperatures was held in either an ice bath for CTmin trials or a
were recorded using temperature-sensitive data water bath heated to 50 °C for CTmax trials. Ramping
loggers (Maxim Thermochron iButtons, DS1922L) at rate was kept between 1 and 1.5 °C per 2 min. Body
Downloaded from https://academic.oup.com/biolinnean/article-abstract/127/2/278/5479372 by guest on 23 May 2019
each sample site. Data loggers (N = 4) were enclosed in temperature was recorded using the thermocouple at
a deflated balloon to provide protection from moisture 30 s intervals for the duration of the trials. For CTmin,
and placed in areas where lizards had been seen skinks were turned onto their dorsal surface once body
basking. Substrate temperatures were recorded four temperature dropped to 8 °C. For CTmax, turning
times a day from June to November 2017. began once body temperature reached 37 °C. The
tolerance breadth (TTB) was calculated by subtracting
CTmin from CTmax (Huey & Stevenson. 1979; Sheldon
Animal husbandry & Tewksbury, 2014).
On the day of capture, skinks were held in cloth bags We also measured thermal sensitivity of locomotor
in the field before transfer to a nearby research facility performance (sprint speed) in both sexes, following a
(36°20′47.8″S, 148°36′20.9″E). On arrival, sex was rest day after thermal indice trials. Maximal sprint
determined via eversion of the hemipenes of males, and speed was characterized at three body temperatures
females were palpated to confirm reproductive status experienced by skinks across their active season (15,
(Melville & Swain, 1999). The snout–vent length (SVL) 25 and 30 °C), to investigate the influence of body
of both sexes was measured to the nearest 1 mm. temperature on locomotor ability (Sun et al., 2014;
Skinks were housed individually in plastic enclosures Artacho et al., 2015) and to compare locomotor ability
(60 cm × 40 cm × 35 cm) lined with paper towel, with within and between species. Skinks were acclimated
a flat granite rock provided for basking and a plastic to temperature for 1 h in an incubator before each
hide for shelter. Ambient daytime temperatures ranged temperature trial. All skinks were first tested at 15,
from 15 to 25 °C. Skinks were provided with a heat then at 25 and lastly at 30 °C, with one temperature
source in the form of a 40 W incandescent light bulb trial completed in a day. A thermocouple probe was
suspended from the roof of the enclosure at one end, inserted –1 cm into the cloaca to determine the starting
providing a thermal gradient of 22–40 °C for a 12 h temperature and then removed before commencement
period (07:00–19:00 h) that allowed for behavioural of the trial. Skinks were then released at one end
thermoregulation. Lizards were fed every second of a 1 m racetrack enclosed on the sides, with the
day on a diet of mealworms dusted with calcium and bottom lined with sandpaper (fine) to assist lizards
vitamin supplements (Vetafarm, Multical dust). Water with gripping of the substrate. As per Crowley (1985),
was available ad libitum. skinks were chased down the track by the observer’s
(A.F.S.) hand. Each skink was run three times at each
temperature, with the time to complete recorded using
Thermal indices and maximal sprint speed a stopwatch. As per Artacho et al. (2015), the fastest
The upper and lower thermal limits of lizards were speed for each temperature was used as the estimate
established by estimating the CTmin and CTmax, of maximal sprint speed. Maximal sprint speed at each
following protocols of Lutterschmidt & Hutchison temperature treatment was used to calculate speed (in
(1997a, b). Lizards were given 24 h to acclimate to metres per second; speed = distance/time).
captivity before beginning CTmin thermal trials,
followed by a rest day and CTmax trials. Males and
females were used in CTmin trials, but only males were Statistical analysis
tested in CTmax trials to avoid any risks that heating Data analysis was conducted in the statistical program
females might have on unborn embryos. The righting R v.3.4.1 (R Core Team, 2018). For habitat analysis,
reflex was used to determine CTmin and CTmax correlating variables were removed [leaf litter depth,
(Lutterschmidt & Hutchison, 1997a, b). A single tree cover and log length (canopy cover was retained)],
observer (A.F.S.) made all of the measurements, and and data were transformed (square root) and run
no adverse impacts on any skink were observed. through a principal components analysis with varimax
To obtain the CTmin and CTmax, each skink rotation to reduce the data into related principal
was first placed in an incubator set to 15 °C for 1 h. component (PC) scores. Components were retained
© 2019 The Linnean Society of London, Biological Journal of the Linnean Society, 2019, 127, 278–291VARIATION IN THERMAL BIOLOGY OF LIZARDS 283
based on the Kaiser–Guttman criterion (eigenvalues Table 2. Component loadings of habitat traits observed
~1; Jackson, 1993). Variables with a loading of ≥ 0.4 on two orthogonally rotated principal components (PC1
were considered to contribute to a component. To test and PC2)
species differences, one-way ANOVAs were conducted
on axis scores from the first two axes. Habitat trait PC1 PC2
Thermal tolerance measures (CTmin, CTmax
Canopy cover (%) 0.42* −0.25
and TTB) adhered to assumptions of normality and
homogeneity of variance. We used linear models Rock cover (%) 0.37 0.60*
(ANCOVA) to determine thermal tolerance variation Crevice width (mm) −0.50* 0.24
between populations (within species at high and Soil cover (%) 0.37 −0.55*
Mid-storey cover (%) −0.33 −0.45*
Downloaded from https://academic.oup.com/biolinnean/article-abstract/127/2/278/5479372 by guest on 23 May 2019
low elevations, and between species) and sexes for
CTmin, with SVL as a covariate. Tukey’s HSD tests Ground cover (%) −0.44* −0.13
determined post hoc differences. For analyses of sprint Percentage of variance explained 46.2 23.9
speed, data were log10-transformed following violation Total variance explained 70.1 –
of assumptions. Sprint speeds were compared between
sexes and all Liopholis populations using a two-way *Traits with a factor loading of ≥ 0.4 were considered to contribute to a
component.
repeated-measures ANCOVA. This was conducted in
the package ‘lme4’, with population and sex as non- P < 0.001) and PC2 (F2,47 = 5.77, P < 0.01). Liopholis
repeated-measures factors, temperature treatment montana and L. whitii differed from L. guthega
as a repeated-measures factor, SVL as a covariate, (P < 0.001) for habitat traits on PC1 (Fig. 2). Liopholis
and skink individual as a random effect to account whitii and L. montana differed for habitat traits on
for use of same skink in multiple treatments. Least PC2 (P < 0.01).
squared means comparisons (‘lsmeans’) were used to
determine post hoc differences. It was not necessary
to control for animal size because SVL did not affect
the critical thermal tolerance limits or the effect of Thermal tolerance
sprint speed in above analyses (P > 0.05 in all cases; The CTmin differed between populations
see Results). (F 5,70 = 27.743, P < 0.001; Fig. 3), but not between
males and gravid females (F 2,70 = 1.651, P = 0.199)
or their interaction (F 4,70 = 1.071, P = 0.377), or
RESULTS with SVL (F1,70 = 1.42, P = 0.237). Liopholis guthega
collected from 1860 m had the lowest mean CTmin
Habitat and distribution (1.17 ± 0.134 °C), which was significantly lower than
Liopholis montana and L. guthega were found in CTmin (2.69 ± 0.235 °C) of L. guthega collected at
closest proximity, with populations of the two located 1620 m (P = 0.021) and all other Liopholis populations
within 2 km of each other (Fig. 1). A population of (Supporting Information, Table S1). Liopholis whitti
L. montana was located at a site higher in elevation collected from 1180 m had the highest mean CTmin
(1660 m) than the lowest recorded L. guthega site at (5.74 ± 0.416 °C), significantly higher than L. whitii
~1620 m. We did not find L. montana and L. whitii collected from 920 m (P < 0.001) and all other
in close proximity along the sampled gradient. The Liopholis populations (Supporting Information,
highest population of L. whitii occurred at 1180 m, and Table S1). We found significant differences in CTmax
the lowest L. montana at 1370 m. between populations (F5,32 = 4.011, P < 0.001; Fig. 3),
The principal components analysis containing but not with SVL (F1,32 = 0.431, P = 0.516). Population
habitat variables revealed two factors that explained a differences were driven by the L. whitii (1180 m),
moderate amount of variation (70.1% of the variance; which had a much lower CTmax than L. guthega
Table 2). Principal component 1 explained 46.2% of the (P = 0.017) and L. montana (P = 0.006) at their highest
variance and loaded towards increased canopy cover, populations (Supporting Information, Table S1). In
reduced ground cover and crevice width. Thus, PC1 accordance with these results, tolerance breadth (TTB)
mostly represents traits associated with the presence differed between populations (F5,32 = 18.51, P < 0.001).
of canopy, in addition to some traits of rock and other Intraspecific differences were found in L. guthega,
vegetation structure. Principal component 2 explained which had a wider tolerance breadth at 1860 m than
23.9% of the variance and loaded strongly towards at 1620 m (P = 0.017; Supporting Information, Table
increasing rock cover and reduced mid-storey and soil S1). Liopholis whitii at 1180 m had the narrowest
cover. When examining habitat differences between tolerance breadth, significantly narrower than the
the species, we found significant differences between other L. whitii population at 920 m (P < 0.001) and all
species for habitat traits loading onto PC1 (F2,47 = 51.8, other populations (Supporting Information, Table S1).
© 2019 The Linnean Society of London, Biological Journal of the Linnean Society, 2019, 127, 278–291284 A. F. SENIOR ET AL.
Maximal sprint speed was identified between 1600 and 1700 m. There are no
There were significant differences between lizards large-scale physical barriers to dispersal (such as deep
run at different temperatures and between lizards valleys) within this zone. Other environmental factors
from different populations, but not between sexes or that change over small scales, such as vegetation type,
with SVL (Table 3). Liopholis montana from 1660 geological and geomorphological features (distribution
m performed the most poorly (Fig. 4; Supporting of rocky outcrops and alpine bogs) and fire history, may
Information, Table S2), running more slowly than all play a role in isolation of populations (Atkins, 2018).
the populations at one or more of the temperature A specific area where L. montana and L. whitii might
treatments. At 25 and 30 °C, L. whitii (1180 m) ran interact was not detected in this survey, but we expect
more slowly than L. guthega (1860 m). At 30 °C, a zone of overlap to occur between 1200 and 1400 m
Downloaded from https://academic.oup.com/biolinnean/article-abstract/127/2/278/5479372 by guest on 23 May 2019
this population of L. whitii displayed a reduction in based on the populations located during sampling.
performance compared with several other Liopholis Further surveys might identify these two species in
populations (Fig. 4; Supporting Information, Table S2). closer proximity in the Kosciuszko region. Previous
Thermal sensitivity of sprint speed differed with work in other localities has reported the presence
population in some species. In L. guthega (Fig. 4A), of L. whitii and L. montana populations within 200
sprint speed increased significantly between 15 and m of each other (Scabby Range, ACT; W. Osborne,
25 °C (t138 = −6.639, P < 0.001) but not between 25 and unpublished data), and L. montana occurring as low
30 °C (t138 = −2.356, P = 0.052) in the high population. as 900 m (Victoria; Donnellan et al., 2002), suggesting
The low population followed the same pattern, with the potential for interaction between these two species
sprint speed increasing significantly between 15 and in other localities.
25 °C (t140 = −2.849, P = 0.01) but not between 25 and Vegetation structure around burrows and crevice
30 °C (t140 = −2.116, P = 0.090). For L. montana (Fig. shelter sites differed between the species, in that
4B) collected from 1660 m, sprint speed increased L. guthega occurred in quadrats with less canopy
between 15 and 25 °C (t138 = −4.588, P = < 0.001) but not cover compared with the other two species. Liopholis
between 25 and 30 °C (t138 = −1.269, P = 0.415). Sprint guthega has been recorded in sub-alpine woodland
speed increased significantly between 15 and 25 °C where snow gum (Eucalyptus pauciflora) are present
(t138 = −3.919, P < 0.05) and 25 and 30 °C (t138 = −2.861, (Atkins, 2018). In the present study, L. guthega was
P = 0.013) in the lower L. montana population. At found in sites with E. pauciflora, but the majority
the highest L. whitii population, sprint speed was of individuals were collected away from canopy
insensitive to heat treatment and did not change cover. Increased access to insolation away from
significantly between 15 and 25 °C (t 138 = −2.257, tree canopies might be particularly important for
P = 0.066) and 25 and 30 °C (t140 = 2.059, P = 0.102; Fig. L. guthega, which under current climatic conditions
4C). At the lower population, sprint speed increased has the lowest number of days per season to feed,
between 15 and 25 °C (t138 = −6.943, P < 0.001) but not mate and give birth before temperatures drop, snow
between 25 and 30 °C (t138 = −1.550, P = 0.271). re-falls and torpor begins. Analysis revealed that
L. guthega habitat tended to have smaller crevice
widths, reflecting characteristics of granite boulders
present at the site compared with larger rock slabs
DISCUSSION in L. montana and L. whitii sites. There was also
We have demonstrated that some aspects of Liopholis less groundcover around L. guthega shelter sites.
thermal physiology differ over a landscape scale Patterns of interspecific differences in variables
and that this appears to be independent of species loading onto PC2 were less clear, but analysis
boundaries. The two higher elevation species are captured some differences between L. montana and
the most genetically similar, having separated from L. whitii, with a number of L. montana occurring
L. whitii in the late Miocene to Pliocene (2–5 Mya) in areas with high rock cover. There is a degree of
during cooling and drying of the Australian continent variance not explained by the principal components
(Donnellan et al., 2002; Chapple et al., 2005). Despite analysis (29.9%), suggesting that other habitat
this evolutionary history, these two species did not variables not captured in this study might also be
show conserved thermal physiology compared with important between species.
L. whitii. There was overlap between thermal biology The main habitat differences captured between
of all three species at low to mid-elevations, suggesting L. guthega and its relatives were floristic or related to
that temperature alone is not the environmental vegetation structure. This is to be expected given that
factor limiting species distributions. The three L. guthega largely occupies the vegetatively distinct
species exhibit a distribution where one species alpine zone. Under worst-case climate scenarios, the
replaces another across an elevational cline. A zone entire Australian alpine zone will be replaced by
of replacement between L. guthega and L. montana subalpine vegetation by 2050, reducing habitat above
© 2019 The Linnean Society of London, Biological Journal of the Linnean Society, 2019, 127, 278–291VARIATION IN THERMAL BIOLOGY OF LIZARDS 285
Downloaded from https://academic.oup.com/biolinnean/article-abstract/127/2/278/5479372 by guest on 23 May 2019
Figure 2. Scatter plot of first and second principal components (PC1 and PC2) of habitat traits. Traits were associated
with the presence of trees, decreasing crevice width and ground cover (PC1, 46.2% of variance explained), and increasing
rock cover, decreasing soil cover and mid-storey cover (PC2, 23.9% of variance explained). Symbols: blue squares, Liopholis
guthega (N = 20); red triangles, Liopholis montana (N = 17); grey circles, Liopholis whitii (N = 13). Polygons enclose all
individuals from each of the three species. Photographs show indicative habitat for L. guthega (A), L. montana (B) and
L. whitii (C). All photographs were taken by A.F.S.
the treeline and altering seasonal snow cover (Green changes could lead to distribution shifts within the
et al., 1992; Hennessy et al., 2003; Pickering, 2007). species group. At the observed zone of overlap between
Additional changes in vegetation cover may occur from L. guthega and L. montana, the species were allopatric.
increased exotic plant invasions into higher elevation Interspecific competition is a likely mechanism
(Alexander et al., 2016) and upland movement of feral maintaining elevational partitioning in a range of taxa
and native herbivores (Hughes, 2003). Vegetative (Barve & Dhondt, 2017). Investigating competitive
© 2019 The Linnean Society of London, Biological Journal of the Linnean Society, 2019, 127, 278–291286 A. F. SENIOR ET AL.
behavioural differences in this species group will elevations before losing the ability to right themselves.
shed light on whether one species is likely to exclude This suggests that cold alpine temperatures
another in instances of secondary contact. experienced at this elevation have driven a specific
Surprisingly little has been done to examine adaptation or a plastic response affecting CTmin. Low-
variability in CTmin with elevation (Spellerberg, elevation L. guthega were more similar in thermal
1972; Hertz & Nevo, 1981; Gvoždík & Castilla, 2001; tolerance to members of the other Liopholis species
Caldwell et al., 2015; Huang & Tu, 2008b), particularly than to their high-elevation congeners, highlighting
across the landscape scale, despite the theoretical the lability of this trait within species across even
prediction of lability in this trait. When CTmin was small spatial scales. This population of L. guthega also
compared between populations, we found a notable had the widest tolerance breadth, probably in response
Downloaded from https://academic.oup.com/biolinnean/article-abstract/127/2/278/5479372 by guest on 23 May 2019
intraspecific difference between L. guthega from to the range of temperatures experienced at high
the highest site (1860 m) and L. guthega from 1620 elevations. Thermal tolerance range tends to widen in
m. The high-elevation animals were able to tolerate animals experiencing more variability in the thermal
colder temperatures than their congeners from lower environment (Gaston & Chown, 1999; Addo-Bediako
et al., 2000; Beck et al., 2016).
Increases in body temperature from 15 to 30 °C
resulted in variable differences in sprint ability,
which are likely to be population specific, rather than
directly linked to species or elevation. In general,
most lizards ran faster between 15 and 25 °C, but
fewer populations ran faster between 25 and 30 °C.
Population differences in sprint speed often do not
follow differences in critical thermal limits (Stork,
2012) and may be more closely linked to non-climate-
related variables, such as predation pressure. At 15 °C,
L. guthega from both populations were similarly slow
compared with lowland species, suggesting that this
alpine–subalpine species does not have a locomotive
advantage at this temperature. This reflects field
observations of all species, none of which were found
outside their shelter sites at temperatures < 15 °C.
The thermal tolerance limits of L. whitii from the
high-elevation population were very narrow and
cannot be explained entirely by adaptive strategies
to suit environmental conditions. The population had
the lowest measured CTmax and was the least able
to tolerate high temperatures. Correspondingly, sprint
Figure 3. Mean ± SE critical thermal tolerance [maximum speed for this population did not change between
(CTmax) and minimum (CTmin)] for Liopholis guthega heat treatments, in contrast to the overall pattern
(blue squares), Liopholis montana (red trianges) and exhibited by L. whitii from 920 m and the other
Liopholis whitii (grey circles). Elevation is in metres above species. Temperature logger data suggested that
sea level. Different letters denote statistical difference maximal environmental temperatures were hotter at
between populations. the high-elevation L. whitii site (during winter and
Table 3. ANCOVA comparing Liopholis population sprint speed at three ecologically relevant temperatures: 15, 25 and
30 °C
Source SS d.f. MS F-ratio P-value
Site 2.39 5 0.48 10.65 < 0.001*
Treatment 9.50 2 4.75 106.05 < 0.001*
Sex 0.14 1 0.14 3.12 0.08
Site × treatment 2.35 10 0.23 5.24 < 0.001*
Snout–vent length 0.05 1 0.05 1.09 0.30
*Statistical significance (P < 0.05).
© 2019 The Linnean Society of London, Biological Journal of the Linnean Society, 2019, 127, 278–291VARIATION IN THERMAL BIOLOGY OF LIZARDS 287
Downloaded from https://academic.oup.com/biolinnean/article-abstract/127/2/278/5479372 by guest on 23 May 2019
Figure 4. Maximal sprint speed in meters per second (mean ± SE) at three temperature treatments for high- (black) and
low-elevation (dark blue) populations of Liopholis guthega (A), Liopholis montana (B) and Liopholis whitii (C).
spring) than at all other sites (Supporting Information, site differences experienced during winter and spring
Table S3). We were unable to collect environmental might continue throughout the year. A low CTmax
temperature data during summer but suggest that the in response to high environmental temperatures
© 2019 The Linnean Society of London, Biological Journal of the Linnean Society, 2019, 127, 278–291288 A. F. SENIOR ET AL.
is initially a counterintuitive pattern, which might The effects of warming temperatures under future
be explained by local environmental conditions. climate scenarios have been modelled for L. guthega
Likewise, Llewelyn et al. (2016, 2017) found a negative (Atkins, 2018). It was found that the species will
relationship between CTmax and environmental reach minimal activity thresholds more frequently
temperature in the skink species Lampropholis and experience a reduced torpor period, resulting in
coggeri. Skinks from hotter environments tolerated an increase in potential activity time (Atkins, 2018).
lower temperatures than conspecifics from cooler Comparable upper thermal limits in L. guthega across
environments and chose cooler microenvironments its elevational extent found in the present study support
in which to thermoregulate (Llewellyn et al., 2017). the idea that this species as a whole might experience
We might expect that high-elevation L. whitii are positive effects of climate warming. The adaptive
Downloaded from https://academic.oup.com/biolinnean/article-abstract/127/2/278/5479372 by guest on 23 May 2019
choosing cooler microenvironments within the hotter capacity of the species will also be determined by
macro-environment and that their physiology has their capacity to adjust feeding, thermoregulatory and
acclimatized to these lower temperatures (Llewellyn competitive behaviour in response to environmental
et al., 2017). However, these animals were also least change (Kearney et al., 2009; Atkins et al. 2017;
able to tolerate cold temperatures, with individuals Caldwell et al., 2017; Camacho et al., 2018).
from this population exhibiting a CTmin of between 4.4
and 9.1 °C. This was significantly higher than L. whitii
from the lower population (2.0–5.2 °C). The minimal Conclusions
temperatures for this site in the month lizards were Trait comparisons in the Liopholis group have revealed
collected was 4.8 °C. Environmental temperatures a pattern of thermal tolerances that is likely to be the
at the site of the lower L. whitii population had result of localized adaptation, physiological plasticity,
consistently warmer minima. This pattern, or lack or both. We suggest that the elevation replacement
thereof, indicates some mismatch between critical distribution in this group might be influenced
thermal minima and environmental temperatures, somewhat by thermal tolerance constraints, but that
potentially a result of non-adaptive evolutionary behavioural and small-scale habitat differences might
processes occurring in the high-elevation population, also play a role. Like Caldwell et al. (2015), we cannot
which is nearing the limit of the elevational extent identify whether patterns in thermal tolerances are
of the species. Further investigation of microhabitat the result of heritable genetic differences or plasticity
temperature variability at this site would strengthen in response to environmental conditions. We share
our understanding of the conditions that might be the view that common garden experiments would be
influencing the narrow critical thermal limits of this valuable in teasing out these effects but acknowledge
L. whitii population. the challenge of conducting such work on rare species
Upper thermal limits were similar for all Liopholis with conservation status, such as those in the present
populations except the high-elevation L. whitii. We study. More broadly, our findings are important in
suggest that this trait conservatism is the result of understanding the pattern of species distributions and
similar maximal environmental temperatures during variability in thermal tolerances between species, but
the activity season, rather than the Bogert effect, where also within species across small geographical scales.
buffering of CTmax by behavioural thermoregulation
could result in similar upper tolerances (Muñoz et al.,
2014). However, further environmental temperature
ACKNOWLEDGEMENTS
data would strengthen this assertion. Studies
investigating the effect of elevation on lizard CTmax We acknowledge First Nations Australians, upon
have reported mixed results, with some intraspecific whose land this research was undertaken. We thank
studies reporting decreases in CTmax (Hertz, 1979, the anonymous reviewers who greatly improved the
1981; Hertz et al., 1979), whereas others have reported manuscript. We thank Chris Johnstone for advice
no pattern (Gvoždík & Castilla, 2001). In a review and assistance with statistical analysis, and Rob
of lizard thermal trait variation, Clussela-Trullas & Hayes, Chris Senior, Mark Feeney, Emily Drummond,
Chown (2014) highlighted the lack of consistency in Katelyn Hamilton, Simon Tedder, Lachlan Wilmott
trait responses. We suggest that spatial scale is an and Brook Sykes for assistance in animal collection
important consideration when making generalizations and husbandry, in addition to volunteers from the
about the effect of elevation on lizard upper thermal Chapple laboratory. This work was supported by the
limits. Other multispecies comparisons reporting Holsworth Research Endowment (grant awarded to
differences in CTmax were conducted over much wider A.F.S.) and an Australian Research Council discovery
geographical scales than the present study (Huang & project grant (DP150102900, grant to D.G.C.,
Tu, 2008a; Caldwell et al., 2015). M.M.G. and G.M.W.).
© 2019 The Linnean Society of London, Biological Journal of the Linnean Society, 2019, 127, 278–291VARIATION IN THERMAL BIOLOGY OF LIZARDS 289
Author contributions Beck J, Liedtke HC, Widler S, Altermatt F, Loader SP,
Hagmann R, Lang S, Fiedler K. 2016. Patterns or
A.F.S. carried out fieldwork, laboratory experiments
mechanisms? Bergmann’s and Rapoport’s rule in moths
and data analysis and led the design of the study
along an elevational gradient. Community Ecology 17:
and the writing of the manuscript. B.B.M.W., D.G.C.,
137–148.
N.C. and Z.S.A. contributed to the design of the study
Böhm M, Cook D, Ma H, Davidson AD, García A, Tapley B,
and drafting of the manuscript. M.S., M.M.G. and Pearce-Kelly P, Carr J. 2016. Hot and bothered: using trait-
G.M.W. contributed to the drafting of the manuscript. based approaches to assess climate change vulnerability in
All authors gave final approval for publication. reptiles. Biological Conservation 204: 32–41.
Camacho A, Rusch T, Ray G, Telemeco RS, Rodrigues MT,
Angilletta MJ. 2018. Measuring behavioral thermal
Downloaded from https://academic.oup.com/biolinnean/article-abstract/127/2/278/5479372 by guest on 23 May 2019
Ethical statement
tolerance to address hot topics in ecology, evolution, and
Research was c o n du c te d i n a c c o r da n c e w i t h conservation. Journal of Thermal Biology 73: 71–79.
appropriate collection and research permits (New Caldwell AJ, While GM, Beeton NJ, Wapstra E. 2015.
South Wales: SL101798) and was approved by the Potential for thermal tolerance to mediate climate change
Monash University animal welfare committee effects on three members of a cool temperate lizard genus,
(BSCI/2016/24). Niveoscincus. Journal of Thermal Biology 52: 14–23.
Caldwell AJ, While GM, Wapstra E. 2017. Plasticity of
thermoregulatory behaviour in response to the thermal
Conflict of interest environment by widespread and highland reptile species.
We have no conflict of interest. Animal Behaviour 132: 217–227.
Chapple DG, Keogh JS. 2004. Parallel adaptive radiations
in arid and temperate Australia: molecular phylogeography
and systematics of the Egernia whitii (Lacertilia: Scincidae)
REFERENCES
species group. Biological Journal of the Linnean Society 83:
Addo-Bediako A, Chown SL, Gaston KJ. 2000. Thermal 157–173.
tolerance, climatic variability and latitude. Proceedings of Chapple DG, Keogh JS. Hutchinson MN. 2005. Substantial
the Royal Society B: Biological Sciences 267: 739–745. genetic substructuring in southeastern and alpine Australia
Alexander JM, Lembrechts JJ, Cavieres LA, Daehler C, revealed by molecular phylogeography of the Egernia whitii
Haider S, Kueffer C, Liu G, McDougall K, Milbau A, (Lacertilia: Scincidae) species group. Molecular Ecology 14:
Pauchard A, Rew LJ, Seipel T. 2016. Plant invasions into 1279–1292.
mountains and alpine ecosystems: current status and future Clemann N, Chapple DC, Hutchinson M, Robertson P,
challenges. Alpine Botany 126: 89–103. Gillespie G, Michael D, Melville J. 2018. Liopholis
Araújo MB, Ferri-Yáñez F, Bozinovic F, Marquet PA, guthega. The IUCN Red List of Threatened Species
Valladares F, Chown SL. 2013. Heat freezes niche 2 0 1 8 : e. T 1 0 9 4 7 7 9 5 3 A 1 0 9 4 7 8 4 4 4 . Av a i l a b l e a t :
evolution. Ecology Letters 16: 1206–1219. h t t p : / / d x . d o i . o r g / 1 0 . 2 3 0 5 / I U C N. U K . 2 0 1 8 - 1 . R LT S.
Artacho P, Saravia J, Ferrandiere BD, Perret S, T109477953A109478444.en. Accessed 6 August 2018.
Le Galliard JF. 2015. Quantification of correlational Clemann N, Hutchinson M, Robertson P, Chapple DC,
selection on thermal physiology, thermoregulatory behavior, Gillespie G, Melville J, Michael D. 2018. Liopholis
and energy metabolism in lizards. Ecology and Evolution 5: montana. The IUCN Red List of Threatened Species
3600–3609. 2 0 1 8 : e. T 1 0 9 4 7 8 5 2 2 A 1 0 9 4 7 8 5 2 9 . Av a i l a b l e a t :
Atkins ZS. 2018. Conservation of the Guthega skink, Liopholis h t t p : / / d x . d o i . o r g / 1 0 . 2 3 0 5 / I U C N. U K . 2 0 1 8 - 1 . R LT S.
guthega. PhD Thesis. Melbourne: La Trobe University. T109478522A109478529.en. Accessed 6 August 2018.
Atkins ZS, Clemann N, Schroder M, Chapple DG, Clusella-Trullas S, Chown SL. 2014. Lizard thermal trait
Davis NE, Robinson WA, Wainer J, Robert KA. 2017. variation at multiple scales: a review. Journal of Comparative
Consistent temporal variation in the diet of an endangered Physiology B 184: 5–21.
alpine lizard across two south-eastern Australian sky- Crowley SR. 1985. Thermal sensitivity of sprint-running in
islands. Austral Ecology 43: 339–351. the lizard Sceloporus undulatus: support for a conservative
Atlas of Living Australia. Website at: https://biocache. view of thermal physiology. Oecologia 66: 219–225.
ala.org.au/occurrences/search?q=liopholis%20whitii#tab_ Dirnböck T, Essl F, Rabitsh W. 2011. Disproportional risk for
mapView. Accessed 2 September 2016. habitat loss of high-altitude endemic species under climate
Barve S, Dhont AA. 2017. Elevational replacement of two change. Global Change Biology 17: 990–996.
Himalayan titmice: interspecific competition or habitat Donnellan SC, Hutchinson MN, Dempsey P, Osborne WS.
preference? Journal of Avian Biology 48: 1189–1194. 2002. Systematics of the Egernia whitii species group
Bastianelli G, Wintle BA, Martin EH, Seoane J, Laiolo P. (Lacertilia: Scincidae) in south-eastern Australia. Australian
2017. Species partitioning in a temperate mountain chain: Journal of Zoology 50: 439–459
segregation by habitat vs. interspecific competition. Ecology Gaston KJ, Chown SL. 1999. Elevation and climatic
and Evolution 7: 2685–2696. tolerance: a test using dung beetles. Oikos 86: 584–590.
© 2019 The Linnean Society of London, Biological Journal of the Linnean Society, 2019, 127, 278–291290 A. F. SENIOR ET AL.
Gifford ME, Kozak KH. 2012. Islands in the sky or squeezed Llewelyn J, Macdonald SL, Hatcher A, Mortiz C,
at the top? Ecological causes of elevational range limits in Phillips BL. 2016. Intraspecific variation in climate-
montane salamanders. Ecography 35: 193–203. relevant traits in a tropical rainforest lizard. Diversity and
Green K, Mansergh I, Osborne W. 1992. The fauna of the Distributions 22: 1000–1012.
Australian Alps: conservation and management. Review Llewelyn J, Macdonald SL, Hatcher A, Mortiz C,
Géographie Alpine 2: 381–407. Phillips B. 2017. Thermoregulatory behaviour explains
Gvoždík L, Castilla AM. 2001. A comparative study of countergradient variation in the upper thermal limit of a
preferred body temperatures and critical thermal tolerance rainforest skink. Oikos 126: 748–757.
limits among populations of Zootoca vivipara (Squamata: Llewelyn J, Macdonald SL, Mortiz C, Martin F, Hatcher A,
Lacertidae) along an altitudinal gradient. Journal of Phillips BL. 2018. Adjusting to climate: acclimation,
Herpetology 35: 486–492. adaptation and developmental plasticity in physiological
Downloaded from https://academic.oup.com/biolinnean/article-abstract/127/2/278/5479372 by guest on 23 May 2019
Hennessy K, Whetton P, Smith I, Bathols J, Hutchinson M, traits of a tropical rainforest lizard. Integrative Zoology 13:
Sharples J. 2003. The impact of climate change on snow 411–427.
conditions in mainland Australia. Aspendale: CSIRO Lutterschmidt WI, Hutchison VH. 1997a. The critical
Atmospheric Research. thermal maximum: data to support the onset of spasms as
Hertz PE. 1979. Sensitivity to high temperature in three the definitive end point. Canadian Journal of Zoology 75:
west grass anoles (Sauria, Iguanidae), with a review of heat 1553–1560.
sensitivity in the genus Anolis. Comparative Biochemistry Lutterschmidt WI, Hutchison VH. 1997b. The critical
and Physiology 63A: 217–222. thermal maximum: history and critique. Canadian Journal
Hertz PE. 1981. Adaptation to altitude in two West Indian of Zoology 75: 1561–1574.
anoles (Reptilia: Iguanidae): field thermal biology and McCain CM, Colwell RK. 2011. Assessing the threat to
physiology. Journal of Zoology 195: 25–37. montane biodiversity from discordant shifts in temperature
Hertz PE. Nevo E. 1981. Summer thermal biology of four and precipitation in a changing climate. Ecology Letters 14:
agamid species in Israel. Israel Journal of Zoology 30: 1236–1245.
190–210. Melville J, Swain R. 1999. Home-range characteristic of an
Herrando-Pérez S, Ferri-Yáñez F, Monasterio C, alpine lizard, Niveoscincus microlepidotus (Scincidae), on
Beukema W, Gomes V, Belliure J, Chown SL, Mt Wellington, southern Tasmania. Wildlife Research 26:
Vieites DR, Araújo MB. 2018. Intraspecific variation in 263–270.
lizard heat tolerance alters estimates of climate impact. Moritz C, Langham G, Kearney M, Krockenberger A,
Journal of Animal Ecology 88: 247–257. VanDerWal J, Williams S. 2012. Integrating phylogeography
Huang SP, Hsu Y, Tu MC. 2006. Thermal tolerance and and physiology reveals divergence of thermal traits between
altitudinal distribution of two Sphenomorphus lizards in central and peripheral lineages of tropical rainforest lizards.
Taiwan. Journal of Thermal Biology 31: 378–385. Philosophical Transactions of the Royal Society B: Biological
Huang SP, Tu MC. 2008a. Heat tolerance and altitudinal Sciences 367: 1680–1687.
distribution of a mountainous lizard, Takydromus Muñoz MM, Stimola MA, Algar AC, Conover A,
hsuehshanensis, in Taiwan. Journal of Thermal Biology 33: Rodriguez AJ, Landestoy MA, Bakken GS, Losos JB.
48–56. 2014. Evolutionary stasis and lability in thermal physiology
Huang SP, Tu MC. 2008b. Cold tolerance and altitudinal in a group of tropical lizards. Proceedings of the Royal Society
distribution of Takydromus lizards in Taiwan. Zoological B: Biological Sciences 281: 20132433.
Studies 47: 438–444. Oyen KJ, Giri S, Dillon ME. 2016. Altitudinal variation
Huey RB, Stevenson RD. 1979. Integrating thermal in bumblebee (Bombus) critical thermal limits. Journal of
physiology and ecology of ectotherms: a discussion of Thermal Biology 59: 52–57.
approaches. American Zoology 19: 357–366. Pickering CM. 2007. Climate change and other threats in
Hughes L. 2003. Climate change and Australia: trends, the Australian Alps. In: Taylor M, Figgis P, eds. Protected
projections and impacts. Austral Ecology 28: 423–443. areas: buffering nature against climate change. Proceedings
Jackson DA. 1993. Stopping rules in principal components of a WWF and IUCN World Commission on Protected
analysis: a comparison of heuristical and statistical Areas Symposium, 18–19 June 2007, Canberra, Sydney, pp.
approaches. Ecology 74: 2204–2214. 28–34.
Kearney M, Shine R, Porter WP. 2009. The potential for Pontes-da-Silva E, Magnusson WE, Sinervo B, Caetano GH,
behavioral thermoregulation to buffer “cold-blooded” animals Miles DB, Colli GR, Diele-Viegas LM, Fenker J, Santos JC,
against climate warming. Proceedings of the National Academy Werneck FP. 2018. Extinction risks forced by climate change
of Sciences of the United States of America 106: 3835–3840. and intraspecific variation in the thermal physiology of a
Kellermann V, Overgaard J, Hoffmann AA, Flojgaard C, tropical lizard. Journal of Thermal Biology 73: 50–60.
Svenning JC, Loeschcke V. 2012. Upper thermal limits of R Core Team. 2018. R: A language and environment for
Drosophila are linked to species distributions and strongly statistical computing. Vienna, Austria: R Foundation for
constrained phylogenetically. Proceedings of the National Statistical Computing. URL https://www.R-project.org/.
Academy of Sciences of the United States of America 109: Rodríguez-Castañeda G, MacVean C, Cardona C, Hof AR.
16228–16233. 2017. What limits the distribution of Liriomyza huidobrensis
© 2019 The Linnean Society of London, Biological Journal of the Linnean Society, 2019, 127, 278–291VARIATION IN THERMAL BIOLOGY OF LIZARDS 291
and its congener Liriomyza sativae in their native niche: when the mountains of Arkansas. Environmental Entomology 41:
temperature and competition affect species’ distribution 1631–1637.
range in Guatemala. Journal of Insect Science 17: 1–13. Sun BJ, Tang WQ, Zeng ZG, Du WG. 2014. The seasonal
Sheldon KS, Tewksbury JJ. 2014. The impact of seasonality acclimatisation of locomotion in a terrestrial reptile,
in temperature on thermal tolerance and elevational range Plestiodon chinensis (Scincidae). Asian Herpetological
size. Ecology 95: 2134–2143. Research 5: 197–203.
Sinervo B, Mendez-De-La-Cruz F, Miles DB, Heulin B, Winter M, Fiedler W, Hochachka WM, Koehncke A,
Bastiaans E, Villagrán-Santa Cruz M, Lara-Resendiz R, Meiri S, De la Riva I. 2016. Patterns and biases in climate
Martínez-Méndez N, Calderón-Espinosa ML, Meza- change research on amphibians and reptiles: a systematic
Lázaro RN. 2010. Erosion of lizard diversity by climate review. Royal Society Open Science 3: 160158.
change and altered thermal niches. Science 328: 894–899. Wilson SK, Swan G. 2010. A complete guide to reptiles of
Downloaded from https://academic.oup.com/biolinnean/article-abstract/127/2/278/5479372 by guest on 23 May 2019
Spellerberg IF. 1972. Temperature tolerances of southeast Australia, 3rd edn. Sydney: New Holland Publishers.
Australian reptiles examined in relation to reptile Wright AN, Schwartz MW, Hijmans RJ, Shaffer HB. 2016.
thermoregulatory behaviour and distribution. Oecologia 9: 23–46. Advances in climate models from CMIP3 to CMIP5 do not
Stork R. 2012. Intraspecific variation in the thermal biology change predictions of future habitat suitability for California
of Rabidosa rabida (Araneae: Lycosidae) (Walckenaer) from reptiles and amphibians. Climatic Change 134: 579–591.
SUPPORTING INFORMATION
Additional Supporting Information may be found in the online version of this article at the publisher's web-site:
Table S1. Adjusted P-value of the post hoc pairwise multiple comparisons procedure (Tukey's HSD tests) applied
to the one-way ANCOVA for comparisons of critical thermal limits (CTmin and CTmax) and tolerance breadth
(TTB) in Liopholis guthega (1860 and 1620 m), Liopholis montana (1660 and 1370 m) and Liopholis whitii (1180
and 920 m). Statistical significance (P < 0.05) is highlighted in bold.
Table S2. Adjusted P-value of the post hoc pairwise multiple comparisons procedure (least squared means
comparisons) applied to the two-way repeated-measures ANCOVA for comparisons of sprint speed at three
ecologically relevant temperatures in Liopholis guthega (1860 and 1620m), Liopholis montana (1660 and 1370 m)
and Liopholis whitii (1180 and 920 m). Statistical significance (P < 0.05) is highlighted in bold.
Table S3. Monthly environmental temperatures (in degrees Celsius) as measured by Maxim Thermochron
iButtons during winter and spring at different elevations (in metres above sea level). Sites covered in snow
show only a small difference or no difference in maximal and minimal temperatures and are highlighted in bold.
iButtons at 1180 and 920 m failed in November, and data could not be retrieved.
© 2019 The Linnean Society of London, Biological Journal of the Linnean Society, 2019, 127, 278–291You can also read