Vattenfall Investor Presentation - Handelsbanken speed-dating 11 November 2020 Johan Gyllenhoff, VP Finance & Group Treasury Johan Sahlqvist, Head ...

Page created by Kevin Sandoval
 
CONTINUE READING
Vattenfall Investor Presentation - Handelsbanken speed-dating 11 November 2020 Johan Gyllenhoff, VP Finance & Group Treasury Johan Sahlqvist, Head ...
Vattenfall Investor Presentation
                Handelsbanken speed-dating
                    11 November 2020

        Johan Gyllenhoff, VP Finance & Group Treasury
          Johan Sahlqvist, Head of Investor Relations
Vattenfall Investor Presentation - Handelsbanken speed-dating 11 November 2020 Johan Gyllenhoff, VP Finance & Group Treasury Johan Sahlqvist, Head ...
This is Vattenfall                                                   Activities in the Value Chain       Active       Inactive

                                                                     Upstream   Production     Transmission       Distribution          Trading        Retail    Services

                                                                      Main markets                                     CO2 emissions & Renewable
In Brief                                     6.9 Million              • Sweden                                         capacity
                                             Electricity Customers                                                                 90                             3,500
• Vattenfall is a leading European                                    • Germany
                                                                                                                                                                  3,000
  energy company                                                      • Netherlands
                                             1.9 Million                                                                                                          2,500

                                                                                                                         Mtonnes
                                                                      • Denmark                                                    60
• We want to make fossil-free living         Heat Customers                                                                                                       2,000

                                                                                                                                                                          MW
  possible within one generation                                      • United Kingdom                                                                            1,500
                                                                                                                                   30
                                             3.3 Million                                                                                                          1,000
• We are driving the transition to a more    Electricity                                                                                                          500
  sustainable energy system through growth   Network Customers                                                                      0                             0
  in renewable production and climate
  smart energy solutions for our customers   2.5 Million
                                             Gas Customers                                                                              Installed renewable capacity (MW)
• 100 per cent owned by the Swedish                                                                                                     CO2 emissions (Mtonnes)
  State                                      19,814                   Electricity generation                           EBITDA breakdown by
                                             Employees
• Our long-term credit ratings are BBB+                               breakdown by technology, 2019                    segment, 2019
  stable outlook by S&P and A3 negative                                                                                                           Customers & Solutions
                                                                                                                      Distribution
  outlook by Moody’s                                                                  7%                                                          8%
                                                                                                                                        21%

                                                                                24%             41%                                         SEK
                                                                                       130.3                                                           35%
                                                                                                                       Heat 13%            42.4 bn
                                                                                       TWh

                                                                                                                                          24%              Power Generation
                                                                                      27%
                                                                                                                                        Wind

                                                                                                                                                                          2
Vattenfall Investor Presentation - Handelsbanken speed-dating 11 November 2020 Johan Gyllenhoff, VP Finance & Group Treasury Johan Sahlqvist, Head ...
Operating segment overview FY 2019
Operating segments                                                   Customers & Solutions                                 Power generation
We report our operations broken down by the                          Responsible for sales of electricity, gas and         Responsible for Vattenfall’s hydro and nuclear
Group’s operating segments: Customers &                              energy services in all of Vattenfall’s markets        power operations, maintenance services
Solutions, Power Generation, Wind, Heat, and                         • One of the market leaders in Sweden with nearly     business, and optimisation and trading
Distribution. The operating segments reflect our                       900,000 electricity contracts                       operations, including certain large business
Business Area organisational structure except for                    • One of the market leaders in the Netherlands with   customers
the Power Generation segment, which is divided                         3.6 million electricity and gas contracts           • Operates a portfolio with 7.2 GW nuclear capacity
into the Generation and Markets Business Areas                       • Leading position in Berlin and Hamburg as an          and 11.7 GW hydro power capacity across
                                                                       electricity supplier                                  Sweden, Finland and Germany
                                                                     • Activities in France expanded from business         • One of Europe’s largest providers of fossil-free
Number of Employees as of 31                                           customers to also serve retail customers with         electricity, with 35.8 TWh from hydro power and
December 20191                                                         electricity and gas                                   53.4 TWh from nuclear power
                                                                     • Operates 14,900 e-mobility charging points in       • Provides professional asset optimisation services
                                                                       Sweden, Germany and the Netherlands                   and market access, and a leading player in PPA
    Customers and Solutions                                3,150     • Launch of Flexpower, a public smart charging          markets in northwest Europe
                                                                       network for e-vehicles, in cooperation with the     • Closure of Ringhals reactor 2 and preparation for
    Power Generation                                       7,429       city of Amsterdam                                     the decommissioning of Ringhals reactor 1 in
                                                                                                                             2020
    Wind                                                   1,000
                                                                     Underlying Operating Profit3: SEK 1,337 mn            Underlying Operating Profit: SEK 15,437 mn
    Heat                                                   3,310     (5% of total)                                         (58% of total)
                                                                     External Net Sales: SEK 87,343 mn                     External Net Sales: SEK 38,425 mn
    Distribution                                           2,247     (53% of total)                                        (23% of total)
                                                                     EBITDA: SEK 2,976 mn                                  EBITDA: SEK 13,642 mn
                                                                     (8% of total)                                         (35% of total)
    Other2                                                 2,678

1   Full-time equivalents.
2   Pertains mainly to Staff Functions and Shared Service Centres.                                                                                                          3
3 Numbers     reflect FY 2019
Vattenfall Investor Presentation - Handelsbanken speed-dating 11 November 2020 Johan Gyllenhoff, VP Finance & Group Treasury Johan Sahlqvist, Head ...
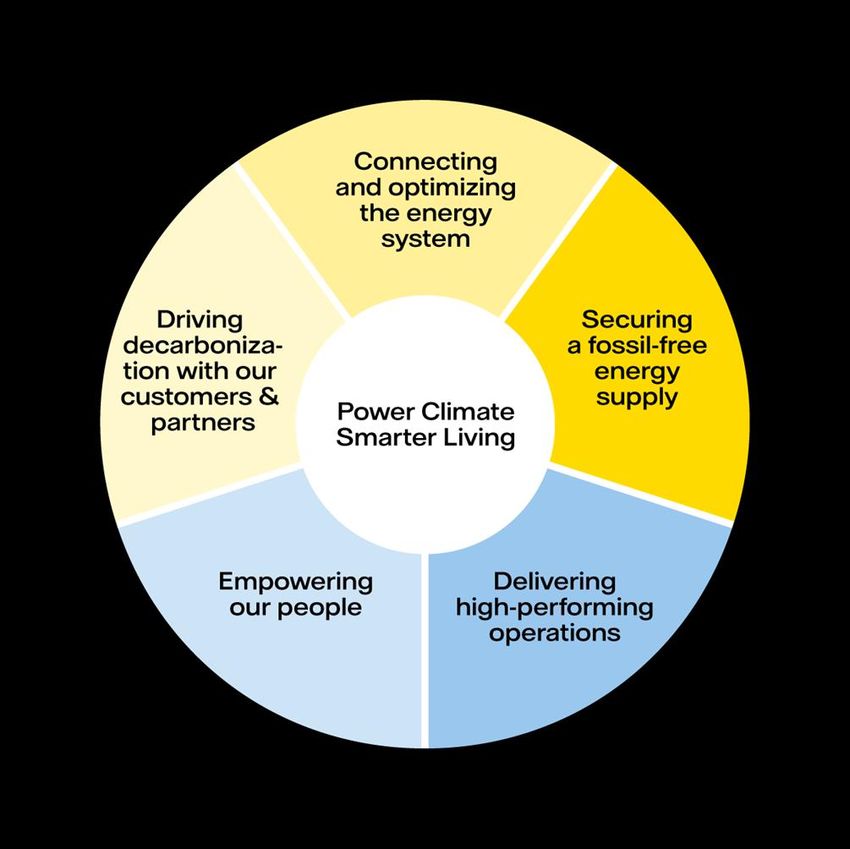
Operating segment overview FY 2019 (Cont’d)
Wind                                                Heat                                                    Distribution
Responsible for development and operation of        Responsible for Vattenfall’s heat operations            Responsible for Vattenfall’s electricity
Vattenfall’s wind farms as well as large-scale      including sales, decentralised solutions and            distribution operations in Sweden, Germany
and decentralised solar power and batteries         gas-and coal-fired condensing                           (Berlin) and the UK
• One of the largest producers of offshore wind     • One of Europe’s leading producers and                 • Leading owner and operator of electricity
  power in the world                                  distributors of heat with more than 1.9 million end     distribution networks in Sweden
• One of the largest producers of onshore wind        customers                                             • Approximately 3.3 million business and retail
  power in Denmark and the Netherlands              • Power-to-Heat facility connected to district            customers in Sweden and Berlin, Germany
• Inauguration of the Horns Rev 3 offshore wind       heating network in Berlin, enabling the closure of    • Swedish Energy Markets Inspectorate
  farm (407 MW) in Denmark                            a coal-fired power plant                                announced significantly lower revenue frames for
• Winning bid for the subsidy-free Hollandse Kust   • Feasibility study conducted by Vattenfall and the       the next regulatory period, reducing the scope for
  Zuid 3 & 4 offshore wind farm (~750 MW) in the      City of Berlin shows that a coal phase-out in           needed investments
  Netherlands                                         Berlin is feasible by 2030                            • Major disruptions after Storm Alfrida in 2019 with
• Construction started on the Kriegers Flak (605    • Transfer of district heating operations in Hamburg      associated costs of approximately SEK 800
  MW) offshore wind farm in Denmark                   completed                                               million
                                                    • Closure of the Hemweg 8 coal-fired power plant
                                                      in the Netherlands
                                                    • Switch from peat to wood pellets as fuel in heat-
                                                      only boiler in Uppsala
Underlying Operating Profit1: SEK 4,155 mn          Underlying Operating Profit: SEK 550 mn                 Underlying Operating Profit: SEK 4,998 mn
(16% of total)                                      (2% of total)                                           (19% of total)
External Net Sales: SEK 6,578 mn                    External Net Sales: SEK 15,947 mn                       External Net Sales: SEK 17,903 mn
(4% of total)                                       (10% of total)                                          (11% of total)
EBITDA: SEK 9,645 mn                                EBITDA: SEK 4,957 mn                                    EBITDA: SEK 8,236 mn
(24% of total)                                      (13% of total)                                          (21% of total)

1   Numbers reflect FY 2019                                                                                                                                    4
Vattenfall Investor Presentation - Handelsbanken speed-dating 11 November 2020 Johan Gyllenhoff, VP Finance & Group Treasury Johan Sahlqvist, Head ...
Our beliefs about the future

         1                   2                 3                  4                     5                    6
  Sustainability is   Simple solutions    Demand for        Digitalisation of          New             Cost efficiency
   the business         to customers       fossil-free     the entire energy     competencies                and
                         needed in a     electricity and     value chain is     are critical in the   competitiveness
                      complex energy        grids will        necessary         energy transition       is paramount
                          landscape         increase
                                          significantly

                                                                                                                         5
Vattenfall Investor Presentation - Handelsbanken speed-dating 11 November 2020 Johan Gyllenhoff, VP Finance & Group Treasury Johan Sahlqvist, Head ...
A strategy based on an “integrated utility logic”
To enable our goal of fossil-free living within one generation

We believe being active in the whole value chain is strategically important:

    It increases our competitive advantage in eg. wind auctions, by
    enabling stable revenues through Corporate PPAs with our customers

    Access to renewable volumes on the customer side differentiates us
    from competitors as fossil-free electricity becomes more scarce

    The ability to optimise dispatch across both customer loads and
    supply brings optimal value of a total portfolio

    Diversifying and reducing total portfolio risk means lower cost of
    capital and an ability to take on more debt

                                                                               6
Europe continues to be a highly attractive growth market
Despite significant ramp-up in renewables, much more growth is expected in the coming decade

 Increasing demand and phase-out of coal                                        Double-digit growth across renewable technologies until 20301
 gives plenty of room for growth in Europe                                                                                                                         Europe    ROW 2

                                                                                Offshore wind (GW)               Onshore wind (GW)                 Solar (GW)
                                                        Increased demand
                                                                                150                                                        974                               2077
                                                        driven by                                        133     1000                              2100
                                     Investment need    electrification trend

                                                                                                                  750             664
                                                                                100                                                                                  1239
                                                                                                                                                   1400

                                                                                                  63              500
                                                        Expected lifetime                                                348
                                                        ~20-25 years             50                                                                 700
                                                                                                         63%                                                448
                                                                                          22                      250
                                                                                                                                          44%
                                                        Significant                              68%                              42%
                                                        phasing-out                                                                                                          21%
                                                                                         77%                            39%                                          21%
                                                                                  0                                 0                                 0     26%
 Today                                                 ~25 year horizon                  2018    2025    2030           2018      2025    2030             2018      2025    2030

                                                                                Europe   17 GW   43 GW   84 GW          136 GW   279 GW   430 GW          115 GW    266 GW   433 GW

                                                                                 ROW     5 GW    20 GW   49 GW          212 GW   385 GW   545 GW          333 GW    973 GW   1,644 GW

1 Source: Bloomberg NEF – NEO 2019
2 ROW   excludes China                                                                                                                                                                  7
Energy transition to spur dramatic growth in electricity
demand in Sweden
Electrification, growth in renewable production capacity and ageing assets call for large network investments
 Electricity demand set to grow due to                                  Installed wind capacity continues to               Existing network assets are
 electrification and new electricity                                    grow                                               increasingly in need of reinvestments
 intensive businesses                                                   • More and more capacity will be                   • There was a large build out of network
 • Electrification of industry and transports to                          intermittent and decentralised                     assets in 1970-1990. These assets are
   increase total electricity demand                                    • Wind production is set to continue the             now reaching the age when they need to
                                                                                                                             be reinvested in
 • New businesses such as data centres are                                growth in Sweden, mainly in the North and
   also likely to have a significant impact                               off the coast in Southern Sweden which           • This is on top of the need to make new
                                                                          increases the need for network capacity            investments in the network to
 • Efficiency improvements in the housing
                                                                                                                             accommodate more renewable energy
   sector only have a small mitigating effect
                                                                                                                             and electrification
   on total demand

Forecast – Change in electricity demand (Sweden)1                       Forecast - installed wind capacity (Sweden)2            Asset age structure – Vattenfall Eldistribution3
       50                                                                 100                                                   4          10 years   20 years    30 years
       40                                                                                                                                  40 years   50 years
                                                                              80
                                                                                                                                3
       30

                                                                                                                         BSEK
                                                                        TWh
 TWh

                                                                              60
       20                                                                                                                       2
                                                                              40
       10
                                                                              20                                                1
       0
               2020    2025      2030     2035      2040    2045
   -10                                                                         0                                                0
                                                                                    2020           2030           2040
            Housing   Datacenter etc     Industry    Transportation                                                             1930 1940 1950 1960 1970 1980 1990 2000 2010

1 Source:     Nepp, Färdplan för fossilfri el, Aug 2019
2 Source:     Svensk vindenergi, 100 procent förnybart 2040, Oct 2019
3 Asset                                                                                                                                                                            8
            base per 2020-01-01
Going beyond our own production maximises CO2 impact
All parts of society need to adjust – electrifying transports and industry is key to enable a fossil-free life
Total green house gas emissions                                      Transports
Sweden1 (2018) 52 MtCO2e                                             MtCO2e

                                                                                              3                 2                1                 16
                                                                               10

                                     7
                                     5                                        Cars       Heavy Trucks      Other Road           Air,
                                                                                                           Transports         Railroad,
                                     7                                                                                        Shipping
                                                                      Industry
                                                                      MtCO2e
                                    16                64% of total                                                                5                17
                                                       Emissions
                                                                                                                 3
                                                                                               3
                                                                                6
                                    17

                                                                          Iron & Steel      Cement           Refineries         Other

             There is huge potential to reduce industry emissions through                  Besides fossil free steel via the HYBRIT initiative, with a 10%
            electrification. Vattenfall has discussions and research ongoing                 reduction potential of total Swedish emissions when fully
                       with (potential) partners in different sectors.                      implemented, Vattenfall sees potential in other sectors like
                                                                                           cement, refinery, chemical, agriculture, shipping and aviation

1 Source:   Swedish Environmental Protection Agency                                                                                                          9
Electricity - from a power source to a source of innovation
Together with our partners, we pave the way for a new generation of transports, industries and materials

    Research project for   Cooperation in large   Feasibility study on    Electrification of    Co-operation for e-
     a carbon dioxide-       scale bio-diesel         electrified        mines and smelters         mobility
     free steel industry       production         cement production

     Green guaranteed      Support of a major     Northern Europe’s          Powering          Storage projects at a
      energy delivery        enterprise for        largest charging         sustainable        number of wind parks
     large customers,      battery production        network for e-         datacenters
            e.g.               in Sweden               vehicles

                                                                                                                       10
UN SDG’s
Project deep dive – HYBRIT
HYBRIT – towards the world’s first fossil-free steel

                                                                  Financing and timeline

                                                                  The total cost for the pilot phase is estimated to be SEK 1.4 billion. The
                                                                  Swedish Energy Agency will contribute more than SEK 500 million
 What is HYBRIT?                                                  towards the pilot phase and the three owners, SSAB, LKAB and
                                                                  Vattenfall, will each contribute one third of the remaining costs. The
 • HYBRIT – short for Hydrogen Breakthrough Ironmaking            Swedish Energy Agency has earlier contributed SEK 60 million to the
   Technology – is a joint venture between Vattenfall, SSAB       pre-feasibility study and a four-year-long research project.
   (steel) and LKAB (mining and minerals)
 • The aim is to replace coking coal, traditionally needed for    The pilot phase is planned to last until 2024, after which it will move to
   ore-based steel making, with green hydrogen                    the demonstration phase in 2025-2035.
 • The result will be the world’s first fossil-free steel, with
   virtually no carbon footprint                                  Main project phases
                                                                                          2020                    2025                      2030   2035
 Why is this important?
 • The steel industry is one of the highest CO2-emitting              2016–2017       2018–2024                       2025–2035
   industries, accounting for 7% of global and 10% of               Pre-feasibility   Pilot Phase                     Demonstration Plant Trials
   Swedish total CO2 emissions                                             Study      • 2018–2020 Pilot line design
                                                                                         and building phase
 • Steel demand is set to grow due to population and                                  • 2021–2024 Pilot line trials
   urbanisation → carbon footprint of the industry needs to be
   addressed

                                                                                                                                                     11
Significant shift in production portfolio over the past 5 years
The shift has accelerated with large investments in renewables and phase out of fossil production
 CAPEX by technology                                                                 Electricity production mix                                                 CO2 emissions
          SEK 30.8 bn                         SEK 36.4 bn                                           173.0 TWh                  130.3 TWh
                                                 8.4%                                                                                                                      83.8
                                                                                                                                24.0%
               39.6%                                                                                  48.7%                     7.3%
                                                   69.2%                                                                        27.5%
               30.5%                                                                                  3.3%
                                                                                                      22.7%                                                                                                                  19.3
               10.4%                               5.8%                                                                         41.2%
               19.5%                               16.6%                                              25.3%

             2015-16                             2020-21                                              2015                       2019                                     2015 3                                            2019 4
                         1                                   2
                 Other       Hydro       Wind       Fossil                                           Other11    Hydro   Wind    Fossil   2
                                                                                                                                                                                       CO2 emissions (Mtonnes)
                                                                                                                                                                                       CO2 emissions (Mtonnes)

 Major investments in renewable projects                                             Share of fossil production has been reduced                                …and with this our CO2 emissions
 • Around SEK 25 billion of investments are planned                                  dramatically                                                               We sold the lignite business in 2016, which reduced
   for new wind farms, both onshore and offshore                                     • Strong wind growth: 3.4 GW installed capacity;                           our CO2 footprint dramatically
 • Recent milestones:                                                                  > 3 GW under construction and >4 GW in                                   • We continue to identify further actions such as
    • Winning bid for the world’s first subsidy-free                                   development                                                                retiring coal fired power plants earlier than
       offshore wind farm once commissioned in                                       • First large scale solar farm commissioned in                               planned (such as Hemweg-8 in the Netherlands)
       2023 (Hollandse Kust Zuid 1-4)                                                  2016, Parc Cynog (5 MW)
    • Major onshore projects in the Nordics and the                                                                                                             • We are also phasing out coal from all of our heat
                                                                                     • Increased focus on decentralised production,                               operations by 2030, at latest
       Netherlands (Blakliden & Fäbodberget,                                           storage and EV charging
       Wieringermeer)                                                                                                                                           • In 2030, the Nordic production fleet will be free
                                                                                     • Coal-fired production has been phased out such                             from fossil fuels
    • Proof of concept in solar & batteries ready for
                                                                                       as Reuter C in Berlin and Hemweg-8 in the
       scaling up and innovative solutions such as
       co-location with wind farms (Haringvliet,                                       Netherlands
       Battery at Pen y Cymoedd)
1 Otherincludes nuclear, solar & batteries (CAPEX only) & biomass                                                                  4Pro rata values, corresponding to Vattenfall’s share of ownership Including the heat operations in
2Includes hard coal and gas                                                                                                        Hamburg, which have been sold and where emissions amounted to 1.1 Mtonnes during the period
3Consolidated values for 2015. Consolidated emissions are approximately 0.5% higher than pro rata                                  January-September                                                                                     12
emissions, corresponding to Vattenfall’s share of ownership
Strategic targets 2025
    Strategic focus area                             Strategic targets to 2020           2025 Target                    Actual 2019                 Motivation
                                                                                                                                                    Established and
    Driving decarbonisation with
                                                                                                                                                    recognised as key to
    our customers & partners                         Net Promoter Score1 (Absolute)              18                                2
                                                                                                                                                    assess customer
                                                                                                                                                    behaviours/attitudes
    Securing a fossil-free energy                                                                                                                   Established in Science
    supply                                           CO2 Emissions Intensity               ≤86 gCO2/kWh2                 126 gCO2/kWh3              Based Targets. Industry
                                                                                                                                                    standard
    Empowering our people                                                                                                                           Safety first, best practise
                                                     LTIF                                       ≤1.0                              2.1
                                                                                                                                                    KPI
                                                                                                                                                    Engaged employees is a
                                                     Engagement Index                            75                               69
                                                                                                                                                    key factor for success
    Delivering high-performing                                                                                                                      Key metric in financial
                                                     FFO/Adjusted Net Debt                    22-27 %                           26.5%
    operations                                                                                                                                      steering
                                                                                                                                                    Key metric in financial
                                                     ROCE                                       8%                              8.5 %
                                                                                                                                                    steering

1 NPS absolute target is calculated with a weighting of 80% from Customers & Solutions           3 Excluding   the heat operations in Hamburg, which were sold in September 2019
and 20% from Heat resembling size of customer basis
2 Targeting 86 gCO /kWh by 2025 puts us on a “1.5°C“ trajectory by 2030 according to                                                                                               13
                   2
Science Based Target levels
Investment plan 2020-2021
                          Total capex                               Growth capex per technology                 Growth capex per country
                           2020-2021                                         2020-2021                                 2020-2021

                                                                                    3%

                                                                                                                          9%
                        16%                                                    8%

                                                                        8%                                         11%
                                                                                                                                           37%
                                58bn                                                35bn                                       35bn
                                                                      11%                                        12%
                23%             SEK                                                 SEK                                        SEK
                                                61%
                                                                                                  70%

                                                                                                                           31%

                        Growth, 35bn SEK                                    Wind power, 25bn SEK                       Netherlands, 13bn SEK
                        Maintenance, 13bn SEK                               Heat grids, 4bn SEK                        Denmark, 11bn SEK
                        Replacement, 9bn SEK                                Distribution grids, 3bn SEK                Sweden, 4bn SEK
                                                                            New businesses1, 3bn SEK                   UK, 4bn SEK
                                                                            Solar energy & batteries, 1bn SEK          Germany, 3bn SEK

1 Mainly   decentralised solutions, energy storage and e-mobility                                                                                14
Financial targets

                                   Targets over a business
    Financial targets              cycle1                          FY 2019     FY 2018    Comment

                                                                                          Return on capital employed was 8.5% (7.0%). A
                                                                                          higher gross margin in the Power Generation
                                   Return on capital employed:
    Profitability                                                   8.5%        7.0%      segment and the capital gain from the divestment of
                                   ≥8%2,3
                                                                                          the district heating operations in Hamburg made a
                                                                                          positive contribution.

                                                                                          FFO/adjusted net debt increased compared
                                   FFO/adjusted                                           with 2018, to 26.5% (20.7%). The increase is
    Capital structure              net debt:                        26.5%       20.7%     mainly attributable to higher EBITDA as a result
                                   22%–27%2                                               of higher achieved prices in Power Generation
                                                                                          operating segment and lower paid tax.

                                                                                          At the end of Q1’2020, the Board of Directors
                                   Dividend:                                              proposed a revision of the previously proposed
    Dividend policy                40%–70% of the year’s profit   SEK 3.6 bn   SEK 2 bn   dividend for 2019 from SEK 7.2 to SEK 3.6 bn due to
                                   after tax                                              uncertain market conditions, which was also
                                                                                          approved at the Annual General Meeting.

1 5–7  years
2 Rolling 12-month values                                                                                                                       15
3   The key ratio is based on average capital employed
Credit ratings overview
                                                       Long term rating: A3                                                     Long term rating: BBB+
                                                      Short term rating: P-2                                                      Short term rating: A-2
                                                          Outlook: Negative                                                             Outlook: Stable
                                           Latest publication: 04 June 2020                                             Latest publication: 12 May 2020

• “Strategic role in Sweden, as well as "moderate" default dependence”          • “Above 45% of EBITDA stems from relatively stable and low-risk
                                                                                  regulated electricity distribution networks and district heating
• “Overall, Vattenfall's A3 rating continues to be supported by (1) the
                                                                                  operations”
  company's breadth and scale of operations; (2) its clean generation
  portfolio in the Nordics; (3) moderate contribution from regulated            • “Leading position in the Swedish power generation market, supported
  electricity distribution and district heating activities; (4) an increasing     by large nuclear fleet and flexible low-cost hydropower generation
  contribution from contracted renewables; and (5) a solid financial              assets”
  profile with funds from operations (FFO)/net debt close to 25% in             • Low power prices in the Nordics over 2020-2021 and a 5%-10%
  2019                                                                            reduction in power demand following the outbreak of COVID-19 is
• “The negative outlook reflects Moody's expectation that Vattenfall's            expected to cause a shortfall in earnings
  financial metrics will be weakly positioned against the guidance for
                                                                                • “Increased cash contribution from subsidised, long-term contracted
  the current rating, which includes FFO/net debt around the mid-
                                                                                  renewables (with wind representing about 24% of our 2019 adjusted
  twenties in percentage terms and RCF/net debt in the high teens in
                                                                                  EBITDA)”. Vattenfall will make significant investments in renewables,
  percentage terms”
                                                                                  in line with its strategy
                                                                                • “Recent investments in wind and heat is expected to increase
                                                                                  EBITDA in 2021-2023, Vattenfall is working to actively reduce
                                                                                  operating costs and maintain a financial risk profile, namely FFO to
                                                                                  debt above 20%

                                                                                                                                                         16
Environmental, social and governance (ESG) ratings
Vattenfall is assessed by several sustainability rating agencies on its ESG performance

We aim to be as open and transparent as possible in our sustainability reporting and we are proud to be highly ranked for our sustainability
performance. The below table shows the agencies we actively engage with and our most recent rating scores

 Rating Agency     Rating focus                                                                   Score                                        Latest assessment

                   The leading system globally for disclosing environment data for investors,
                                                                                                  Score A: top 2% of all rated companies       January 2020
                   companies, cities, states and regions

                   An online platform that enables companies to monitor the CSR performance of    Gold rating: top 1% of all rated companies
                                                                                                                                               December 2019
                   their supply chains by providing supplier sustainability ratings               and top 3% in the sector

                   ESG rating mainly for the investment community. The assessment spans a
                                                                                                  Score B “Prime”: highest decile of
                   broad range of ESG issues that are analysed on the basis of up to 100 rating                                                January 2020
                                                                                                  companies assessed in the sector
                   criteria, most of them sector specific

                   ESG rating mainly for the investment community. Uses a rules-based
                   methodology to identify industry leaders and laggards. Ranks companies         Score AA “Leader”: meaning top 26% of
                                                                                                                                               June 2020
                   according to their ESG risk exposure and how well they manage those risks      companies assessed in the sector.
                   relative to peers.

                   ESG rating mainly for the investment community. Uses a two-dimensional        ESG risk rating: Medium (Strong
                   materiality framework that measures a company’s exposure to industry specific management score but high exposure).          June 2020
                   material risks and how well a company is managing those risks.                Top-15% of companies in subindustry

                                                                                                                                                                   17
Vattenfall credit highlights

                              BBB+ stable outlook
                                by S&P and A3        100 per cent owned
                              negative outlook by   by the Swedish State
                                   Moody’s                                        Regulated and
      A leading European
                                                                              predictable cash flow
     energy company with
                                                                                  from electricity
      activities across the
                                                                             distribution and district
           value chain
                                                                                     heating

                                                                             Experienced player in
        Leading towards                                                      renewables and one
     sustainable production                                                  of the leaders in wind
                                                                               power generation
                                                     Significant growth in
                                  A significant
                                                    renewable production
                              transformation has
                                                      and climate smart
                               already happened
                                                       energy solutions

                                                                                                         18
Appendix
Vattenfall 9M Results 2020
Financial highlights

Key data                                                 Key developments
SEK bn                               9M 2020   9M 2019
                                                         • Net sales decreased by SEK 5.4 bn to SEK 114.8 bn
Net Sales                             114.8     120.2      due to lower spot prices and lower volumes in the
EBITDA                                34.4      33.6       Nordics, the Netherlands and Germany as well as
                                                           lower income from the heat operations
Underlying operating profit (EBIT)    17.8      16.9
                                                         • Underlying EBIT increased by SEK 0.9 bn mainly due
EBIT                                  10.0      19.7       strong sales in Germany, lower depreciation in the
                                                           Netherlands for Customers & Solutions, lower costs in
Profit for the period                  2.0      14.4
                                                           Distribution (following Storm Alfrida in 2019) and
Funds from Operations (FFO)           23.7      23.4       higher realised trading result. Partly offset by lower
                                                           achieved prices and lower nuclear power production
Cash flow operating activities        26.8      11.7
                                                         • Profit for the period decreased to SEK 2.0 bn, mainly
Net debt                              58.9      59.6       as a result of write-downs in the operating segments
                                                           Heat (SEK 9.0 bn) and Wind (SEK 1.5 bn)
Adjusted net debt                     126.3     125.4
                                                         • ROCE was 4.7% mainly due to impairments
Adjusted net debt/EBITDA1 (times)      2.9       3.0
                                                         • FFO/Adjusted net debt increased to 27.9%, mainly as
Financial targets                                          a result of higher FFO due to higher EBITDA. Main
                                                           drivers were positive effects from hedging activities
ROCE1 (≥8%)                            4.7       9.2
                                                           and positive development in Customers & Solutions
FFO/adjusted net debt1 (22-27%)       27.9      24.5

 1   Last 12-month values                                                                                           20
Development of underlying EBIT 9M 2020
Increase from C&S and Distribution offset by lower earnings in Power Generation and Wind

 Change in 9M 2020 vs. 9M 2019                               Breakdown per operating segment Highlights
 SEK bn                                                      SEK bn
                                                                                                          • Customers & Solutions: strong contribution
Underlying EBIT 9M 2019       16.9                                                               17.8       from sales in Germany. Lower depreciation
                                                                                       16.9
                                                             Customers & Solutions      0.6       1.8       in the Netherlands
  Customers & Solutions                        1.2                                                        • Power Generation: lower achieved prices
                                                                                                            and lower nuclear generation, partly
                                                                                                            countered by higher realised earnings from
      Power Generation                                -0.5
                                                                                                            trading
                                                                 Power Generation      11.3      10.7     • Wind: additional capacity (Horns Rev 3)
                     Wind                     -0.2
                                                                                                            countered by higher depreciation and
                                                                                                            higher costs due to new capacity and
                      Heat                  -0.1                                                            project development
                                                                                                          • Heat: effects from sale of district heating
               Distribution                   0.4                            Wind       2.5       2.3       operations in Hamburg and the closure of
                                                                             Heat       0.3       0.2       Hemweg 8. Unfavorable clean dark and
          Net other effects                          0.2
                                                                                                            clean spark spreads also contributed to
                                                                       Distribution     3.5       3.9
                                                                                                            lower electricity production.
                                                                             Other     -1.2      -1.0     • Distribution: lower operating costs following
 Underling EBIT 9M 2020              17.8
                                                                                      9M 2019   9M 2020     the Storm Alfrida in Q1 2019

                                                                                                                                                      21
Cash flow development 9M 2020
Positive working capital development mainly related to seasonality effects and changes in margin calls
SEK bn
     34.4              -2.3
                                        -2.3
                                                        -0.2             -6.0
                                                                                                3.2       26.8          -7.9
                                                                                        23.7

                                                                                                                                     19.0         -7.8

                                                                                                                                                               0.6          11.7

    EBITDA          Tax paid         Interest         Capital           Other1          FFO    Change      Cash      Maintenance     Free         Growth   Divestments,   Cash flow
                                  paid/received,       gains/                                   in WC   flow from        and       cash flow   investments     net          before
                                        net         losses, net                                         operating    replacement                                          financing
                                                                                                        activities   investments                                          activities

Main effects
• Change in working capital mainly driven by changes related to seasonality in net change in operating receivables and liabilities in the
  Customers & Solutions and Heat operating segments (SEK 3.5 bn), net change in margin calls for commodity hedging activities (SEK 3.4
  bn) and decreased inventory (SEK 1.6 bn). Changes related to CO2 emission allowances had an offsetting impact (SEK -4.2 bn).
• Growth investments mainly related to wind power

1 ”Other” includes non-cash items included in EBITDA, mainly changes in fair value of
                                                                                                                                                                                       22
commodity derivatives
Debt maturity profile1

                                                                                                                                                                        30 Sep.        31 Dec.
SEK bn       24.1                                                                                                                                                        2020           2019

                                                                                                                           Duration (years)                               4.0            4.7

            18.6                                                                                                           Average time to maturity (years)               5.2            6.8

                                                                                                                           Average interest rate (%)                      3.3            4.0

                                                                                                                           Net debt (SEK bn)                              58.9           64.3

                                                                                                                           Available group liquidity (MSEK)               44.9          29.3
                                               10.5                                                                        Undrawn committed credit facilities
                                                                                                                                                                         24.1           21.4
                                                                                                              8.7          (MSEK)

                    6.0
                                5.3 5.3 5.3
                          3.9                                4.1
                   3.2
     2.5*                                                                                                                  Cumulative maturities excl. undrawn back-up facilities
                                                                                                1.1
                          0.3                         0.5                                                                                                     2020-         2023-       From
                                                                                                                                                              2022          2025        2026
     2020          2022         2024    2026          2028         2030   2032     2034         2036   2038         2040
                                                                                                                           Debt incl. hybrid capital             30.3           14.9      30.3

              Hybrid capital (first call date)          Debt (excl. hybrid cap)       Undrawn back-up facilities           % of total                            40%            20%       40%

 * Short term debt are excluded (Repo, ECP and SCP) (11.5) 1 Commercial paper (ECP) Loans

from associated companies, minority owners, margin calls received (CSA) and valuation at fair
value are excluded and currency derivatives for hedging debt in foreign currency are included                                                                                                    23
Price hedging

Vattenfall continuously hedges its future electricity generation through sales in the forward and futures markets. Spot prices
therefore have only a limited impact on Vattenfall’s earnings in the near term

          Estimated Nordic1 hedge ratio (%) and indicative prices                       Achieved prices2 - Nordic portfolio

                                65%                                                     YTD 2020          YTD 2019         Q3 2020          Q3 2019          FY 2019            LTM
                                                     63%
                                                                                            31                32               38               29              32               31

                                                                           36%          Sensitivity analysis – Continental3 portfolio
                                                                                        Market               +/- 10% price impact on future profit
                                                                                        quoted                        before tax, MSEK4
                                                                                                                                                                  Observed yearly
                                                                                                               2021            2022               2023
                                                                                                                                                                     volatility
                                                                                        Electricity           +/- 22          +/- 457          +/- 1,124              18% - 25%

                                2020                 2021                 2022          Coal                 -/+ 133          -/+ 71              -/+ 3               16% - 19%

    Average                                                                             Gas                   -/+ 79          -/+ 309           -/+ 681               18% - 25%
    indicative Nordic           33                    29                    30
    hedge prices in                                                                     CO2                   -/+ 84          -/+ 64            -/+ 269               47% - 49%
    EUR/MWh

1Nordic: SE, DK, FI                                                                              3Continental: DE, NL, UK.
2Achieved prices from the spot market and hedges. Includes Nordic (SE, DK, FI) hydro,            4 The denotation +/- entails that a higher price affects operating profit favorably, and -/+ vice 24
nuclear and wind power generation                                                                versa
Liquidity position

                                                                                                                                 Facility size,
    Group liquidity                                                                      SEK bn    Committed credit facilities        EUR bn      SEK bn
    Cash and cash equivalents                                                              20.2    RCF (maturity Dec 2021)                 2.0      21.1

    Short term investments                                                                 29.1    RCF (maturity Oct 2021)                           3.0

    Reported cash, cash equivalents & short                                                49.2    Total undrawn                                    24.1
    term investments
                                                                                                   Debt maturities2                               SEK bn
    Unavailable liquidity1                                                                  -4.4   Within 90 days                                    2.5
    Available liquidity                                                                    44.9    Within 180 days                                  14.9

1 German nuclear ”Solidarvereinbarung” 1.0 SEK bn, Margin calls paid (CSA) 2.4 SEK bn,
Insurance “Provisions for claims outstanding” 0.8 SEK bn                                                                                                   25
2 Excluding loans from minority owners and associated companies
Debt development

SEK bn                                                                                                                       Gross debt             Net debt                 Adjusted net debt

160                                                                                                                                                                148.3
                                                                                                                                 137.2                                          140.3
                                                                         130.9                                       134.4                              132.0
140                          127.1
         124.1    124.7                 123.3                 124.4                 125.2                                                   125.3                                          126.3

120                                     112.0      113.3                                                  112.3                                                    113.8        114.8
                                                                                               109.3                                                                                       108.5
         98.6                                                                                                        99.6        101.7
                  96.7       96.0                                        97.5                                                                           97.6
100                                                91.9                             93.8                                                    93.8
                                                              87.2                                        88.3
                                                                                               84.2                                                                81.6
 80                                                                                                                  72.5        72.5                                            71.6
                                        67.2                             64.4                                                                           64.3
         58.0                                      56.8       59.3                  57.8                                                    59.6                                           58.9
 60                          54.7
                  50.7                                                                                    47.7
                                                                                               42.4
 40

 20

  0
      30.09.16   31.12.16   31.03.17   30.06.17   30.09.17   31.12.17   31.03.18   30.06.18   30.09.18   31.12.18   31.03.19    30.06.19   30.09.19    31.12.19   31.03.20     30.06.20   30.09.20

 Net debt decreased by SEK 5.4 bn compared with the level at 31 December 2019. Adjusted net debt decreased to SEK 126.3 bn, SEK 5.7 bn
 lower compared with the level at 31 December 2019. For the calculation of adjusted net debt, see slide 26.

                                                                                                                                                                                                     26
Breakdown of gross debt

    Total debt: SEK 108.5 bn (EUR 10.3 bn)
    External market debt: SEK 96.4 bn (EUR 9.1 bn)
                                                                        Debt issuing programmes   Size (EUR bn)   Utilization (EUR bn)

                              EMTN                              43%     EUR 10bn Euro MTN                  10.0                    4.1

                                                                        EUR 4bn Euro CP                     4.0                    1.2
                      Hybrid capital                      19%
                                                                        Total                              14.0                    5.3

           Commercial paper / Repo                  11%

    Loans from minority shareholders                10%

                         Bank loans            6%

                                                                      • All public debt is issued by Vattenfall AB
                              Lease           4%                      • The main part of debt portfolio has no currency exposure that
                                                                        has an impact on the income statement. Debt in foreign
                  Margin calls (CSA)          4%                        currency is either swapped to SEK or booked as hedge against
                                                                        net foreign investments.
                     Other liabilities   1%                           • No structural subordination

Loans from associated companies          1%

1   EMTN= Euro Medium Term Notes                                                                                                         27
Reported and adjusted net debt

 Reported net debt                                    30 Sep.   31 Dec.   Adjusted net debt                                  30 Sep.   31 Dec.
 (SEK bn)                                                2020      2019   (SEK bn)                                              2020      2019

 Hybrid capital                                         -20.2     -20.2   Total interest-bearing liabilities                  -108.5     -97.6

 Bond issues and liabilities to credit institutions     -52.8     -38.8   50% of Hybrid capital                                 10.1      10.1

 Commercial papers and Repos                            -12.3     -17.2   Present value of pension obligations                 -43.2     -44.0

 Liabilities to associated companies                     -1,0      -0,7   Wind & other environmental provisions                 -8.9      -8.6

 Liabilities to minority shareholders                   -11.1     -10.6   Provisions for nuclear power (net)                   -36.5     -35.5

 Lease liabilities                                       -4.9      -4.6   Margin calls received                                  4.8       3.7

 Other liabilities                                       -6.2      -5.2   Liabilities to minority owners due to consortium
                                                                                                                                11.1      10.6
                                                                          agreements
 Total interest-bearing liabilities                    -114.8     -97.6
                                                                          = Adjusted gross debt                               -171.2    -161.3
 Reported cash, cash equivalents & short-term
                                                         49.2      33.2
 investments                                                              Reported cash, cash equivalents
                                                                                                                                49.2      33.2
                                                                          & short-term investments
 Loans to minority owners of foreign subsidiaries         0.5       0.2
                                                                          Unavailable liquidity                                 -4.4      -3.9
 Net debt                                               -58.9     -64.3
                                                                          = Adjusted cash, cash equivalents & short-term
                                                                                                                                44.9      29.3
                                                                          investments

                                                                          = Adjusted net debt                                 -126.3    -132.0

                                                                                                                                                 28
Nuclear provisions

    Reactor                                 Net capacity         Start (year)           Vattenfall share      Vattenfall provisions, SEK                    Vattenfall provisions,        Sw nuclear waste fund
                                                   (MW)                                              (%)           bn (IFRS accounting)                         SEK bn (pro rata)         SEK bn (Vattenfall pro
                                                                                                                                                                                                     rata share)

    Ringhals 1                                          879          1976                            70.4
    Ringhals 2                                          809          1975                            70.4
    Ringhals 3                                        1,070          1981                            70.4
    Ringhals 4                                          942          1983                            70.4            Total Ringhals: 35.5                    Total Ringhals: 35.51
    Forsmark 1                                          984          1980                            66.0
    Forsmark 2                                        1,120          1981                            66.0
    Forsmark 3                                        1,170          1985                            66.0            Total Forsmark: 31.3                    Total Forsmark: 20.7
    Total Sweden                                      6,974             -                                                                   69.62                               57.92                          40.33
    Brunsbüttel                                         771          1977                            66.7                                   11.9                                  7.9
    Brokdorf                                          1,410          1986                            20.0                                       0                                 3.6
    Krümmel                                           1,346          1984                            50.0                                     7.6                                 7.6
    Stade4                                              640          1972                            33.3                                       0                                 0.9
    Total Germany                                     4,167             -                                 -                                 19.4                                 19.9
    Total SE & DE                                   11,141                                                                                  89.1                                 77.8
1Vattenfall is 100% liability of Ringhals decommissioning, while owning only 70.4%                                               3   Vattenfall’s share of the Nuclear Waste Fund. IFRS consolidated value is SEK 47.3 bn.
2Total provisions in Sweden (IFRS accounting) include provisions of SEK 0.5 bn (pro rata SEK 0.3 bn considering share in         4   Stade is being dismantled
Studsviksfonden) related to Ågesta, and SEK 2.3 bn (pro rata SEK 1.0 bn considering share in Studsviksfonden) related to SVAFO

                                                                                                                                                                                                                        29
Wind & Solar - Installed capacity (MW1) Q3 2020

                          Solar Onshore Offshore                Total          United Kingdom – ROC scheme         Denmark – FIT scheme                     The Netherlands – MEP/SDE(+)
United Kingdom                5      391      687               1,083             Thanet                    300       Horns Rev 1 (60%)               158      NoordzeeWind (50%)              108
Denmark                       0      237      565                 802             Ormonde (51%)             150       Horns Rev 3                     407      Princess Ariane                 184
The Netherlands             30       423      108                 562             Aberdeen                   97       Klim (98%)                       67      Princess Alexia                 122
Sweden                        0      234      110                 345             Kentish Flats              90       Nørrekær Enge 1 (99%)            30      Slufterdam                       29
Germany                       3       19      636                 658             Kentish Flats Extension    50       Rejsby Hede                      23      Eemmeerdijk                      17
Total (MW)                  38     1,305    2,106               3,449             Pen Y Cymoedd             228       Hagesholm                        23      Irene Vorrink                    17
                                                                                  Ray                        54       Nørre Økse Sø                    17      Hoofdplaatpolder (70%)           10
                                                                                  Edinbane                   41       Tjæreborg Enge                   17      Reyndersweg (50%)                 9
                                                                                  Clashindarroch             37       Hollandsbjerg                    17      Echteld                           8
                                                                                  Swinford                   22       Bajlum (89%)                     15      Coevorden                         7
                    Solar                                                         Parc Cynog                  4       DræbyFed                          9      De Bjirmen                        6
                    Onshore                                                       PV@Cynog                    5       Ryå                               8      Oom Kees (12%)                    6
                    Offshore                                                      Pendine                     5       Ejsing (97%)                      7      Oudendijk                         5
                                                                               Installed capacity (MW)    1,083       Lyngmose                          5      Mariapolder                       5
                                                                                                                   Installed capacity (MW)            802      Hiddum Houw                       4
                                                                               Sweden – certificate scheme                                                     Eemshaven                         6
                                                                                  Lillgrund                  110   Germany – EEG scheme                        Velsen                            2
                                                                                  Stor-Rotliden               78      DanTysk (51%)                   288      Enkhuizen                         2
                                                                                  Högabjär-Kärsås (50%)       38      Sandbank (51%)                  288      Hemweg                            2
                                                                                  Höge Väg (50%)              37      alpha ventus (26%)               60      Decentral Solar installations    13
                                                                                  Hjuleberg (50%)             36      Jänschwalde                      12   Installed capacity (MW)            562
                                                                                  Juktan (50%)                29      Westküste (20%)                   7
                                                                                  Östra Herrestad             16      Decentral Solar installations     3
                                                                               Installed capacity (MW)       345   Installed capacity (MW)            658

 1Capacity in operation: total capacity of the wind farms that Vattenfall has an ownership in.
 Minority shares included as 100%
                                                                                                                                                                                                30
Main renewables projects in our 5 core countries

                                        Capacity Support          Duration  Owner-        Com-                                                       Offshore
Country Name                                             Awarded                                                    Current status
                                          (MW)   scheme          of support ship (% )   missioning
                                                                                                                                                     Onshore
   DK     Kriegers Flak                    605     FIT      X     50.000hrs   100          2021           Offshore construction works started
   NL     Hollandse Kust Zuid 1-4        1,520      -       X         -       100          2023                Onshore works ongoing                 Solar
   NL     Princess Ariane                  301    SDE+      X       15 yrs    100          2020                Commissioning ongoing                 Batteries
   NL     Moerdijk                          27    SDE+      X       15 yrs    100          2020                Commissioning ongoing
   NL     Haringvliet                       22    SDE+      X       15 yrs    100          2020                Commissioning ongoing
   NL     Nieuwe Hemweg                     19    SDE+      X       15 yrs    100          2021                   Under construction
   UK     South Kyle                       240      -      N/A        -       100          2023                  Construction started
   NL     Jaap Rodenburg                    30    SDE+      X       15 yrs    100          2021                   Under construction
   NL     A16                               20    SDE+      X       15 yrs    100          2022                  Construction started
   SE     Blakliden + Fäbodberget          353    Certs    N/A        -        30          2022                   Under construction
   NL     Haringvliet                       38    SDE+      X       15 yrs    100          2020                Commissioning ongoing
   NL     Haringvliet                       12    FCR*                        100          2020                Commissioning ongoing
In construction                          3,187
                                                                                                      Vanguard positive consent achieved 1st July;
   UK      Norfolk projects               3,600    CfD              15 yrs     100      2027-2029
                                                                                                     Boreas DCO Examination extended until Oct-20
                                                                                                        Geotechnical Site Investigation Offshore
   DK      Vesterhav                      344      FIT       X     50.000hrs   100      2023/2024
                                                                                                                finalized, tests ongoing
   SE    Grönhult                           67    Certs     N/A       -        100        2023                       In development
   NL    Windplan Blauw                     57    SDE+       X      15 yrs     100        2023                       In development
   NL    Ny Hiddum Houw                     14    SDE+       X      15 yrs     100        2021                     Preparing for FID
   DE    Kögel cluster                      28    EEG       (X)                100        2021                      Conditional FID
In development (in mature stage)        > 4 GW

* FCR - Frequency Response Regulation                                                                                                                            31
Investor Relations contacts

Johan Sahlqvist                                Tobias Sjöberg                            Emmi Östlund

Head of Investor Relations                     Investor Relations Officer                Investor Relations Officer

        +46 8 739 72 51                                 +46 8 739 60 63                          +46 8 739 69 24

        johan.sahlqvist@vattenfall.com                  tobias.sjoeberg@vattenfall.com           emmi.oestlund@vattenfall.com

      Investor webpage / Financial reports & presentations

Financial calendar
4 February 2021     Year-end report for 2020
29 March 2021       Annual and Sustainability report 2020
29 April 2021       Interim report January-March 2021
20 July 2021        Interim report January-June 2021
                                                                                                                                32
You can also read