VATTENFALL PRESENTATION - Analyst meeting SEB 2017-09-28
←
→
Page content transcription
If your browser does not render page correctly, please read the page content below
VATTENFALL PRESENTATION
     Analyst meeting SEB 2017-09-28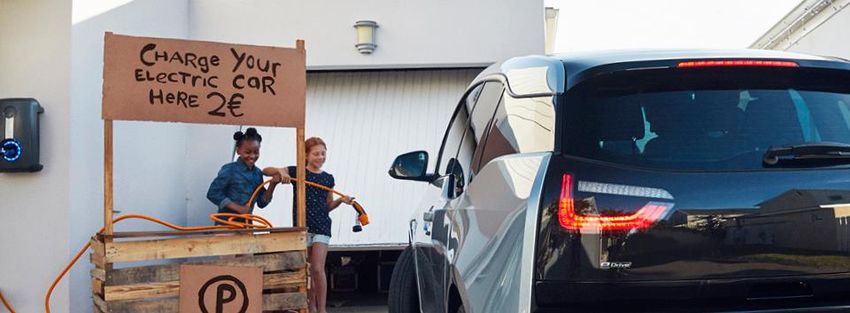
WE EXIST TO…

                                                                Power
                                                               Climate
                                                               Smarter
                                                                Living

Vattenfall will help customers reduce the need for fossil fuels and enable the next generation to live fossil free. This is the core of
Vattenfall’s new guiding principle for the future that has now been presented by the Group management.

                                                                                                                                          2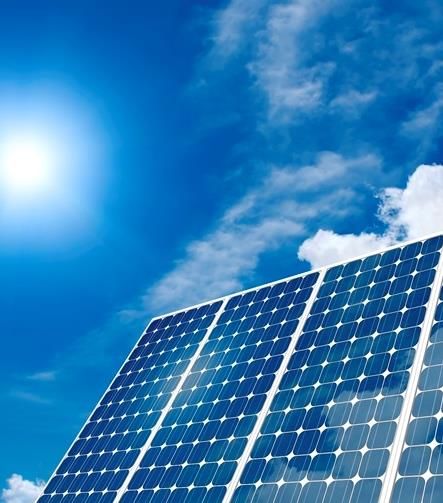
VATTENFALL AT A GLANCE
• One of Europe’s largest producers of electricity and                              Vattenfall’s total electricity
  heat                                                                              production in 2016: 119.0 TWh
                                                                                                                                           Finland           0.4

• 100% owned by the Swedish state
                                                                                                                                           Hydro power       0.4

                                                                                                                      Sweden        80.0
• Main products: electricity, heat, gas, energy services                                                              Biomass, waste 0.3
                                                                                                                      Wind power      1.0
                                                                                                                      Nuclear power 46.9
• Main markets are Sweden, Germany, Netherlands, UK,                                                                  Hydro power    31.8

  Denmark and Finland
                                                                                       UK               2.0
                                                                                       Wind power       2.0                   Denmark         1.0
• 20,000 employees                                                                                                            Wind power      1.0

                                                                                                    Netherlands        15.2
                                                                                                    Wind power          0.4            Germany               20.6
                                                                                                    Fossil-based power 14.7            Biomass, waste         0.5
                                                                                                    Hydro power         0.1            Wind power             1.5
                                                                                                                                       Fossil-based power    16.1
                                                                                                                                       Hydro power            2.5

        Net sales in 2016:                                Underlying operating
           SEK 139bn                                    profit1 in 2016: SEK 22bn                    Hydro power        Fossil-based power          Biomass, peat, waste
                                                                                                     Nuclear power      Wind power
                                                                                                                                                                           3
1) Operating profit (EBIT) excluding items affecting comparability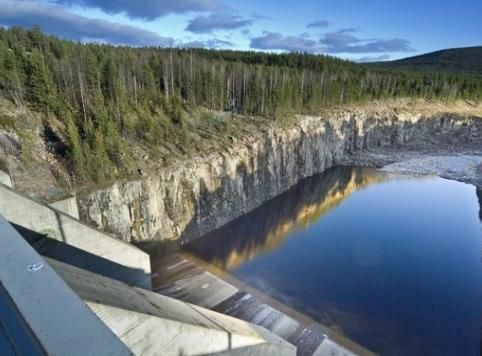
A NEW VATTENFALL IS TAKING SHAPE
A new Vattenfall is taking shape, both from a strategic and financial perspective.

Vattenfall has moved from a heavy fossil-                             … and are further moving towards more
based production towards a more                                       quasi-regulated business with more
sustainable portfolio in 2016                                         limited risk exposure going forward
       Vattenfall production mix 2015-2016                                 Vattenfall future value pools - EBITDA

                                             Fossil-based power

                                 29%         Nuclear power                                          ~30%     Non-regulated
                                             Hydro power                     ~43%
            52%                              Wind power
                                             Biomass and waste
                                 33%
                                                                                                    ~47%     Quasi-regulated
                                                                             ~32%
            19%

                                 33%
            24%
                                                                             ~25%                   ~23%     Regulated
                   4%                   5%
       1%                   1%
                                                                             2015                   2020
            2015                 2016

                                                                                                                               4
STRATEGY AND STRATEGIC TARGETS
Vattenfall is well on track to meet its strategic targets until 2020
                                                                                                                              30 June
Our strategic objectives and prioritised areas                     Strategic targets to 2020                                   2017
  Increase customer                       Grow in renewables,        1   Customer engagement, NPS +2 (Net Promoter Score)      +3
  centricity and build                       maintain efficient
  a sizable position                        operations within
                                                                     2   Aggregated commissioned new renewables capacity       597
  in decentralized                          hydro and nuclear
  energy                                                                 2016-2020: ≥2,300 MW
                                                   power and
                                                   implement
                                                      our CO2        3   Absolute CO2 emissions, pro rata, continuing          11.8
                                                     roadmap             operations: ≤21 Mtonnes

                                                                     4   ROCE: ≥9% (continuing operations)                     4.2

                                                                     5   Safety as LTIF (Lost Time Injury Frequency): ≤1.25    1.3

  Develop culture,                    Reduce costs and improve       6   Employee Engagement Index: ≥70%1                       …
  competence and brand                    operational efficiency

 1) Only updated on an annual basis                                                                                                     5
OUR CONTRIBUTION TO UN’S SUSTAINABLE
DEVELOPMENT GOALS
Vattenfall focuses on six of the 17 sustainable development goals on a group level. On a local level, we are also contributing
to five additional sustainable development goals1.
                        • Vattenfall operates 2.8 GW of                      • Enabling our customers to produce and
                          renewables capacity as of H1 2017                    consume their own renewable energy
                        • Strategic target to commission 2.3 GW              • Launch of Powerpeers to trade locally
                          of new renewables capacity 2016-2020                 generated renewable electricity

                        • Charging solutions for electric vehicles           • Vattenfall aims at being climate neutral
                        • Zero-CO2-cement with Cementa, Fossil-                by 2050 and by 2030 in the Nordics
                          free-steel with SSAB and LKAB, Green               • Contributing to electrification of
                          hydrogen with Preem                                  transportation, heating and the industry

                        • City partnerships with Uppsala, Berlin,            • Vattenfall is active in partnerships with
                          Hamburg and Amsterdam to help                        both cities and corporates
                          achieve ambitious climate goals

  1) Gender equality, clean water and sanitation, decent work and economic                                                 6
  growth, life below water and life on land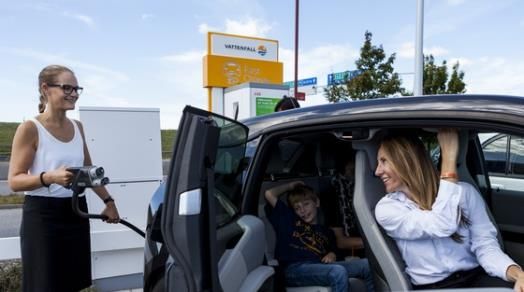
CHALLENGING MARKET CONDITIONS, BUT…
    Challenging market conditions with depressed electricity prices has lead to impairments

     Front year contract price (EUR/MWh)                                                               Total impairments of SEK 160.3bn

    EUR/MWh                                                                                       SEK bn
                        China induced
                      commodity boom                                Increase of German            40
    100                High fuel prices                                                                                                                             36.3
                                                                   renewables, dropping
                                                                      CO2 prices, lower           35                                                                       32.9
     90
                                                                          demand                                                              30.1
                                 Financial crisis                                                 30
     80
                                                     Fukushima                                                                                                      19.3
     70                                                                                           25                                                  23.8
                                                                               Low coal prices,
     60                                                                                           20                                                  8.3
                                                                                strong hydro                                                  22.0                         28.9
     50                                                                            supply
                                                                                                  15                               12.3
                                                                                                                            10.9
     40                                                                                                            9.8       0.7                      10.0
                                                                                                  10
     30                                                                                                            4.3             8.6                              17.0
                                                                                                  5        4.2              10.5              6.6                              0.4
     20                                                                                                                                               2.5
                                                                                                           4.1 0.1 5.5             3.7                3.0                  3.5 0.1
                                                                                                  0                         -0.3              1.5                   0.0
     10

      0                                                                                           -5
       2007   2008   2009   2010       2011         2012    2013    2014     2015     2016             2009       2010      2011   2012       2013    2014          2015   2016

                              Germany                      Nordpool SYS                                           Thermal assets   Goodwill                 Other
                                                                                                                  Nuclear          Renewable assets
                                                                                                                                                                                     7
Source: EEX
…STABILISED FINANCIAL DEVELOPMENT
After several years of challenging market conditions leading to recognition of substantial impairment losses and pressure
on profitability, profit levels have now stabilised
Sales and underlying EBIT                                          Earnings and return                                                     Debt
SEK bn                                                    SEK bn   SEK bn                                                             %    SEK bn                                                  %

200                                                           30   200                                                            10        200                                                   80

                                                              25
                                                                   150
150                                                                                                                               5         150
                                                              20                                                                                                                                  60
                                                                   100
100                                                           15                                                                  0         100
                                                                    50
                                                              10                                                                                                                                  40
 50                                                                                                                               -5         50
                                                                     0
                                                              5

   0                                                          0     -50                                                           -10         0                                                   20
         2012      2013       2014          2015   2016                     2012       2013       2014       2015       2016                        2012     2013      2014         2015   2016
                Net sales (scale on left)                                   Profit for the year attributable to the owners of the parent               Net debt
                Underlying EBIT (scale on right)                            Return on capital employed (%)                                             Adjusted net debt
                                                                            Return on capital employed, excluding IAC (%)                              Debt/equity ratio, net (%)

                                                                                                                                                                                                   8
THE ENERGY AGREEMENT – POSITIVE FOR
VATTENFALL
         Targets                                       Nuclear                          Hydro                                 Renewables
• Target of 100% renewable                  • Capacity tax1 abolished over     • Real estate tax2 reduced to         • El-certificate system prolonged -
  production by 2040 (annual                  two years beginning 2017           same level as other power             18 TWh added 2020-2030
  production level corresponding            • Adjustments to changes in          plants (from 2.8% to 0.5% over      • Connection charges for offshore
  to domestic demand)                         Nuclear Waste Fund payments        a four year period starting 2017)     wind discontinued
• Sweden should have zero net                 under investigation              • Expansion of hydro power            • Facilitation of small-scale
  emission of GHG by 2045,                  • No “political phase-out” of        should in first hand occur trough     production and services for
  implying further electrification            nuclear                            capacity increases in existing        energy efficiency, storage and
• A target for energy efficiency                                                 plants. “Nationalälvarna” still       sales of power
                                            • Permission to replace reactors     protected.
  for 2020-2030 to be set                     at existing sites can be given

                                      The energy agreement enables Vattenfall to take the lead in the
                                        transformation to a sustainability energy system in Sweden

  1 & 2: Approx. SEK 3 billion respectively for Vattenfall in 2015
                                                                                                                                                   9
WE ARE RESHAPING OUR ASSET BASE TO
MEET NEW MARKET REQUIREMENTS                                                                                                        Commodity sales and
                                                  Central                                                    Wholesale                 decentralized
                                                Production                         Grids                      markets                    solutions

Grow                                     • Wind                          • Regulated                      • Trading                   • Electricity retail
                                         • Solar                         • Non-regulated                  • Aggregation               • Decentralized
✓   Customer attractiveness
                                         • District heating              • Services                         Optimization                solutions**
✓   Long term viability
                                                                                                            Marketing
✓   Strong Vattenfall capabilities
✓   Attractive returns

Keep and develop                         •   Hydro
                                         •   Nuclear
✓ Long term viability                                                                                                                 • Gas retail
                                         •   Gas condensing
- Limited growth opportunities           •   Hard coal CHP *
Non core
- Limited long term viability            • Hard coal
- Not supporting the transition          • Lignite

                                * Hard coal CHP to be converted to gas end of economic life time **E.g. aggregation services, heat pumps and solar panels
                                                                                                                                                             10
Vattenfall Capital Markets Day, 19 September 2016
SIGNIFICANT GROWTH IN RENEWABLES
A total of 2.8 GW are now in operation. With a further ~2 GW in development and construction or awarded,
Vattenfall is well on track meeting its strategic long-term target on renewable capacity growth.
Other
Highlights H1 2017
Norfolk Vanguard2
✓ Commissioning of UK-onshore wind farms
Norfolk Boreas3
Pen y Cymoedd (228 MW) and Ray (54 MW)
~5.0 GW
in development and Sandbank in Germany (288 MW)
Thanet Extension
Sandbank Plus ✓ Investment Decision Slufterdam (29 MW)
Strategic target:
2.3 GW commissioned Hollandse Kust ✓ Newly established business unit (within BA
renewables capacity
2016 - 2020 South Kyle Wind) for PV and Batteries to increase
Other
1.6 GW growth in those areas
Danish Kriegers Flak in development
Wieringermeer
and awarded ✓ More than one third of all capex in the first
Danish Near Shore half of 2017 was invested in new
2.3 GW Aberdeenen Slufterdam 0.5 GW
Horns Rev 3 in development renewables (wind, solar, biomass), in total
Other and construction SEK 2.7 bn
Pen y Cymoedd
Ray
Sandbank 2.8 GW
2.2 GW installed capacity
1) Danish Kriegers Flak expected commissioning 2021
2) Commissioning expected in 2025-2027
3) Commissioning TBD
2015 2016-2020/20211 2021-2025
11ELECTRIFICATION IS AN ENABLER FOR
SOLVING THE CLIMATE ISSUE
Vattenfall aims to play a leading role given our strong position in heating, renewable generation and our “Nordic”
heritage coming from a low-emitting region
Electrification of the transport sector Electrification of heating Electrification of the industry
▪ Supports e-mobility growth with ▪ Energy efficiency achieved by switching ▪ Greater use of electricity by industry
resulting reduction of CO2 as well as from gas, oil or electric boilers to heat can lead to fossil free steel, green
solving pollution and noise issues pumps or district heating concrete and boost the production of
▪ Power to heat is an attractive solution non-fossil diesel
to reduce the cost of heating
12ATRACTIVE PARTNER IN THE ENERGY
TRANSITION
13GROWING IN BOTH LARGE SCALE AND
DECENTRALISED SOLAR PV
Growth strategy in solar decided in Q1 Strategic fit with Vattenfall’s purpose and
2017, consisting of two pillars strategy
1. Decentralized solar PV & storage ✓ Solar PV powers climate smarter living
Offering solutions for commercial and
✓ Substantial experience in solar PV and
residential customers. Besides winning
storage already gained
new customers Vattenfall will also
leverage the existing customer base of 6 ✓ Attractive growth in our main markets,
million. notably the Netherlands
2. Large-scale solar ✓ Leverage on synergies by installing solar
Installing solar PV at our wind farms or PV at existing wind farms by using joint
other existing sites offers synergies from grid connection, infrastructure etc.
using joint grid connections and
infrastructure.
14INDUSTRIALISATION DRIVES COSTS AND
REVENUES TO SUSTAINABLE LEVELS
Decreasing revenue levels1 Key takeaways
• The industrialisation of offshore wind is rapidly changing the
competitive environment
• Winning bid levels of 372 DKK/MWh (Vattenfall – Danish
Kriegers Flak) and 54.50 EUR/MWh (Shell consortium –
Borssele 3/4) considered new industry benchmarks
• Offshore wind is experiencing a learning curve similar to other
renewable technologies, from learning to fine-tuning
• The development over the last years ensures offshore wind a
long term position in the energy production mix, with benefits
for the customers/consumers and the most competitive
operators
Vattenfall’s competitive advantage is based on three pillars: fast adaptation to the tender landscape,
ability to decrease O&M costs applying latest business standards, lean and agile organisation set-up
1. Figures are only considering revenue streams and are not scope-
adjusted, e.g., UK OFTO and grid charges. This might lead to 5-15% 15
correction factor, which does not question the trend as suchVATTENFALL HEAT IN NUMBERS
Highlights
Financial development (SEK bn)1 Key data
▪ Solid, semi-regulated,
revenue streams Net Sales EBITDA Underlying EBIT >2m end customers
28.4 measured in dwelling equivalents2
▪ A growing customer base 27.8 27.3
with low churn
▪ An accelerating contribution Growth by 50k new customers
to climate smartness in 2016
▪ An established platform to
tap into new decentral heat 5.6 5.7
7.1 20.3 TWh Heat sold
businesses 2.4 1.8
3.2 in 2016
2014 2015 2016 3,790 employees
in 2016
Vattenfall is a European leader in district heating
1 Including condensing 16
2 Based on average household heat consumptionTHREE CORE MARKETS WITH DIFFERENT
CHARACTERISTICS
Market characteristics Germany Netherlands Sweden
(all market players)
Total (space) heating market size (TWh)1 712 203 83
Dominating fuel gas/coal/waste gas/waste wood/waste/el.
no gas grid
Share of renewables in District Heating (DH)1 10% 1% 68%
Average customer heat price €ct/kWh 8 10 7
Number of customer equivalents 1,7m 210k 230k
Vattenfall’s market position #1 #1 #3
Growing Young Mature
German market Dutch Market Swedish market
A well balanced market mix allows Vattenfall
to capitalize on growth opportunities
1 Source: Vattenfall analysis 17HEAT: POTENTIAL FOR PROFITABLE GROWTH
Residential heat market structure1 Our (current) footprint Sweden – mature DH market
▪ Strong growth in metropolitan areas expected (esp. Stockholm, Uppsala)
100% 100% 100% ▪ District heating providing CO2-free base supply, heat pumps taking
4% 2% larger market share
49% 30%
Netherlands – young DH market
86% ▪ Strong growth in Amsterdam and surroundings (+6% p.a.)
▪ Ambition to replace gas by 2050; an opportunity for district heating
30% 52% growth
12% ▪ District heating with high usage of third party heat sources (waste, etc.),
4%
growth of heat pumps
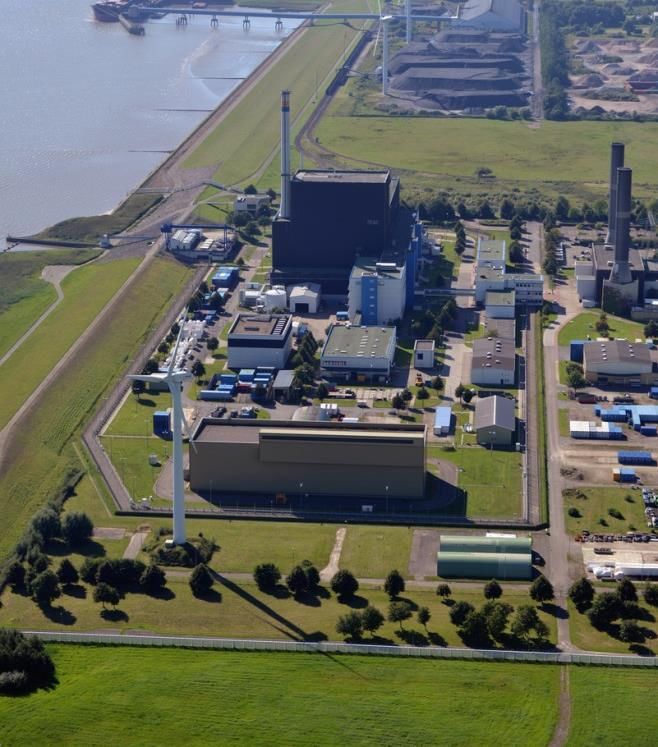
Netherlands Germany SwedenPOSITIVE DEVELOPMENTS IN GERMAN NUCLEAR OPERATIONS IN H1 2017 Vattenfall has significantly reduced its business risks related to German nuclear operations Four positive developments ✓ EU has approved the new law regarding obligations for interim and final storage of nuclear waste ✓ SEK 17.2 bn payment made on 3rd July (event after Q2) to the public fund, thereby releasing Vattenfall from obligations for interim and final storage of nuclear waste ✓ De-fueling of the nuclear power plant Brunsbüttel: 300 MSEK provisions released ✓ Decision of German constitutional court: SEK 1.8 bn nuclear tax refund for the 20%- share in nuclear power plant Brokdorf ➢ Note: Decision unrelated to the arbitration proceedings at the ICSID1, where a decision is expected later in 2017. 1) ICSID: International Centre for Settlement of Investment Disputes (ICSID) 19
You can also read


