Vegetation Extraction from Free Google Earth Images of Deserts Using a Robust BPNN Approach in HSV Space
←
→
Page content transcription
If your browser does not render page correctly, please read the page content below
ISSN : 2278 – 1021

        International Journal of Advanced Research in Computer and Communication Engineering
        Vol. 1, Issue 3, May 2012

    Vegetation Extraction from Free Google Earth Images of
     Deserts Using a Robust BPNN Approach in HSV Space
                                                        Mohamed H. Almeer
                                            Computer Science & Engineering Department
                                                            Qatar University
                                                             Doha, QATAR
                                               almeer@qu.edu.qa, almeerqatar@gmail.com

ABSTRACT— The high resolution and span diversity of colored Google Earth images are the main reasons for developing a vegetation
extraction mechanism based on BPNN (Back Propagation Neural Networks)that can work efficientlywith poor color images. This paper
introduces a method based on neural networks that can efficiently recognize vegetation and discriminate its zone from the desert, urban,
and road-street zones that surround it. Our method utilizes a large number of training images extracted from 10’s of images containing
random samples from the same area of Google Earth. We then use the multi-layer perceptron, a type of supervised learning algorithm, to
learn the relation between vegetation and desert areas based only on color. The proposed method was verified by experimentation on a real
Google Images sequence taken for Qatar. Finally justified results were produced.
Keywords—Remote sensing, neural networks, BPNN, digital image processing, classification, HSV color space

                                                                      production, which tremendously boosted its economy. Qatar
                         I. INTRODUCTION                              has now witnessed an appreciable expansion in agriculture,
    Research efforts on the current global climate change crisis      constituting a noticeable “agriculture biodiversity” that
 require that Earth's surface be assessed and monitored.              requires consideration. Thus, the monitoring of the coverage
 Scientists started three decades ago to study and monitor            and spatial distribution of vegetation and agricultural areas of
 vegetation using satellite remote sensing images. It has been        Qatar is becoming important to assist development studies.
 shown that the information taken from these images is of great          Although the total land area of Qatar mostly comprises
 importance for managing natural resources. Vegetation                deserts, and its vegetation is closely related to its geography,
 provides a food source for living beings and plays essential         geology, topography, soil type, and climate, some different
 roles in affecting global climate change. It can be seen that the    vegetation zones can be found where trees, reeds, and shrubs,
 variability of ecological change and other natural effects on        such as tamarind, phragmites, and mace (types of plantation),
 the environment are caused by vegetation changes.                    can grow. These regions are mostly to the east, near the coast.
    Vegetation mapping and classification also present valuable       A few attempts have been made to monitor vegetation in
 information to aid our understanding of the natural and              Qatar relying solely on satellite imagery.
 manmade environments through quantifying vegetation cover               For efficient vegetation recognition, we need a robust
 at a given time point or over a continuous period. High              algorithm that is effective despite the poor RGB colors of
 priority has been given to acquiring updated data for                Google Earth and satisfies two requirements: robustness
 vegetation cover changes frequently or annually to allow a           against confusion with other zones that are close in color, and
 better assessment of the environment and the ecosystem.              the ability to learn from samples, improving its learning with
 Further, it is critical to obtain the current states of vegetation   the increase in samples. The usual RGB color system does not
 cover for an area of interest in order to initiate constructive      fulfill both of these requirements; however, a solution based
 environmental measures, such as vegetation protection and            on neural networks assisted by HSV/I (Hue, Saturation, and
 restoration, which leads to plant habitat conservation. Some of      Value or Intensity) coloring can. Our method does not rely on
 the general benefits of monitoring vegetation are that it            assigning minimum and maximum color limit values for each
 provides an indication of ecological changes, estimations of         category or class for recognition purposes but rather on
 desertification levels accumulated over time, an indication of       collecting a large number of samples selected for each
 water concentration in soils, and finally, identification of the     category as an indication of color variations. We selected
 effects of climate variability and other natural phenomena on        images of urban areas, scattered farms, and loose desert
 the environment.                                                     vegetation as the target scope of this study.
    Qatar was in a stage of rapid development and growth
 during the 1970s and 1980s because of its increasing oil

  Copyright to IJARCCE                                     www.ijarcce.com                                     134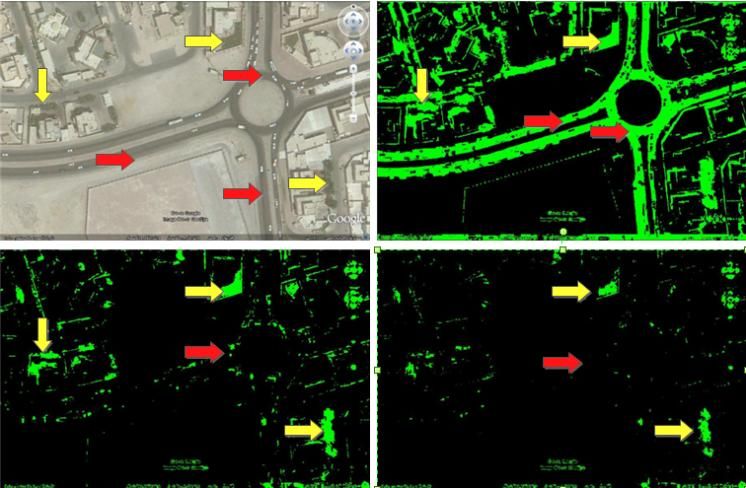
ISSN : 2278 – 1021
International Journal of Advanced Research in Computer and Communication Engineering
Vol. 1, Issue 3, May 2012
color separation methods using fuzzy membership for feature
implementation and ANN for feature classification. He
applied an HLS color coordination system in a harness
assembly recognition system. The ANN implementation was
helpful in this study. In [4], the author used ANN multilayer
perceptrons to detect street lane colors under several nonlinear
changes in different illumination conditions. Although using
the blue and green components of the ordinary RGB color
coordinate system, he obtained excellent results in real-time
driving conditions.
We have therefore decided to use ANN for the detection
and classification processes and apply them on Google Earth
free satellite images of the state of Qatar. The HSV subspace
of a coloring system proved useful as it mimics the natural
human vision process. The contribution of this study is two-
fold. First, it increases the research done on vegetation
detection for Qatar deserts, which at present is scarce, and
second it uses the HSV coloring coordinate with BANN for
color separation and classification.
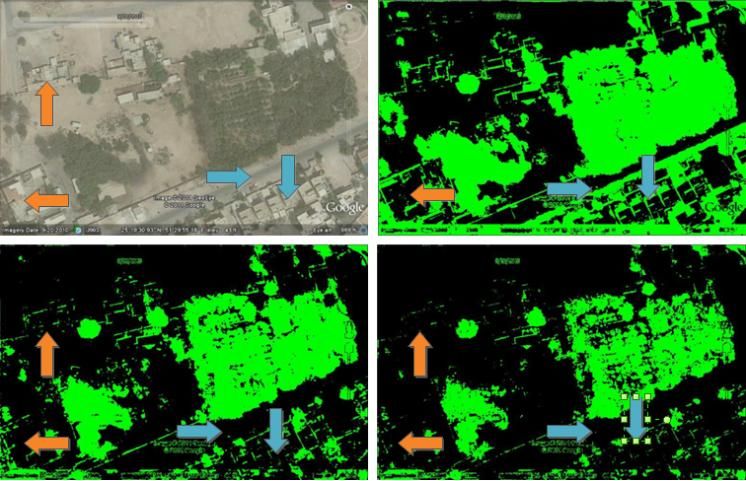
Figure 1. Google Earth Images for different landscape of Qatar showing
scattered and manmade vegetation III. VEGETATION EXTRACTION
In the HSV color space, colors are specified by the
To classify each pixel into one of three zones, seven components of hue, saturation, and value. We use the
parameters related to the color of a target pixel and of its eight subspace of HSV/I (Hue, Saturation, and Intensity or Value)
surrounding pixels were used: H value, S value, I value, mean that is extracted from the RGB space. Conversion from RGB
of H values, standard deviation of H, mean of S values, and to HSV is performed in each pixel for all test images by
the standard deviation of S for the surrounding eight pixels.
The H and S components were highly valued for their color
categorization as they convey the origin of the real color,
cancelling the effects of luminance and brightness. Luminance
and brightness can differ according to the lightning
environment. Fig. 2 shows the HSV coordinates for colors.
Section I gives the introduction of the Vegetation extraction ( )
process and how it is useful for diverse number of applications √
including the ecological change and desertification. section II { }
summarizes some useful related works. Section III shows teh
technical background of the HSV mapping which this study
relies on. Section IV summarizes Google Earth which is a true ( )
global earth image library archive and how has been decided
to have its images for the scope of this study. Section V shows The resultant value of H lies between [0, 1] after
the nature of the problem and details the solution steps while normalization. Hence, all three components of HSV will lie
section VII throws some light on the BPNN the supervised within the interval [0, 1]. Since the H component is computed
classification technique used. The performance of proposed at angle intervals between 0° and 360°,the RGB space cube
technique is the topic of section VIII. Section IX concludes unit is mapped into a cylinder with height plus radius of
the paper and followed by the references. length 1 as shown in the next figure.
II. RELATED WORKS
In [1] and [2], the author presented a complete high-
resolution aerial-image processing workflow for detecting and
characterizing vegetation structures in highly dense urban
areas. He depended on spectral indices and an SVM classifier.
Another article [3], although not directly related to satellite
image analysis, treated the recognition of natural colors using
computer-based algorithms. The author proposed improved
Copyright to IJARCCE www.ijarcce.com 135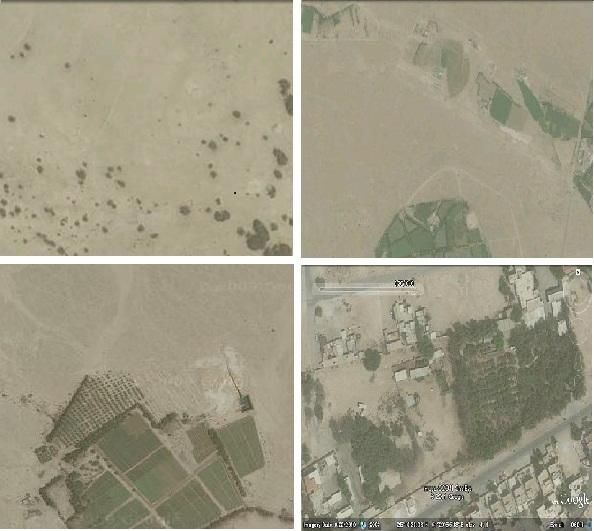
ISSN : 2278 – 1021
International Journal of Advanced Research in Computer and Communication Engineering
Vol. 1, Issue 3, May 2012
sub region in all the inspected images gave satisfactory
Figure 2. H-S-V Coloring coordinate results. The user selected approximately 20 to 25 2020-pixel
In contrast to the traditional representation, all HSV points sub-images for each of the three classes to be used in the
within the cylinder correspond to valid RGB color training phase. We inspected tens of Google Earth images of
coordinates. Mapping from RGB to HSV is non-linear. the desert surfaces of Qatar. Although simple in nature, this
procedure showed excellent results for training as will be
shown in the results and experimentation section. We tried to
IV. GOOGLE EARTH cover as many different areas as possible of the Qatar deserts
Google Earth is a popular free Internet application that where vegetation exists so that diversity would be guaranteed.
provides a library of satellite imagery and aerial photography Fig. 3 shows some different vegetation scenes scattered
of the entire Earth's surface, thus supplying integrated across desert areas, on which the 2020-pixel sample regions
coverage and monitoring images. Before high-resolution are imposed for clarity's sake. It also shows street and desert
satellite imagery was developed, the availability of metadata areas. The red and blue squares indicate the areas from which
was costly and scarce. However, the required satellite images the sample region was taken, while the arrows indicate their
are now free and offered on some sites and locations on the different locations. Note that in the left image sample squares
Internet, from which we chose Google as our study source. An cover vegetation as well as desert surface, in the middle image
obstacle to downloading high-resolution satellite images used sample squares cover only manmade vegetation, and finally in
to be the slow speed of data transfer. The images were also the right image sample squares cover both street and desert
unavailable for the public. High-speed internet has made the areas.
process of downloading images much faster for ordinary
users.
To enhance the appearance of Google Earth images, they
are extensively processed in stages: color balancing, warping,
and finally, mosaic processing. Google Earth images contain
information from only three visible bands, so they are limited,
especially in comparison with other satellite images such as
those of “Landsat.” Although this is a drawback, the images
give excellent visual information of vegetation distribution in
such a way that landmarks, vegetation, and shores are easily
recognized.
For Qatar, the quality of images offered by Google Earth is
quite good. They provide information on roads, vegetation, Figure 3. Sample extraction procedure from Google Earth images. The left
urban areas, and seashores. (See Figs. 1 and 3) image shows desert area with scattered vegetation; the sampled areas are
indicated by white arrows. The middle image shows man-made vegetation.
V. DESERT-ROAD-VEGETATION COLOR PROBLEM The right image shows streets landscape with some desert samples. Note that
It is clear on inspection that in order to judge whether they the red and blue squares show 20×20-pixel sample images.
belong to the desert or vegetation class, images collected from The HSV subspace is always considered because it gives
Google Earth require a supervised or non-supervised truer color information, cancelling the effects of brightness,
classification method based on pixel colors. Since the and is closer to real human recognition of colors than is the
surrounding pixels surely give some indication concerning the RGB subspace. We therefore decided to implement the HSV
nature of the target pixel, including these in the classification coloring system. We particularly highly valued the H and S
process makes it more accurate. We decided to use a components after conversion from RGB, and relied on them as
supervised BPNN method because we considered it quite the two dominant properties for distinguishing land versus
capable of efficient discrimination. For any supervised vegetation, as will be seen in next section.
classification method, a large number of training samples is All the collected regions are converted from the RGB color
needed to achieve the best recognition results. subspace to the HSV color subspace, pixel by pixel. As
Another issue that emerged in the design phase was that of mentioned previously, we chose only two components of the
selecting the image from which to take the samples, and,in HSV space, namely the H (Hue) and the S (Saturation) for
addition, having chosen an image, selecting the area from each pixel and ignored the V (Value) component. Fig. 4 shows
which the 20×20-pixelsample window should be extracted and the distribution of all pixels in all training images when
saved for the training phase. mapped into a 2-dimensional chart whose x-coordinate
These particular questions were solved using a simple represents the Hue value [0, 1] and y-coordinate represents the
individual image inspection process based on a user's vision Saturation value [0, 1].
alone. Employing a highly trusted user to identify the required
Copyright to IJARCCE www.ijarcce.com 136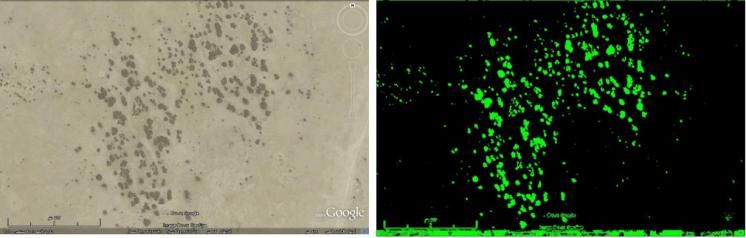
ISSN : 2278 – 1021
International Journal of Advanced Research in Computer and Communication Engineering
Vol. 1, Issue 3, May 2012
Hue Value HHSV
Saturation Value SHSV
Intensity Value VHSV
Standard Deviation for pixel σH
and surrounding 8 pixels (H
values)
Mean for pixel and surrounding AVGH
8 pixels (H values)
Standard Deviation for pixel σS
and surrounding 8 pixels (S
values)
Mean for pixel and surrounding AVGS
8 pixels (S values)
For each pixel that is processed in a 20×20-pixel region,
eight pixels surrounding the target pixel are also selected as
Figure 4. Hue-Saturation mapping for all the 20×20-pixelcollected sample
the candidate points for the average and for the standard
images of the three classes. Upper right shows Desert H-S mapping, lower left
shows Road-Streets mapping, while lower right shows Vegetation mapping deviation computation process. This decision was reached
because each pixel is more likely to settle in a class if its
From this chart, it can be seen clearly that the separation neighboring ones are close enough to the same class.
between Vegetation and Desert areas is clear, while the Road- This process continues until all pixels within one sampling
Streets mapping is more deeply overlapped with Desert color region have been processed. Region after region, we
mapping. We therefore decided to combine the latter two obtain a matrix of 400 rows with 7 columns representing
classes into one, called the Desert-Street-Road class. Other related color properties. In detail, for a single row in a file, the
mapping functions may be able to discriminate between desert average and standard deviations are registered for each of the
and street by color, relying on other coordinates. However, for H and S color components for each pixel, together with those
our study, it was sufficient to separate the colors of vegetation for the eight surrounding pixels. In addition, the H, S, and V
from all others. Our motivation was our intention to focus on components are inserted in the text file as well. Finally, we
extracting vegetation from other different classes. Therefore, obtain a 2-dimensional array that has seven columns: average
based on this observation, when mapping pixel colors to the and standard deviation for the H and S components, and the
H-S chart, we assumed the separation would be easily pixel H, S, and V components.
achieved through a supervised classification algorithm such as We chose only 25 sample zones for deserts, 20 for
that offered by BPNN. vegetation, and 15 for streets. We decided not to continue
For each of the400 pixels of the 2020-pixel sample training with a larger number of sample images since the
regions, we compute the seven different statistical values that vegetation detection results was already satisfactory, as will
are estimated to reflect the color property of each pixel be shown in the section on experimentation results.
separately when the surrounding eight pixels also exhibit
similar color effects. Table I shows the seven statistical values
computed for each pixel. The values that are generated are
collected in a text file. This step is repeated for all the image
training zones, Vegetation, Desert, and Road-Streets.
TABLE I.
STATISTICAL PROPERTY TAKEN FOR CLASSIFICATION
Pixel Statistical Property Symbol
Copyright to IJARCCE www.ijarcce.com 137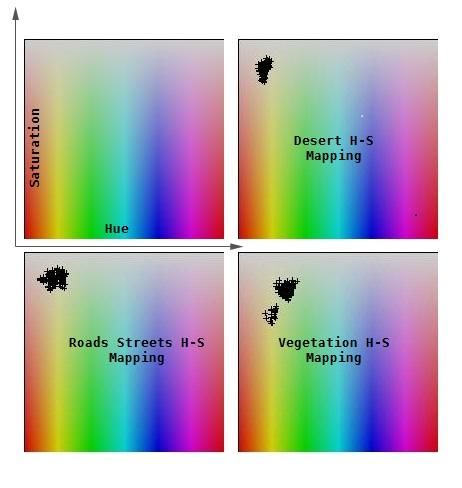
ISSN : 2278 – 1021
International Journal of Advanced Research in Computer and Communication Engineering
Vol. 1, Issue 3, May 2012
training the network in order to classify any new satellite
image that is presented. The network parameters are shown in
Table 2. The network output is based on two channels, one for
the desert class and the other for the vegetation class, each
with a value between 0.0 and 1.0.
TABLE II.
PARAMETERS FOR NEURAL NETWORKS
Type Feed Forward Back Propagation NN
Training Levenberg-Marquardt Back propagation
Function
Layers 3
Layers
Figure 5. Nine pixel point calculations to generate average and standard
deviation. The red pixel and the surrounding eight blue ones are used in
Neurons 1st 2nd 3rd
calculations of the seven statistical properties of red pixel H-S-V color. Excitation 17 15 (TAN 2 (LOG
Function Signal) Signal)
VI. JUSTIFICATIONS FOR USING ROAD-STREET SAMPLES
When only desert and vegetation color samples were The MLP network was used here because it is simple to
considered for input in our MLP network, then the output train and its input and output dimensions are easily processed.
classification performance indicated that errors in detection or Here the ANN classifier is used to classify only three zones:
classification of the Roads-Streets regions occurred. Land (mostly deserts and few urban areas), Vegetated areas,
Specifically, they were classed as Vegetation, because the and Streets plus Roads. The ANN model has three layers:
Road-Streets regions had never been considered in training. input, hidden, and output. The input layer encompasses 7
Therefore, to assist in solving the problem of separating Road- neurons to reflect the 7 statistical properties of the pixel taken,
Streets from Vegetation, we decided to add the Road-Streets the middle layer has 15 and 20 neurons, while the output
samples as a new class to be identified. When this decision layers has only 2 neurons to symbolize the 2 classes needed,
was implemented, the MLP detection was more accurate than one for vegetation alert and the other for land alert on a scale
in the first experiment when Roads-Streets were not from 0.0 to 1.0 for each. All the nodes use bilinear sigmoidal
considered in training at all. This can be seen clearly in the functions for their perceptrons, except for the hidden nodes
Results section of this paper. that use a nonlinear sigmoidal function.
VII. BPNN USED IN VEGETATION RECOGNITION
PROCESS
A few of the color zones selected for use must be learned
by the MLP network so that it learns non-linearity of color
changes.ANN is appropriate for the analysis of nearly any
kind of data, irrespective of their statistical properties.
Because ANN was successfully applied for extracting
vegetation in research studies reported in the literature, ANN
was selected as a very useful method for extracting
vegetation-type information in complex vegetation mapping
problems. One disadvantage of ANN, however, is that its
computation cost can be high, particularly when its
architectural network becomes large.
BPNN is a popular learning algorithm based on a gradient
descent method that minimizes the square error between the Figure 6. BPNN network used in research with 7 neuron for input layer, 15
network output and the target output values. The error is neurons for hidden layer, and 2 neurons for output layer.
consequently propagated back through the weights of the
Window image samples of 2020 pixels were randomly
multi layered networks until the desired error threshold is
collected from the multiple images of the surface of Qatar
reached.
supplied by Google Earth imaging. Between 20 and 25
We considered applying a multi-layer feed forward back
samples for both land zones and vegetation zones, and only 10
propagation neural network to classify colors based on
samples for the road-street zone were used at first. When
carefully selected templates of previously downloaded images
selecting the sample images, we tried to achieve the best
of deserts and vegetation areas from Google Earth, and then
Copyright to IJARCCE www.ijarcce.com 138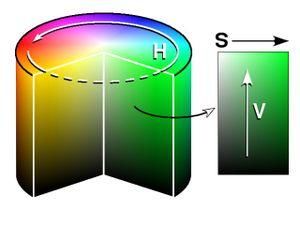
ISSN : 2278 – 1021

                  International Journal of Advanced Research in Computer and Communication Engineering
                  Vol. 1, Issue 3, May 2012

possible diversity, and therefore we experimented on different
selections of samples. Some selections of the training samples
in the early training phases consisted of 5 samples from each
category. This number was increased to a selection of 15
samples, and finally nearly 25 to 30 samples were used for
each zone. These variations were necessary as each had its
advantage in terms of the results.
   The number of hidden nodes required to achieve fast
convergence was determined during the training procedure.
This process started with choosing a small number of neurons.
The number was then increased in steps until convergence
was reached. It was found that 15 neurons are sufficient to
ensure fast conversion.
   By translating color from RGB coordinates to HSV
coordinates, we succeeded in cancelling the intensity or              Figure 7.Top left: original image of urban area with manmade vegetation
illumination differences whose source is usually different            where blue arrows point to roads and houses. Top right: binary image with
imaging environments, and hence in separating pure color              Phase 1 training where green pixels correspond to vegetation. Bottom left:
information from brightness. As MLP is used to register the           binary image with Phase 2 training. Bottom right: binary image with Phase 3
                                                                      training.
non-linearity diversity of colors for the three different classes
under consideration, it learns the non-linearity relationship
between Vegetation and Desert-Road-Street colors. To learn
such non-linearity of color changes efficiently from subject
color samples, a large number of color samples are required,
as shown in the examples in the next figure.
   Finally, the seven calculated properties are injected as an
input vector to the trained MLP, and the output, which
indicates whether the target pixel belongs to the Vegetation or
                                                                      Figure 8. Left: Original image of desert area with scattered vegetation. Right:
Desert-Street class, is checked.                                      the binary image shows green pixels that correspond to vegetation with Phase
   We can conclude that a pixel belongs to the Vegetation             3 training.
type or class if the first output bit value is> 0.6 and the second
output bit value is< 0.5. Similarly, if the first output value is <
0.5 and the second output value is > 0.6 then it will be
considered a Desert or Road-Street pixel.

          VIII.   EXPERIMENTATION AND RESULTS
   The three training phases considered: (1) only vegetation
and desert areas; (2) vegetation, desert areas, and roads-
streets, with a small number of training samples; and (3) a
higher number of training samples, which were carefully
selected so that a fast ANN training convergence would be
assured.
   Fig. 7 shows an original image of an urban area where
streets and some manmade vegetation are shown. The figure
shows the resultant binary image for the three training phases.
Fig. 8 shows scattered vegetation in the middle of deserts            Figure 9. Top left: Original image for urban area with man-made vegetation
                                                                      where blue arrows point to roads and houses. Top right: binary image with
when Phase 3 training was applied. The accuracy of the                Phase 1 training where green pixels correspond to vegetation. Bottom left:
vegetation detection is clear. Fig. 9 shows an urban area with        binary image with phase 2 training. Bottom right: binary image with Phase 3
roads and with a small area of vegetation to test the different       training.
phases. The top right binary image shows the streets that were           The level of detection error is high when applying Phase 1.
detected as vegetation areas in error.                                The bottom right binary image shows the best result, since
                                                                      almost all the road and street areas have been removed,
                                                                      leaving the small areas of vegetation almost untouched and
                                                                      correctly detected.

            Copyright to IJARCCE                                      www.ijarcce.com                                              139
ISSN : 2278 – 1021
International Journal of Advanced Research in Computer and Communication Engineering
Vol. 1, Issue 3, May 2012
IX. CONCLUSION Google Earth: A case study in the Lake Tai basin, eastern China,"
Applied Geography, vol. 32, no. 2., pp. 221-227, March 2012.
We presented an approach for vegetation detection in the [11] Google Earth Pro, WWW. E CONT ENTMAG. COM.
desert areas of Qatar that can operate successfully even in
high density urban areas. We used the HSV color coordinate,
which depends on a high level of averaging and standard
deviation calculation for eight pixels surrounding a target
pixel to capture well the color nonlinearity of the three classes
existing in deserts. BPNN, based on 3 layers of neurons with
15 neurons assigned for the hidden layer, was a useful tool for
supervised learning and classification. The performance of our
proposed algorithm was verified by careful inspection of the
resulting binary images. However, in some situations it was
very difficult for our algorithm to discriminate between urban
areas and deserts and between desert and vegetated areas.
Nonetheless, this confusion was rare, and the algorithm was
shown to be highly dependable in the detection of vegetation
in Google Earth images of deserts.
REFERENCES
[1] C. Iovan, D. Boldo, M. Cord, and M. Erikson, "Automatic extraction
and classification of vegetation areas from high resolution images in
urban areas," in Proc. 15th Scandinavian Conference on Image
Analysis (SCIA'07),2007p. 858-867.
[2] C. Iovan, D. Boldo, and M. Cord, " Detection, segmentation and
characterization of vegetation in high-resolution aerial images for 3D
city modeling, "International Archives of Photogrammetry, Remote
Sensing and Spatial Information Sciences, Vol. 37 (Part 3A), pp.247-
252, Pékin, Chine, juillet 2008.
[3] Y. Kim, H.Bae, S. Kim, K.B. Kim, and H. Kang, "Natural color
recognition using fuzzification and a neural network for industrial
applications," in Proc. Third International Conference on Advances in
Neural Networks - Volume Part III (ISNN'06),2006. p. 991-996.
[4] H.C. Choi, S.Y. Oh, "Illumination invariant lane color recognition by
using road color reference & neural networks," in Proc. 2010
International Joint Conference on Neural Networks (IJCNN), July
2010, vol., no., pp.1-5.
[5] A.A. Almhab, and I. Busu, "The approaches for oasis desert vegetation
information abstraction based on medium-resolution Landsat TM
image: A case study in desert wadi Hadramut Yemen," in Proc. 2008
Second Asia International Conference on Modeling & Simulation
(AMS) (AMS '08), 2008.p. 356-360.
[6] E. Youhao, J. Wang,S. Gao P. Yan, and Z. Yang, "Monitoring of
vegetation changes using multi-temporal NDVI in peripheral regions
around Minqin oasis, northwest China," Geoscience and Remote
Sensing Symposium, 2007. IGARSS 2007. IEEE International, vol.,
no., pp.3448-3451, 23-28 July 2007.
[7] Z. Huai-bao, L. Tong, C. Yao-ping, L. Jia-qiang, "Using multi-spectral
remote sensing data to extract and analyze the vegetation information
in desert Areas," in Proc. International Conference on Environmental
Science and Information Application Technology, ESIAT 2009. vol.3,
no.??, pp.697-702, 4-5 July 2009.
[8] A. Karnieli, and G. Dall'Olmo, "Remote-sensing monitoring of
desertification, phenology, and droughts," Management of
Environmental Quality: An International Journal, vol. 14,no. 1, pp.22 -
38, 2003.
[9] M.-L. Lin, C.-W. Chen, Q.-B. Wang, Y. Cao, J.-Y. Shih, Y.-T. Lee, C.-
Y. Chen, and S. Wang, "Fuzzy model-based assessment and
monitoring of desertification using MODIS satellite imagery,"
Engineering Computations, vol. 26,no. 7, pp.745 – 760, 2009.
[10] X. Yang, G.-M. Jiang, X. Luo, and Z. Zheng, "Preliminary mapping of
high-resolution rural population distribution based on imagery from
Copyright to IJARCCE www.ijarcce.com 140You can also read