Vehicle Fuel Efficiency - Potential measures to encourage the uptake of more fuel efficient, low carbon emission vehicles
←
→
Page content transcription
If your browser does not render page correctly, please read the page content below
Vehicle Fuel Efficiency

Potential measures to encourage
the uptake of more fuel efficient,
  low carbon emission vehicles

        Public Discussion Paper

                      Prepared by
          Australian Transport Council (ATC)
                           and
  Environment Protection and Heritage Council (EPHC)
         Vehicle Fuel Efficiency Working Group

                  With support from
              The Australian Government

                   September 2008

  Closing date for comments: 7 November 2008
© Commonwealth of Australia 2008

    This work is copyright. You may download, display, print and reproduce this material in unaltered form only
    (retaining this notice) for your personal, non-commercial use or use within your organisation. Apart from any
    use as permitted under the Copyright Act 1968, all other rights are reserved.

    Requests and inquiries concerning reproduction and rights should be addressed to
             Commonwealth Copyright Administration
             Attorney General’s Department
             Robert Garran Offices
             National Circuit
             Barton ACT 2600
    or posted at http://www.ag.gov.au/cca

    Disclaimer

    The discussion paper has been prepared by the Australian Transport Council/Environment Protection & Heritage
    Council Vehicle Fuel Efficiency Working Group.

    The opinions, comments and analysis expressed in the discussion paper are for discussion purposes only and
    cannot be taken in any way as an expression of current or future policy of the Australian Government nor any
    state or territory government. The views and opinions expressed do not necessarily reflect those of the
    Australian Government or the Minister for the Environment, Heritage and the Arts, the Minister for Infrastructure,
    Transport, Regional Services and Local Government, or the Minister for Climate Change and Water.

    While reasonable efforts have been made to ensure that the contents of this publication are factually correct, the
    Commonwealth does not accept responsibility for the accuracy or completeness of the contents, and shall not be
    liable for any loss or damage that may be occasioned directly or indirectly through the use of, or reliance on, the
    contents of this publication.

2    Vehicle Fuel Efficiency – Public Discussion Paper
Contents

Abbreviations................................................................................................................................. 4

1    Introduction ..............................................................................................................................   5
     1.1 Overview .........................................................................................................................        5
     1.2 Aim ..................................................................................................................................    6
     1.3 Scope ..............................................................................................................................      6
     1.4 Submissions ....................................................................................................................          7

2    The    Nature of the Challenge ................................................................................................... 8
     2.1    Profile of the Australian Vehicle Fleet ............................................................................. 8
     2.2    Greenhouse Emissions and the Transport Sector ........................................................ 18
     2.3    Consumer Behaviour in the Road Transport Sector ..................................................... 21
     2.4    Current Measures.......................................................................................................... 21
     2.5    Impact of Current Measures.......................................................................................... 25

3. Capacity for Improvement ..................................................................................................... 26
   3.1 The Role of Vehicle Technology.................................................................................... 26
   3.2 The Role of Fuels.......................................................................................................... 26
   3.3 Policy Measures Overview............................................................................................ 31

4    Assessment of Potential Measures ....................................................................................... 35
     4.1 Measures to Increase the Supply of Low Emission Vehicles ....................................... 35
     4.2 Measures to Increase Demand for Low Emission Vehicles.......................................... 46
     4.3 Measures to Improve Consumer Awareness ................................................................ 69

5    Conclusion ............................................................................................................................. 86

6     Next Steps ............................................................................................................................ 88

7    Your Views............................................................................................................................. 88

8    Glossary ................................................................................................................................ 89

Appendix A – Notes on CO2 Emission Scenarios for Measure 2.1............................................. 91

                                                                                           Vehicle Fuel Efficiency – Public Discussion Paper           3
Abbreviations

    ACIS           Automotive Competitiveness Investment Scheme
    ADR            Australian Design Rule
    AFCP           Alternative Fuels Conversion Program
    AfMA           Australasian Fleet Managers Association
    ATC            Australian Transport Council
    BITRE          Bureau of Infrastructure, Transport and Regional Economics
    CAFE           Corporate Average Fuel Economy
    CCP            Cities for Climate Protection
    CNG            Compressed Natural Gas
    COAG           Council of Australian Governments
    CPRS           Carbon Pollution Reduction Scheme
    EC             European Commission
    ECMT           European Council of Ministers for Transport
    EEBP           Energy Efficiency Best Practice
    EPA            Environmental Protection Agency
    EPHC           Environmental Protection and Heritage Council
    EU             European Union
    FCAI           Federal Chamber of Automotive Industries
    GRPE           Group of Rapporteurs on Pollution and Environment
    GTR            Global Technical Regulation
    GVG            Green Vehicle Guide
    GVM            Gross Vehicle Mass
    ICLEI          International Council for Local Environmental Initiatives
    IEA            International Energy Agency
    ISO            International Organisation for Standardisation
    ITF            International Transport Forum
    LEEV           Light duty Environmentally Enhanced Vehicle
    LNG            Liquefied Natural Gas
    LPG            Liquid Petroleum Gas
    MVP            Motor Vehicle Producer
    NACE           National Carbon Emissions
    NAFC           National Average Fuel Consumption
    NEDC           New European Driving Cycle
    PULP           Premium unleaded petrol
    SUVs           Sport Utility Vehicles
    ULP            Unleaded petrol/Premium unleaded petrol
    UNECE          United Nations Economic Commission for Europe
    VFE            Vehicle Fuel Efficiency
    WHDC           Worldwide Harmonised Duty Cycle

4    Vehicle Fuel Efficiency – Public Discussion Paper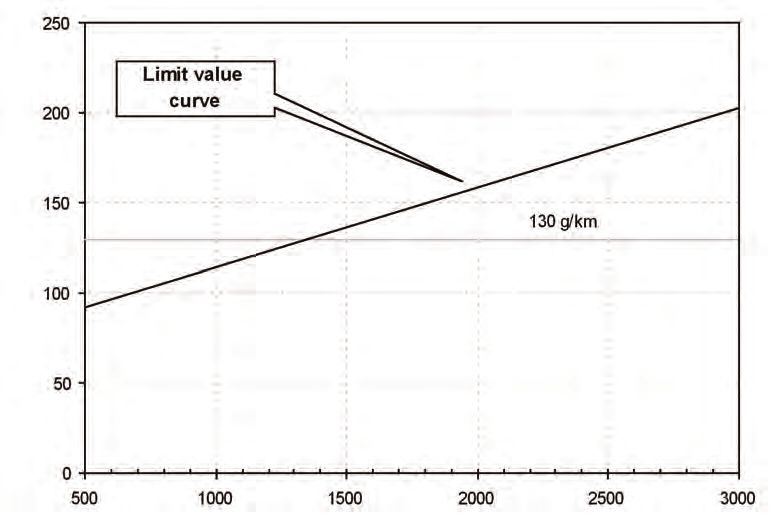
1 Introduction
1.1 Overview
At its meeting in February 2006, the Council of Australian Governments (COAG) requested the
Australian Transport Council (ATC) and the Environment Protection and Heritage Council (EPHC)
to provide a report on programs and incentives to encourage the uptake of more fuel-efficient and
low emission passenger and freight vehicles, and to provide advice on opportunities for reforms to
regulations, standards, codes and labelling requirements to improve vehicle fuel efficiency. A joint
ATC/EPHC working group prepared an initial report which was endorsed by ATC and EPHC, and
transmitted to COAG at the end of 2006.

COAG noted the report at its 13 April 2007 meeting. The then Prime Minister, as chair of COAG,
subsequently wrote to the chairs of ATC and EPHC requesting the councils to “develop jointly a
package of vehicle fuel efficiency measures designed to move Australia towards international best
practice”. In response to that request, the COAG Vehicle Fuel Efficiency (VFE) Working Group has
prepared this public discussion paper to assist in the preparation of a report to ATC and EPHC in
early 2009.

Since the commencement of the report, a number of events have occurred which are relevant to
Australia’s transport and climate change agenda, and have a material impact on a discussion of
potential measures. In late 2007, the Australian Government committed Australia to cutting
greenhouse gas emissions by sixty per cent from 2000 levels by 2050.

On 16 July 2008, the Australian Government released a Green Paper outlining a Carbon Pollution
Reduction Scheme (CPRS).1 The CPRS is expected to commence in 2010 and will be the primary
mechanism to address the market failure of uncapped greenhouse gas emissions and encourage
activities and investment to reduce emissions.

The CPRS will place a limit on the amount of carbon pollution Australia can emit through the
‘Carbon Cap’. Parties will be required to buy a ‘pollution permit’ for each tonne of carbon they
contribute to the atmosphere, providing a strong incentive to move to more greenhouse efficient
practices and technologies. The Government proposes including the transport sector in the CPRS.
The carbon price arising from the CPRS will be reflected in the price of transport fuels.

In order to give households and businesses time to adjust to the scheme, the Government will cut
fuel taxes on a cent for cent basis to offset the initial price impact on fuel, associated with the
introduction of the CPRS. The Government will periodically assess the adequacy of this measure
for three years and adjust this offset accordingly. At the end of the three year period the
Government will review this adjustment mechanism. For heavy vehicles, it is also proposed that
fuel taxes be cut on a cent for cent basis for the first year of operation of the CPRS.

It is expected there may be a need for a range of measures that complement the CPRS. These
will address market failures, facilitate the transition to the CPRS and deal with equity issues
associated with assisting low income households adjust to the CPRS.2 The Australian Government
has initiated a COAG process to assess the complementarity of existing programs and identify key
principles for future complementary measures.

Measures that focus on achieving abatement, other than the CPRS, will be assessed against the
price benchmark of the CPRS. This paper recognises the primacy of the CPRS and proposes
measures that will serve to assist the Australian transport sector to move towards best practice fuel
efficiency. The potential measures discussed in this paper will need to considered in light of the
outcomes of the CPRS Green Paper consultation process and the final design of the CPRS.

1 Australian Government, 2008, Carbon Pollution Reduction Scheme – Green Paper July 2008.
2 The Australian Government is offering a range of additional assistance measures in particular for low and middle income households, to help
   with adjustment costs and improve household energy efficiency.

                                                                                        Vehicle Fuel Efficiency – Public Discussion Paper       5
The independent review known as the Garnaut Climate Change Review was commissioned by
Australia’s state and territory governments in late 2007, to examine the impacts of climate change
on the Australian economy and recommend medium to long-term policies and policy frameworks
to improve the prospects for sustainable prosperity. Transport forms an important component of
the review as transport emissions contribute some fourteen per cent of Australia’s greenhouse gas
emissions. The Garnaut Climate Change Review Issues paper concerning transport, planning and
the built environment was prepared earlier in 2008.3 A draft report was released on 4 July 20084
and the final report is due for submission on 30 September 2008.
Another matter relevant to this report is the review of Australia’s automotive industry announced in
February 2008. This review will report on key outcomes of the current policy settings for the auto
motive manufacturing sector and evaluate the appropriateness of the Automotive Competitiveness
and Investment Scheme in the current competitive environment. The review will also make an
assessment of the challenges and opportunities currently facing the sector, including how those
challenges and opportunities might impact on the long-term viability and sustainability of the
sector including the impact of climate change and changing consumer preferences towards
low emissions and fuel efficient vehicles. The review provided a final report to Government on
31 July 2008.
1.2 Aim
The aim of this discussion paper is to present for public comment a range of potential measures
which are considered by the ATC/EPHC Working Group to offer the capacity to improve the fuel
efficiency of the road vehicle fleet. Following consideration of the public comment, the Working
Group will prepare a final report for consideration by Ministers of the ATC and EPHC.
The measures presented in this paper do not represent the position of any Government and are
being presented for evaluation and discussion purposes. Nevertheless, COAG by establishing this
Working Group has indicated a desire to consider measures that would deliver ‘world’s best
practice’ in vehicle fuel efficiency to address the problem of increased CO2 emissions from
transport, and thus this paper represents an important opportunity for stakeholders to present
their views.
1.3 Scope
Given the context of this work within the COAG Plan for Collaborative Action on Climate Change,
the Working Group has defined vehicle fuel efficiency in terms of greenhouse gas emissions per
kilometre travelled, rather than volume of fuel consumed. This enables effective comparisons
between vehicles across fuel types and the consideration of fuel switching where this leads to a
greenhouse benefit.
The Working Group has also determined that the scope of its work will:
• be limited to road vehicles, and
• focus on measures which:
– are complementary to the announced CPRS;
– improve the greenhouse emissions performance of new vehicle models relative to existing
models;
– increase the overall proportion of lower greenhouse emission vehicles in the vehicle
population;
– do not compromise the pollutant emission standards set out in the Australian Design Rules
(ADRs) for motor vehicles; and
– support delivery of improved transport greenhouse efficiency reductions in the short-medium
term (5–20 years).
3 Garnaut Climate Change Review, 2008, Issues Paper – Forum 5: Transport, Planning and the Built Environment.
4 Garnaut Climate Change Review, 2008, Draft Report – June 2008.
6 Vehicle Fuel Efficiency – Public Discussion Paper
This focus on vehicle fuel efficiency is consistent with the recent conclusions of the report to the
European Council of Ministers for Transport (ECMT) which stated that in relation to CO2 abatement
in the transport sector, “vehicle fuel efficiency measures deliver most (benefit)”.5
The scope of the Working Group’s analysis does not include potential improvements in the
operational efficiency of vehicles, such as more efficient driving behaviour and improved mainten
ance of vehicles. Measures aimed at delivering emissions reductions through travel demand
management are also outside the scope of the discussion paper, including:
• changing road conditions;
• encouraging more efficient organisation of trips;
• alternate modes of transport; and
• urban planning to reduce trip lengths.
These matters are the subject of separate consideration by ATC and EPHC.
Similarly, matters relating to tariffs and taxation issues are being addressed in other fora and are
not addressed by this Working Group. For example, the taxation of fuel is included in the
Government’s recently announced review of Australia’s taxation system and has been canvassed
in the August 2008 discussion paper (http://taxreview.treasury.gov.au).
1.4 Submissions
Comment on this discussion paper is invited from interested stakeholders and members of the
public. While comments are welcome on any aspect of the paper, readers are particularly asked
to respond to the questions in Section 4 regarding the potential measures.
All submissions will be treated as public, unless confidentiality is requested for all or part of the
submissions. The Working Group requests, however, that the scope of any material requested to
be kept confidential be limited to the minimum necessary.
Comments are requested in writing by 7 November 2008 and addressed to:
Vehicle Fuel Efficiency Consultation
c/- Department of the Environment, Water, Heritage and the Arts
GPO Box 787
CANBERRA ACT 2601
Alternatively, comments may be sent via email to: vfedpaper@environment.gov.au
Late submissions may not be accepted.
5 ECMT (2006) Review of CO 2 Abatement Policies For The Transport Sector, European Conference of Ministers of Transport (2006) at
http://www.cemt.org/online/council/2006/CM200604Fe.pdf#search=%22OECD%20review%20of%20co2%20abatement%20policies%20for%2
0the%20transport%20sector%22
Vehicle Fuel Efficiency – Public Discussion Paper 72 The Nature of the Challenge
2.1 Profile of the Australian Vehicle Fleet
In order to assess the scope for improving the fuel efficiency and reducing CO2 emissions from
vehicles in the Australian fleet, there is a need to understand the current makeup of the Australian
vehicle population.
There are about 15 million motor vehicles on the road in Australia. Passenger vehicles make up
over 77% of the Australian fleet.6 These include passenger cars and sports utility vehicle (SUV)
wagons. Figure 1 provides a breakdown of the vehicle fleet.
Specialised vehicles Buses Motorcycles
0% 1% 3%
Articulated trucks
1%
Rigid trucks
3%
Light comme rcial
vehicles
15%
Camp ervans
0%
Passenge r vehicles
77%
Figure 1: Proportion of vehicle types in Australian fleet – 2007
Source: ABS, 2007, Motor Vehicle Census 9309.0
The number of vehicles in the Australian fleet has been growing at an average rate 2.9% per year
since 2003. The motorcycle sector has experienced stronger than average growth (7.9% per year)
whilst the light and heavy commercial sectors also experienced above average growth over the
same period.7 Light commercial vehicles are designed primarily for carrying goods and have a
GVM of up to 3.5 tonnes. They include utilities, panel vans, cab-chassis and goods carrying vans.
Table 1 provides details of average annual growth rates for each vehicle class.
Table 1: Average annual growth of registered vehicle numbers (2003–2007)
Vehicle Class Average annual growth (%)
Passenger Vehicles 2.3
Campervans 3.1
Light Commercial Vehicles 3.9
Rigid Trucks 3.1
Articulated Trucks 3.7
Buses 2.5
Motorcycles 7.9
Overall Fleet 2.9
Source: ABS Motor Vehicle Census 2007
The average age of the passenger vehicle fleet in 2007 was 9.7 years, which is a slight drop from
the age in 2005 of 9.9 years. About 20% of passenger vehicles are more than 15 years old.
Commercial vehicles have an older average age – 10.7 years for light commercial vehicles,
6 ABS Motor Vehicle Census 9309.0
7 ABS Motor Vehicle Census 9309.0
8 Vehicle Fuel Efficiency – Public Discussion Paper11.2 years for light trucks and 15.7 years for heavy trucks. The fleet is turned over each year
through the addition of around 7% of the fleet from new sales and the scrapping of around 4% of
the fleet.8
The types of new vehicles being purchased is a key factor in determining the overall fuel efficiency
of the vehicle fleet into the future. There were 1.05 million vehicles sold in Australia in 2007, of
which 60% were passenger cars, 17% were light commercial vehicles and 19% were sports utility
vehicles (SUVs).9 Figure 2 shows a breakdown of sales in 2007.
Heavy Commercial
4%
Light Commercial
17%
SUV Passenger
19% 60%
Figure 2: Australian Vehicle Sales (by class) – 2007
Source: FCAI, VFACTS Vehicle Sales, December 2007
Over the last two decades there has been substantial growth in the sale of new SUVs, which on
average are less fuel efficient than standard passenger cars. Figure 3 illustrates this growth from
1988 onwards. There has also been an expansion in the light and heavy commercial markets. The
passenger car market has continued to grow, although at a lower rate.10
1200000
1000000
800000
Number of Vehicles
600000
400000
200000
0
1988 1989 1990 1991 1992 1993 1994 1995 1996 1997 1998 1999 2000 2001 2002 2003 2004 2005 2006 2007
Year
Passenger Cars Sports Utility Vehicles Light Commercial Heavy Commercial
Figure 3: Annual New Vehicle Sales in Australia (1988–2007)
Source: Australian Automotive Intelligence, 2008, Australian Automotive Intelligence Yearbook – 2008
8 ABS Motor Vehicle Census 9309.0
9 FCAI, VFACTS Vehicle Sales, December 2007
10 ABS, Feb 2008, 9314.0 – Sale of New Motor Vehicles, Time series data
Vehicle Fuel Efficiency – Public Discussion Paper 92.1.1 Light Vehicles (up to 3.5 tonnes)
Light vehicles include passenger vehicles, light commercial vehicles and motorcycles. An
examination of the light vehicle data illustrates that the composition of new passenger vehicle
sales has changed significantly in recent years with a marked increase in the sale of smaller cars.
Sales of new large passenger cars have declined over the last decade. Figure 4 illustrates annual
sales data for the passenger car segment from 1988–2007.
700000
600000
500000
Number of Vehicles
400000
300000
200000
100000
0
1988 1989 1990 1991 1992 1993 1994 1995 1996 1997 1998 1999 2000 2001 2002 2003 2004 2005 2006 2007
Year
Light & Small Medium Large Upper Large Sports People Mover
Figure 4: New Passenger Car Sales (1988–2007)
Source: Australian Automotive Intelligence, 2008, Australian Automotive Intelligence Yearbook – 2008
Sales data for the SUV market segment, from 1988–2007 (Figure 5) shows strong growth in this
segment over the past two decades. In particular there has been strong growth in the compact and
medium SUV market segments and, to a lesser extent, the luxury segment. Over the same period
there has been a decline in the sale of large SUVs.
In recent years there has been significant growth in the motorcycle and scooter market. Between
2003 and 2007 Australian motorcycle registrations increased by an average of 7.9% per year,
compared with a 2.9% increase for the fleet as a whole.11 The increase in motorcycle registrations
was from a low base (3% of vehicles in 2007 – refer Table 1). Motorcycles and scooters can
provide a fuel efficiency advantage, however there are a range of safety and practical issues that
may restrict their widespread use on Australian roads.
The market for passenger cars, SUVs and light commercial vehicles features a mix of private,
commercial and government buyers. In 2007, private buyers purchased just under 50% of all light
vehicles (under 3.5 tonnes GVM), with businesses (including rental fleets) purchasing 43% and
Governments purchasing 7%. Slightly more than half of the passenger vehicles were purchased
by private buyers (55%) with 38% bought by businesses and 7% by governments. Light
commercial vehicles were mostly purchased by businesses (67%), however private purchases
were still significant (22%). Over half of SUV purchases were by private buyers (54%).12 These
results are reflected in Figure 6.
11 ABS Motor vehicle census 2007
12 FCAI, VFACTS Vehicle Sales, December 2007
10 Vehicle Fuel Efficiency – Public Discussion Paper250000
200000
150000
Number of Vehicles
100000
5000
0
1988 1989 1990 1991 1992 1993 1994 1995 1996 1997 1998 1999 2000 2001 2002 2003 2004 2005 2006 2007
Year
Compact Medium Large Luxury
Figure 5: New SUV Sales (1988–2007)
Source: Australian Automotive Intelligence, 2008, Australian Automotive Intelligence Yearbook – 2008
700000
600000
500000
Number of Vehicles
400000
300000
200000
100000
0
Passenger SUV Light Commercial
Vehicle Type
Private Business Government
Figure 6: Vehicle Sales by Buyer Type (2007)
Source: FCAI, VFACTS Vehicle Sales, December 2007
Vehicle Fuel Efficiency – Public Discussion Paper 11100%
90%
80%
70%
60%
50%
40%
30%
20%
10%
0%
Light Small Medium Large Upper Large People Sports SUV SUV SUV Large SUV Luxury
Movers Compact Medium
Private Government Non-Government
Figure 7: Purchasing Profile by Buyer – 2007
Source: VFACTS Data, December 2007.
An analysis of sales of passenger cars shows that private buyers purchase mostly small and
medium sized cars, whereas governments and businesses purchase mostly large cars (see
Figure 7).
Sales of Australian-made vehicles are highly dependent on fleet purchases, which represent about
75% of their sales. Government purchases, across all tiers, account for about 45% of these fleet
sales and the rest are for business fleets.
Government and business fleet purchases have a different profile to private purchases, where
buyers are favouring smaller, more fuel efficient vehicles. The difference in buying patterns can be
partly explained by procurement preferences for Australian-made vehicles which are only available
in the large and medium car segment.
In 2007, Australian-made vehicles comprised 19% of the total new vehicle market, and only about
11% of the private passenger new vehicle market. Just over 60% of Australia’s new vehicles are
imported from just three countries – Japan, Thailand and Korea. This is illustrated in Figure 8.
In trend terms, there has been an increase in the proportion of imported vehicles in the Australian
light vehicle market. As illustrated in Figure 9, since 1994 when the share of this market was split
evenly between locally produced and imported models, there has been a significant growth in the
share of imports while that of local production has continued to fall.
Australian car manufacturers made over 335,000 vehicles in 2007 of which about 40% were
exported. The majority of total automotive exports were to the Gulf States (45% by value), New
Zealand (15%), North America (11%) and Korea (8%).13
13 DIISR, 2007, Key Automotive Statistics – 2006
12 Vehicle Fuel Efficiency – Public Discussion PaperNorth America Other
2% 3%
Australia
Other Europe 19%
8%
South Africa
3%
Germany
4%
Korea
10%
Japan
Thailand 36%
15%
Figure 8: New Vehicle Sales by Country of Origin – December 2007
Source: FCAI, VFACTS Vehicle Sales, December 2007
1000
900
800
700
,000 vehicles
600
All Vehicles
500 IMPORTED
LOCAL
400
300
200
100
0
1991 1992 1993 1994 1995 1996 1997 1998 1999 2000 2001 2002 2003 2004 2005
Year
Figure 9: Sales into the Australian Light Vehicle Market, by Origin
Source: FCAI, VFACTS Vehicle Sales, December 2007
Vehicle Fuel Efficiency – Public Discussion Paper 132.1.2 Heavy Vehicles (over 3.5 tonnes)
The heavy commercial vehicle (HCV) market includes both trucks and buses. Trucks are over 97%
of HCV sales, with the rest being buses and coaches. Within the truck sales, 41% are classified
as large (>15 tonnes), 34% small (3.5–7.5 tonnes) and 22% medium (7.5–15 tonnes).
Prior to 2000, there was a steady decline in HCV sales in the previous quarter century. This
appears to have arisen from a combination of improved vehicle durability and the use of larger
trucks to carry goods – requiring fewer of them. The increasing transport task has gradually
reversed this downward trend, and there is now a trend towards sales of larger trucks to achieve
higher load factors in freight movements. Since 2001, annual sales of heavy commercial vehicles
have doubled, from 18,669 units (2001) to 37,231 units (2007), although the 2007 sales may have
been boosted somewhat by the introduction of stricter emission standards from January 2008.14
The great majority of trucks over 3.5 tonnes are imported as fully built-up vehicles from Japan. At
the heavier articulated end of the truck market, manufacturers from Europe and the United States
are dominant and a significant proportion of vehicles are assembled in Australia and offered with
custom drivetrains (engines, transmissions, wheel axles etc) and bodies to suit particular buyers
and uses. The focus of the small Australian based truck manufacturing industry is on high
horsepower prime movers for articulated vehicles including road trains and B-Doubles. The
industry is primarily made up of assemblers and vehicle builders utilising imported engines
(predominantly US), transmissions and other components. Around 6,600 trucks were assembled
in Australia in 2007, which is around 20% of all heavy trucks over 3.5 tonnes.
The Australian bus and coach industry consists of bus body builders, chassis manufacturers and
ancillary suppliers. According to the Bus Industry Confederation, all buses 8 tonnes and above sold
on the Australian market have been locally assembled on imported chassis, with smaller buses
being predominately fully imported Japanese models. Between 800 and 1,000 buses are built in
Australia each year. There was a higher than average 1400 bus and coach sales in 2007 (both fully
imported and locally built) ahead of new emission standards which took effect from early 2008.15
The major purchasers of new heavy commercial vehicles are the larger fleet operators, with
smaller fleet operators often buying their vehicles second hand from the larger companies. There
tends to be a close working relationship between vehicle suppliers and the major fleet operators
in meeting their specialised fleet requirements.
2.1.3 Vehicle fuels
As illustrated in Figure 10, petrol is the dominant fuel used by light vehicles, with diesel totally
dominant in the heavy vehicle sector.
There are a growing number of imported diesel powered passenger cars coming onto the market
which offer improved fuel and greenhouse efficiency in comparison to the equivalent petrol
powered model. Diesel sales represented just over 1% of new passenger car sales in 2005 but
have risen to over 4% in 2007.16 Sales of diesel models are more prevalent in the SUV (24%) and
light commercial vehicle markets (57%). In contrast, almost all heavy trucks, and most buses, are
powered by diesel.
The only other fuel that has significant market penetration is LPG. Around 3% of the total vehicle
fleet is powered by LPG, although these vehicles use 7% of total fuel by energy content, primarily
due to LPG’s use in taxis and other high-mileage fleet vehicles. Just over 1% of all new passenger
and light commercial vehicles in 2005 were factory-fitted LPG models, with annual sales in 2007
(12,900) increasing to 1.6%.17 There are also more after-market LPG conversions of petrol
vehicles. Industry estimates suggest that 92,000 vehicles were converted to LPG in 2007.18
14 Australian Automotive Intelligence Yearbook 2008
15 Australasian Bus and Coach Directory (2008)
16 Source: FCAI, VFACTS Vehicle Sales, December 2007
17 Federal Chamber of Automotive Industries VFACTS
18 ALPGA, 2008, Personal Communication (2 May 2008)
14 Vehicle Fuel Efficiency – Public Discussion Paper20000
18000
16000
14000
Fuel Consumption (million litres)
12000
10000
8000
6000
4000
2000
0
Passenger vehicles Motorcycles Light commercial Rigid trucks Articulated trucks Specialised trucks Buses
vehicles
Petrol Diesel LPG/CNG/Dual Fuel
Figure 10: Estimated Annual National Fuel Consumption by Vehicle Class (2006)
Source: ABS, 2007, Survey of Motor Vehicle Use 9208.0
Petrol/electric hybrid vehicles represented 0.6% of sales in the combined passenger car and SUV
market in 2007.
Compressed natural gas (CNG) has been used in the transport sector for over 20 years
predominantly within public transport bus fleets. Brisbane, Canberra, Sydney, Perth and Adelaide
operate a proportion of buses on CNG.
2.1.4 Fuel Consumption Performance
Average fuel consumption, as indicated in Table 2, varies according to the fuel and the vehicle
class. Most passenger vehicles operate using petrol, with an average fuel efficiency of
11.2 L/100km. The higher average fuel consumption for diesel passenger vehicles reflects the
current situation where these vehicles tend to be larger SUV’s, although recent indications are that
this is changing.
Table 2: Average Fuel Consumption by Vehicle Class – 2005
Vehicle Class Petrol Diesel LPG/Dual Fuel
(L/100km) (L/100km) (L/100km)
Passenger vehicles 11.2 12.5 15.5
Light commercial vehicles 13.2 12.3 15.0
Rigid trucks 21.6 29.8 33.6
Articulated trucks 37.9 55.6 –
Specialised trucks – 26.2 –
Buses 16.4 27.5 –
Motorcycles 6.4 – –
Source: ABS, 2007, Survey of Motor Vehicle Use 9208.0
Vehicle Fuel Efficiency – Public Discussion Paper 15The average fuel consumption of all light vehicles has hardly changed over the last decade.
Engine technology in terms of fuel consumption per power output has improved substantially and
there has been an improvement in fuel efficiency in the new passenger vehicle fleet. However,
potential fuel savings across the whole light vehicle fleet have been offset by increases in vehicle
power, size and weight, by the strong growth in sales of four wheel drive sports utility vehicles
(SUVs), and increases in the fuel consumption of light commercial vehicles.19
Figure 11 illustrates the fuel efficiency and carbon emissions from new light vehicles entering the
Australian fleet. It depicts a steady improvement of new vehicle fuel efficiency, for petrol passenger
vehicles, over the last two decades, with a 10% improvement in CO2 emissions in 2002–2007. It
is important to note that prior to 2002, this data did not include vehicles in the 2.7–3.5 tonne range.
These heavier vehicles include many light commercial vehicles, and the larger SUVs (the SUVs
are incorporated in the ABS data for passenger vehicles in Table 2 above). Larger SUV’s, on
average, have higher fuel consumption rates than other passenger vehicles, and, in part, the
growth in this market has tended to offset improvements in the average fuel efficiency of “standard”
passenger cars.
12.0
250
11.0
10.0
9.0 200
8.0
7.0 150
g CO2/km
L/100km
6.0
5.0
100
4.0
3.0
50
2.0
1.0
0.0 0
78
84
86
90
96
98
00
02
06
80
88
92
94
08
82
04
10
19
19
19
19
19
19
20
20
20
19
19
19
19
20
19
20
20
Year
NAFC AS287 Petrol Passenger (L/100km) NAFC AD 81/01 Petrol Passenger (L/100km) NACE (g CO2/km)
Figure 11: New Vehicle Fuel Economy and CO2 Emissions in Australia
Source: FCAI, 2008, National Average Carbon Emissions – Fact Sheet
As noted earlier, the vehicles bought by fleets have a different profile from those of private
consumers. When considered in fuel consumption terms, the Department of Environment, Water,
Heritage and the Arts (DEWHA) has estimated that the average fuel consumption of new
government and business fleet purchases of passenger vehicles in 2007 to be 10.5 L/100km,
whereas the average fuel consumption of new private purchasers of passenger vehicles was
9.6L/100km in the same year, an eleven percent difference.
On a weight for weight basis, diesel vehicles are more fuel efficient than a comparable petrol
model. Diesel engines are more expensive to produce than petrol engines and this is reflected in
higher relative purchase costs for diesel variants of models. In the current Australian market, the
price differential between a petrol vehicle and the diesel variant ranges from $1000 to $8500.20, 21
19 ABS Survey of Motor Vehicle Use 9208.0, BTRE Information Sheet 18 – Fuel Consumption of New Passenger Vehicles
20 Mazda 3 (www.mazda.com.au accessed on 29 April 2008)
21 Peugeot 407 ST (www.peugeot.com.au accessed on 29 April 2008)
16 Vehicle Fuel Efficiency – Public Discussion PaperAn analysis of “best performing” and “best selling” small and medium petrol cars suggests that
consumers are seeking a balance between fuel efficiency and a range of other factors, such as
purchase price. A comparison of the relevant petrol vehicles from the small and medium classes
is provided in Table 3. The best performing models provide a 15–16% reduction in CO2 emissions,
compared with the best sellers. However, based on current fuel prices, purchasing the lower priced
vehicle presents a more attractive financial option over the lifetime of the vehicle. In the examples
quoted in Table 3, the owner would need to travel almost 200,000km for medium car category to
recoup the extra cost of the higher priced vehicles in fuel savings, and almost 500,000km for small
car.22 However, the table also illustrates that price competitive fuel efficient vehicles are available.
Table 3: Comparison of “best performer” and “best seller” petrol cars by class
Small Car (Petrol)
Best Performer Fiat 500 Best Seller Toyota Yaris
(CO2 emissions)
Fuel Consumption 5.0 Fuel Consumption 6.0
(Combined) (L/100km) (Combined) (L/100km)
CO2 emissions (g-CO2/km) 118 CO2 emissions (g-CO2/km) 141
Recommended Retail Price $22,990 Recommended Retail Price $15,190
Medium Car (Petrol)
Best Performer Peugeot 207 1.6 XT Best Seller Toyota Corolla
(CO2 emissions)
Fuel Consumption 6.1 Fuel Consumption 7.3
(Combined) (L/100km) (Combined) (L/100km)
CO2 emissions (g-CO2/km) 145 CO2 emissions (g-CO2/km) 172
Recommended Retail Price $24,990 Recommended Retail Price $20,990
Source: Green Vehicle Guide and manufacturer websites (June 2008)
It is also important to note that there are significant differences in fuel consumption performance
within vehicle classes. The indicative analysis of Green Vehicle Guide data reported in Table 4
illustrates the magnitude of the differences.
Table 4: Comparison of Highest and Lowest CO2 Emitting Vehicles by Class
Vehicle Class* CO2 Emissions (g/km) Annual Difference Between
Lowest and Highest
Lowest Emissions Highest Emissions Tonnes CO2
in Class** in Class** per vehicle per year #
Small Car 120 200 1.2
Medium Car 130 270 2.1
Large Car 160 300 2.1
People Mover 200 330 2.0
Light truck 210 330 1.8
* Classes as per Green Vehicle Guide
** Lowest and highest emission values are conservative and do not represent the single lowest or highest emitting
vehicle model in each class. In the three “car” classes, the chosen lowest emission figure represents the value at or
below which there are at least five different models available. The chosen highest emission figure in the car classes
excludes “exotic” or unusual vehicles, and in the case of the large car class excludes 8+ cylinder models and 4WDs.
# Assuming annual travel of 15,000km.
22 Assumes a price of $1.60 per litre for petrol
Vehicle Fuel Efficiency – Public Discussion Paper 172.2 Greenhouse Emissions and the Transport Sector
The transport sector contributed 79.1 Mt CO2-e or 13.7% of Australia’s net emissions in 2006.
Road transport was responsible for 87% of these emissions, or 12.0% of Australia’s total
emissions. Greenhouse gas emissions from road transport have been increasing at an average of
1.7% per annum since 1990.23 Figure 12 reflects the growth in greenhouse emissions from the road
transport sector since 1990. It shows that higher than average growth in the light commercial
and heavy commercial market segments has contributed 47% of the growth in road transport
emissions.
80
70
60
50
M t CO2-e
40
30
20
10
0
1990 1995 2000 2005
Year
Cars Light Commercial Vehicles Trucks and buses Motorcycles
Figure 12: Greenhouse Emissions from Road Transport Sector (1990–2005)
Sources: Transport Sector Greenhouse Gas Emissions Projections 2007 Department of Climate Change (2008) & ABS, 2006,
Motor Vehicle Census 9309.0
Due to their size and load, heavy commercial vehicles, consume significantly more fuel and
contribute greater greenhouse emissions per kilometre than a smaller passenger vehicle.24 Figure
13 compares the relative proportion of each market segment and their relative contribution to
greenhouse emissions. It can be seen that whilst heavy commercial vehicles make up just over
4% of the fleet, they contribute over 22% of emissions.
The greenhouse gas emissions from the transport sector in 2010 have been projected to be
89.9 Mt CO2-e, +/- 6 per cent – see Figure 14. This represents a 45% increase over the 1990 level.
Emissions from road transport are projected to be 76.4 Mt CO2-e in 2010 (41% over 1990 levels),
with emissions from rail, aviation and shipping projected to reach 11.6 Mt CO2-e, or 50% above
1990 levels.25
The bulk of emissions growth between 1990 and 2010 is due to road vehicles, which are
responsible for emissions growth of 22 Mt CO2-e. Even though trucks are a smaller sector, fast
growth in light commercial vehicles and articulated trucks means that they make up almost half this
projected growth (11.5 Mt CO2-e), with the larger passenger vehicle sector making up the rest
(10.5 Mt CO2-e). By comparison, non-road transport sectors (air, rail, sea) are projected to grow
by approximately 3.8 Mt CO2-e over the same period.
For 2020, the indicative ‘with measures’ projection is 103.7 Mt CO2-e. This represents a 67%
increase on the 1990 level of 62.1 Mt CO2-e. Emissions growth between 2010 and 2020 is forecast
23 Department of Climate Change (2008), National Greenhouse Gas Inventory (2006)
24 However, when considered in energy efficiency terms this is not a valid comparison, as these vehicles are very fuel efficient given the large
volume and mass of freight they carry.
25 Department of Climate Change (2008), Transport Sector Greenhouse Gas Emissions Projections 2007
18 Vehicle Fuel Efficiency – Public Discussion Paperto slow to 1.6% per annum compared to 1.8% between 2005 and 2010. Slowing emissions growth
in the latter half of the projection period is driven by forecasts of slower economic growth, the
effects of saturation of per capita car travel and a continuing drive for fuel efficiency improvements.
0.3
100% 3.2
4.1
22.1
14.7
80%
15.6
60%
%
40% 78
62
20%
0%
Fleet Emissions
Passenger cars Light Commercial Vehicles Trucks and buses Motorcycles
Figure 13: Comparison of Fleet Proportion and Proportion of Greenhouse Emissions by
Sector (2005)
Sources: Transport Sector Greenhouse Gas Emissions Projections 2007 Department of Climate Change (2008) & ABS, 2006,
Motor Vehicle Census 9309.0
Figure 14: Greenhouse gas emissions from the Transport sector
Note 1 WM = ‘With measures’ best estimate. BAU = ‘Business as Usual’.
Note 2 High and low scenarios are variations on the ‘with measures’ scenario which provide an indication of how
emissions may be affected by uncertainty in forecasting key drivers including economic growth, population, fuel
efficiency improvements and oil prices.
Sources: ACG 2007, BTRE 2007, DCC analysis.
Demand for road transport is considered to be relatively inelastic (-0.1 to -0.2) with respect to fuel
prices in the short term. Even though the cost of fuel is an important contribution to overall
transport costs, it tends to be overshadowed by the total generalised cost of motoring, i.e. the
combination of other operating costs (such as depreciation and maintenance) and original vehicle
Vehicle Fuel Efficiency – Public Discussion Paper 19purchase costs and access charges, as well as the value that travellers place on travel time and
convenience relative to other travel modes.26
The transport sector has been exposed to sustained growth in fuel prices in recent years. Growth
in the international price of refined fuels (petrol and diesel) is being driven by a combination of
factors including increased demand from the developing economies of China and India, restrictions
on the ability of refineries to meet demand and ongoing political uncertainty in the Middle East.
Australian fuel prices tend to follow movements in international refined fuel prices.
As noted earlier, increasing fuel prices are enhancing the attractiveness of fuel efficient vehicles
and the cost-effectiveness of measures to improve vehicle efficiency. To put this into perspective
in terms of greenhouse mitigation measures, the 40 cents/litre petrol increase seen in Australia
over the last three years is the equivalent of applying a carbon tax to petrol of $160/tonne CO2-e.
Nevertheless, it is widely accepted that the elasticity of fuel use with respect to petrol prices is very
low in the short term, as vehicle owners often have limited opportunity to change travel patterns or
switch to more fuel efficient vehicles. The elasticity is still relatively low in the medium term,
although there is greater capacity to make changes in vehicle purchases in that time frame. Figure
15 provides an indication of the patterns of petrol prices and purchasing behaviour over the late
2004 to early 2008 period, using CO2 emissions data from the Green Vehicle Guide on the top 20
selling models in the light vehicle fleet.
170
3.5% fall in average CO 2 over 2005
240
7.6% fall in average CO 2 over 2006
160
Average ULP Retail Price NSW Metro (c/L, line)
CO2 Emissions of Top 20 Sellers (g/km, bars)
0.2% fall in average CO 2 over 2007
220
150
Sales Weighted Average Monthly
200 140
130
180
120
160
110
140
100
120
90
100 80
Figure 15: Average CO2 Emissions of Top Sellers (columns) compared to Petrol Price
Movements (line)
Notes:
1. Sales figures based on VFACTS, with Top 20 sellers representing around 50% of vehicle sales.
2. CO2 emissions from the Green Vehicle Guide. CO2 value chosen for each vehicle is the value for the best performing
variant. This means that the total and average CO2 emissions are an underestimate. This is confirmed by FCAI data27
which reports a sales weighted CO2 average of 230 and 226 g/km for 2006 and 2007 respectively (4.8% and 5.4%
higher than Figure data).
While the data should be treated as indicative only, and other factors may be at play, the above
chart indicates that the steep rise in petrol prices during 2005 is followed by a significant change
in purchasing behaviour in 2006 towards more economical vehicles (as measured by CO2
emissions), particularly in the first three months of the year. However, the tapering off of this
26 Greenhouse Gas Emissions From Australian Transport: Base Case Projections To 2020, BTRE (2005)
27 Federal Chamber of Automotive Industries (2008) National Average Carbon Emissions (NACE) at: http://fcai.com.au/files/nace.pdf
20 Vehicle Fuel Efficiency – Public Discussion Paperincrease in fuel prices during the second half of 2006 and during most of 2007, is associated with
a virtual standstill in the average CO2 emission levels of the top selling models in 2007 and into
2008, despite the “floor” in the petrol price in 2007 (around 120 c/L) being much higher than that
in the beginning of 2005. This suggests that consumers become accustomed to a higher fuel price
and that the capacity of fuel prices alone to drive sustained changes in purchasing behaviour is
limited, unless the prices are very high or increasing rapidly and consistently.
2.3 Consumer Behaviour in the Road Transport Sector
The CPRS is expected to provide the most cost effective approach to reducing CO2 emissions on
an economy wide basis.
The demand for road transport tends to respond slowly to changes in the price of fuel. In the short
term, vehicle owners often have limited opportunity to change travel patterns or switch to more fuel
efficient vehicles.
Lack of access to objective information on fuel consumption can be a barrier to the uptake of low
emission vehicle technology. The Fuel Consumption Label and the Green Vehicle Guide are
significant steps toward reducing this market barrier for light vehicles. However, in the case of
heavy vehicles, vehicle purchasers can have difficulty accessing objective and comparable fuel
consumption information. Smaller heavy vehicle fleet operators, in particular, often have to rely
upon limited and subjective evidence from industry contacts or vehicle sellers.
Research suggests consumers can undervalue the ongoing financial savings over the life of a
vehicle arising from improved fuel efficiency relative to other purchasing considerations (such as
purchase price and lifestyle considerations).28 Vehicle choice is informed by a range of factors, of
which fuel efficiency is one. While fuel efficiency may carry a high social value in relation to future
benefits and costs, individual consumers may ascribe a lower private value to fuel efficiency,
relative to other factors.
2.4 Current Measures
Australia has a range of measures in place that influence vehicle fuel efficiency.
There are a number of national level programs which do not have improved fuel efficiency or lower
CO2 emissions as their primary objective, but do have some influence on these objectives. Such
measures include:
• The Automotive Competitiveness and Investment Scheme (ACIS) which included $150 million
R&D program to encourage local vehicle manufacturers to invest in advanced technologies,
including those offering emission and fuel efficiency improvements;
• The Light Metals Action Agenda, encompassing the aluminium, magnesium and titanium
industries, which provides a framework for the growth of the Australian light metals industry,
which has potential application in the vehicle manufacturing industry; and
• The Co-operative Research Centre for Advanced Automotive Technology which has been
established to provide the automotive industry with the opportunity to work with research
providers in design, engineering and manufacturing research to enhance the industry’s
international competitiveness.
There are a number of current measures which do have reducing emissions or improving fuel
efficiency as a key or primary objective. These are summarised below.
Green Car Innovation Fund
The Australian Government has announced the establishment of a scheme to support innovation
in the light vehicle sector, through the five year $500 million Green Car Innovation Fund, which is
28 Turrentine, T. & Kurrentine, T, 2007, Car buyers and fuel economy, Energy Policy, 35, 2007
Vehicle Fuel Efficiency – Public Discussion Paper 21scheduled to commence in 2011. On 10 June 2008, the Australian Government announced that
$35 million from the fund will be provided to Toyota to support the manufacture of a hybrid Camry
model in Australia. The Victorian Government is also supporting the project.
National average fuel consumption target
A voluntary national average fuel consumption (NAFC) target for new passenger cars was
negotiated between the Australian Government and the Federal Chamber of Automotive Industries
(FCAI). The target established in 2003 was 6.8 L/100km for petrol passenger cars by 2010. If
delivered, this would represent an estimated 18% improvement in the fuel consumption of new
vehicles between 2002 and 2010 – a rate of improvement similar to the EU and Japanese targets,
but starting from a higher absolute level.
The fuel consumption testing procedure that underpinned the NAFC target was changed in 2004
to reflect a change in testing standards.29 The revised test (in Australian Design Rule (ADR) 81/01)
produces higher nominal fuel consumption figures for the same vehicle model than the previous
testing procedure. ADR81/01 also expanded the scope of vehicles to include diesel and LPG
vehicles, and increased the maximum mass from 2.7 tonnes to 3.5 tonnes.
The new test procedure and wider scope necessitated a review of the 2010 NAFC target. It was
also decided that, consistent with international practice, it would be appropriate to convert the
previous NAFC target to a National Carbon Emissions (NACE) target expressed in g CO2/km.
Further negotiations have occurred with the FCAI to align the target with the new test procedures
and to set targets which included all light vehicles up to 3.5 tonnes. These negotiations have not
been finalised.
The FCAI has proposed a NACE target of 222 g CO2/km for all new light vehicles by 2010. An
independent analysis, commissioned by the FCAI and the Australian Government in 2004,
recommended a NACE target of 214 g CO2/km for new light vehicles by 2010. The FCAI proposal
represents virtually no improvement over the NACE already achieved in 2007.
Alternative Fuels Conversion Program (AFCP)
The AFCP, administered by the Department of the Environment, Water, Heritage and the Arts,
provided assistance to industry to develop and trial natural gas and LPG engines in heavy duty
vehicles. The AFCP ended in June 2008. Launched in January 2000, AFCP has assisted the
purchase or conversion of over 1000 trucks and buses. Recent trials have focused on the use of
LNG in long haul trucks, which is showing promise for that type of transport operation.
The AFCP has demonstrated that there are no easy alternative fuel solutions for heavy vehicles
that will deliver consistent greenhouse and air quality benefits. Critical barriers to the uptake of
gaseous fuels have been a lack of a refuelling network and infrastructure, coupled with a lack of
mature gas vehicle technology available and ready for adoption by the heavy vehicle industry.
Experience from the AFCP suggests that the utilisation of natural gas or LPG does not guarantee
a better greenhouse gas outcome, with many of the vehicles tested under the program showing
no advantage over an equivalent diesel engine, and some showing a significant disadvantage. The
program has also highlighted the lack of a heavy commercial vehicle test facility.
Fuel consumption labelling
From 1 January 2004, ADR81/01 Fuel Consumption Labelling for Light Vehicles has required fuel
consumption labelling of all new vehicles up to 3.5 tonnes irrespective of fuel source. The label
indicates how many litres of fuel a vehicle will use to travel 100 kilometres, as well as the
greenhouse gas emissions per kilometre. ADR81/01 is mandatory, but sets no limits on emissions
or fuel consumption. It is aimed directly at informing consumers as to the relative performance of
individual models. ADR81/01 specifies that the test procedure must comply with the United Nations
Economic Commission for Europe Regulation 101 (UNECE R101) in order to harmonise Australian
29 The new testing procedure is set out in UNECE Regulation 101 as adopted in ADR81/01 Fuel Consumption for Light Vehicles.
22 Vehicle Fuel Efficiency – Public Discussion Papertesting and reporting of greenhouse gas emissions and fuel consumption with the approach used
internationally.
A revised labelling standard (ADR81/02) will take effect from October 2008 for new model vehicles
and will be mandatory on all new vehicles from April 2009. The new label (see Figure 16) will
display three fuel consumption numbers – ‘combined’, ‘urban’ and ‘extra-urban’ – produced from
the standard UNECE test cycle, as well as the CO2 value for the combined test. This approach is
consistent with the labels used in the EU and other countries. The current label only provides the
combined test cycle numbers for both fuel consumption and CO2 emissions. Most vehicles have
much higher fuel consumption on the ‘urban’ part of the test cycle, and for drivers who spend a lot
of time in city traffic conditions, the new label will provide a more accurate indication of fuel
consumption than simply the combined result. A sample of UK vehicles indicates urban fuel
consumption values are 20–50% higher than the combined values.30
Figure 16: Sample Fuel Consumption Label required under ADR81/02 31
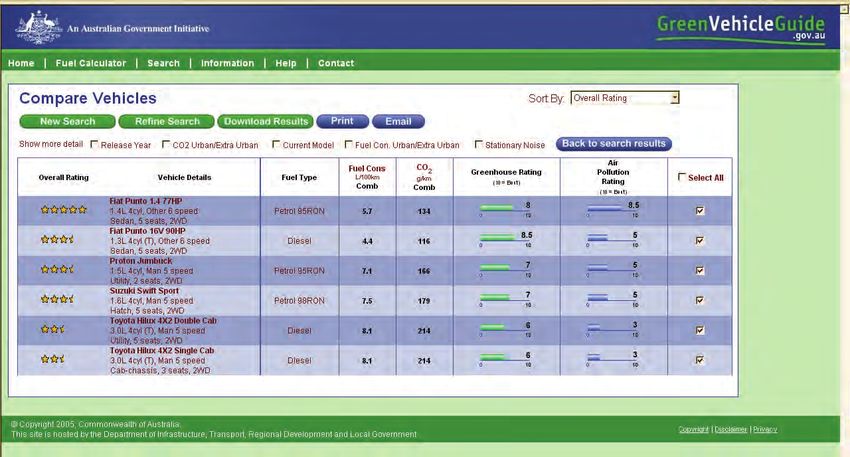
Green Vehicle Guide
The Green Vehicle Guide (GVG) website provides model specific information to consumers on the
fuel efficiency and greenhouse emissions of all light vehicles less than 3.5 tonnes produced since
mid-2004, matching the information required on the fuel consumption labels.32 In summary, a
consumer is able to assess the performance of individual vehicles on the GVG in terms of:
• greenhouse emissions (presented both as a rating out of 10, and the actual CO2 emissions
value in g/km from ADR81),
• fuel consumption in L/100km (as calculated under ADR81),
• air pollution performance (as a rating out of 10, based on the emissions standard to which the
vehicle is certified),
• overall environmental performance (as a 1–5 star rating based on the sum of the greenhouse
and air pollution ratings).
30 Based on data provided on the UK Vehicle Certification Agency’s website at: http://www.vcacarfueldata.org.uk/
31 Full text of ADR81/02 available at: http://www.comlaw.gov.au/comlaw/management.nsf/lookupindexpagesbyid/IP200835098?OpenDocument
32 The GVG is at: www.greenvehicleguide.gov.au
Vehicle Fuel Efficiency – Public Discussion Paper 23You can also read