VEHICLE SPEED MEASUREMENT USING DOPPLER EFFECT - Nguyen Giang Lam - Technology and Communication 2021
←
→
Page content transcription
If your browser does not render page correctly, please read the page content below
1

                 Nguyen Giang Lam

    VEHICLE SPEED MEASUREMENT USING
            DOPPLER EFFECT

            Technology and Communication
                       2021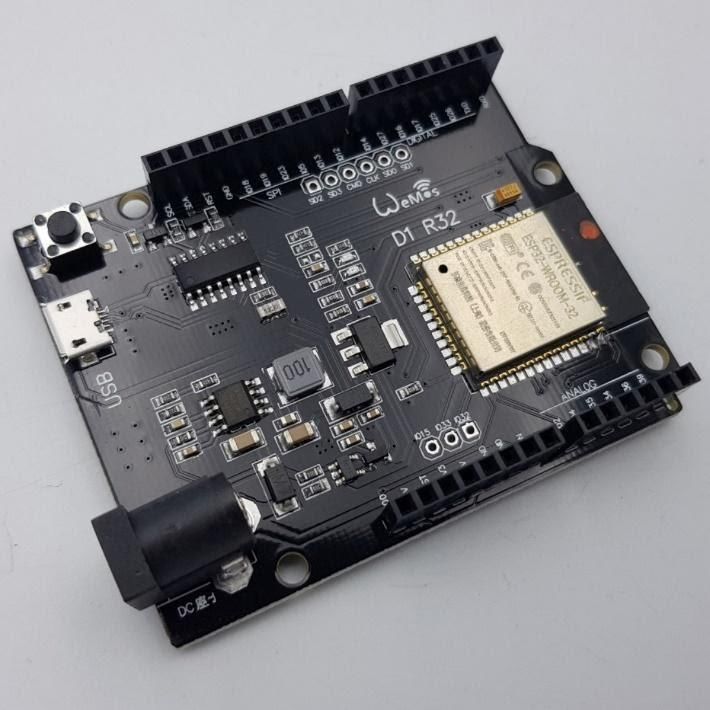
2

VAASAN AMMATTIKORKEAKOULU
UNIVERSITY OF APPLIED SCIENCES
Information Technology

ABSTRACT

Author                 Nguyen Giang Lam
Title                  Vehicle Speed Measurement Using Doppler Effect
Year                   2021
Language               English
Pages                  41 pages
Name of Supervisor Jukka Matila
The dramatically increasing number of vehicles leads to many problems, and one of the
most comment problems is Overspeed by driver intentionally or not. To help the driver
and the police have a better control and safety, speed measurement devices have
been built to solve these problems.

This thesis was built around the project, carried out as a research Vehicle Safety
Features in Vietnam by Radar-SDK team of FPT Software. The primary purpose of this
thesis was to give an understanding of building a speed measurement device with high
accuracy, which can be applied in real-life to measure and used as a study case for later
development.

In this project, specific circuits, Radar sensors, and microcontrollers were used to
record and collect speed from high to low-speed vehicles. This data was analyzed and
show the speed of the specific will be shown on vehicle to the monitor and the system
will capture the photo of the vehicles with their speed.

Keywords: Speed measurement devices, Radar sensors, microcontroller
3

ABBREVIATIONS

CW         Continuous Wave

GPIO       General-purpose input/output

I2C        Inter-Integrated Circuit

IC         Integrated Circuit

IDE/IDLE   Integrated Development Program

LCD        Liquid Crystal Display

LIDAR      Light Detection and Ranging

RADAR      Radio Detection and Ranging
4

Table of Contents
ABSTRACT
1.INTRODUCTION ............................................................................................................. 7
2.LITERARY REVIEW .......................................................................................................... 8
    2.1 Detection by Radar Wave....................................................................................... 8
       2.1.1 Mathematical Expression ................................................................................ 8
       2.1.2 Doppler Examples ............................................................................................ 9
    2.2 LiDAR Detection .................................................................................................... 10
       2.2.1 LiDAR Application to Find Ranges and Mappings ......................................... 10
       2.2.2 Speed Measurement by LiDAR ...................................................................... 13
    2.3 GPS Based Speed Measurement .......................................................................... 14
    2.4 Vision Based System for Speed Measurement .................................................... 15
    2.5 Image Processing Techniques .............................................................................. 16
3. METHODS.................................................................................................................... 17
    3.1 Components .......................................................................................................... 17
       3.1.1 KIT Arduino ESP32 .......................................................................................... 17
       3.1.2 Radar HB100 ................................................................................................... 19
       3.1.3 KIT ESP32 CAM ............................................................................................... 21
       3.1.4 LCD 16X2 Screen............................................................................................. 23
       3.1.5 I2C Converter Circuit for LCD ......................................................................... 24
    3.2 System Building .................................................................................................... 25
       3.2.1 System Diagram ............................................................................................. 25
       3.2.2 Amplifier Circuit for Radar HB100 ................................................................. 26
       3.2.3 Circuit Connection to the System .................................................................. 29
    3.3 Software Building ................................................................................................. 31
4. TESTING AND RESULT ................................................................................................. 33
    4.1. Speed Calculation ................................................................................................ 33
    4.2 Accuracy when Measuring Speed. ....................................................................... 33
    4.3 Comparison with Other Speed Measurement Method ...................................... 34
       4.3.1 GPS Based System .......................................................................................... 34
       4.3.2 Speed Measurement Based on Image .......................................................... 36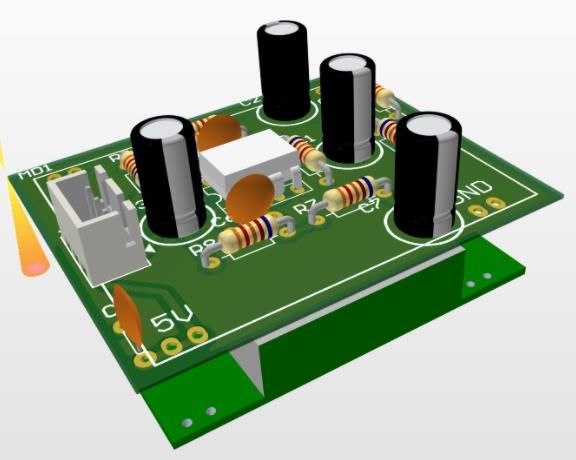
5

5 CONCLUSION AND FUTURE WORK ............................................................................. 37
REFERENCES .................................................................................................................... 38
6

FIGURES AND TABLES
Figure 1: The Doppler effect follows the eye of the Observer [3].................................... 9
Figure 2: The Doppler effect on listening frequency [14] .............................................. 10
Figure 3: LiDAR system simulation[15] ........................................................................... 12
Figure 4: Speed measurement simulation using LIDAR [13] .......................................... 13
Figure 5: GPS Based Speed Measurement example [16] ............................................... 14
Figure 6: How GPS based system works [17].................................................................. 14
Figure 7: Vision based system [8] ................................................................................... 15
Figure 8: KIT ESP32 WeMos D1 R32 [18] ........................................................................ 17
Figure 9: Name and function pins on KIT ESP32 [19] ..................................................... 18
Figure 10: Schematic of KIT ESP32 WeMos D1 R32 [19] ................................................ 18
Figure 11: RADAR HB100 [1] ........................................................................................... 19
Figure 12: RADAR HB100 Diagram [1] ............................................................................ 20
Figure 13: Horizontal and Vertical Beamwidth [2] ......................................................... 21
Figure 14: KIT ESP32 Cam [20] ........................................................................................ 21
Figure 15: KIT ESP32 Map Pins [20] ................................................................................ 22
Figure 16: KIT ESP32 Schematic [20] .............................................................................. 22
Figure 17: LCD Screen [21] .............................................................................................. 23
Figure 18: I2C Module [22] ............................................................................................. 24
Figure 19: System Diagram ............................................................................................. 25
Figure 20: Amplifier Circuit Diagram .............................................................................. 26
Figure 21: 3D Print Circuit ............................................................................................... 27
Figure 22: Front of Circuit ............................................................................................... 29
Figure 23: Back of Circuit ................................................................................................ 30
Figure 24: Function Flow................................................................................................. 31
Figure 25: Waveform Calculation ................................................................................... 32
7

1. INTRODUCTION
Nowadays, the traffic has always been an issue. The number of people and vehicles
participating in traffic is increasing day by day. Besides, the awareness of most drivers
in traffic remains poor, leading to unpredictable consequences. The leading cause of
tragic accidents is speeding. Only the traffic police force cannot be well managed, so
determining the speed of the vehicle based on automatic equipment serving the
handling and management of speed violations is essential.

There are many methods that scientists around the world have researched and applied
in practice to help track vehicle speed. Among plans for detecting vehicle speed, Radar-
based object detection systems have been deployed for centuries for various purposes
such as aircraft detection, spacecraft, terrain mapping and weather forecast. With the
advent of better design technology and signal control circuits, radars have become
compact and affordable, providing relatively lower-cost solutions than other systems.
The vehicle velocities were collected in the form of a continuous wave Doppler Radar.
This system consumes very little energy and operates on the Doppler Effect principle
by detecting Doppler changes in microwaves reflected from a moving object. The
Doppler displacement received by the radar is proportional to the speed of the item.
8

2.LITERARY REVIEW
Vehicle speed measurement systems are significant parts of monitoring and handling
vehicles that violate traffic laws. Traffic state estimation parameters play a significant
role in the development of intelligent traffic systems. Usually, this information is
collected by different types of sensors to give traffic status updates.

Advanced technology provides different means for collecting traffic data. However, the
other methods often result in an accuracy that differs from the actual speed of the
vehicle. Some of the techniques below discuss the most accurate traffic data
processing between a measuring device and the driver’s actual speed.

2.1 Detection by Radar Wave
Detection by Radar wave is a method of using radar waves based on the Doppler
effect. The Doppler effect is a physical effect named after Christian Andreas Doppler.
The frequency and wavelength of sound waves, electromagnetic waves, or waves, in
general, are altered as the source moves relative to the Observer. [3]

2.1.1 Mathematical Expression
In normal conditions, wave sources and observers can both move relative to the
environment. The Doppler effect is then the combination of two different products
caused by these two movements.

                                                                (1)
       v: Speed of propagation of waves in the medium

       Vr: The relative speed of the Observer concerning the environment.

       Vs: The relative velocity of the source to the environment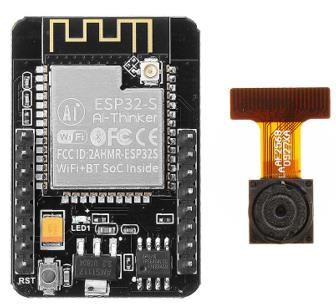
9

            Figure 1: The Doppler effect follows the eye of the Observer [3]

Specifically, if the mobile source in the medium emits a wave with the frequency at the
source f0, an observer standing still in the medium will receive frequency f:

                                                             (2)

For c, the propagation speed of the wave in the environment, v is the component of
the velocity of the source relative to the medium pointing to the Observer (negative if
going towards the Observer, positive if the opposite). [2]

2.1.2 Doppler Examples
The siren on an ambulance approaching us will have a higher frequency (brighter)
when the vehicle is stationary. This frequency decreases (lower) as the car passes and
is lower than average when the vehicle passes away.

In other words, if the car is going straight towards you, the frequency will remain the
same (since the velocity components v in the direction pointing at you stays constant,
until they pass you, then immediately change to frequency. The difference between
the high frequency on the approach and the standard frequency of the horn is
precisely equal to the difference between the low frequency when going away
compared to the reference frequency. When the vehicle does not hit the subject, it just
passes the subject. The speed components in the direction pointing to the subject do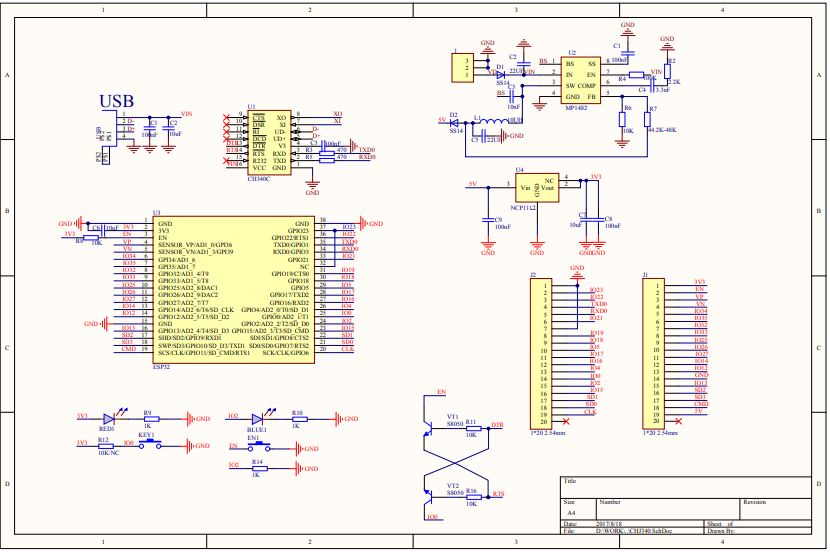
10

not remain the same because this direction always changes depending on the position
of the vehicle:

                                                         (3)

Where v is the vehicle’s velocity component in the direction pointing to a subject, v0 is
the speed of the vehicle and the angle between the direction of travel of the vehicle
and its path to the subject. [2]

                  Figure 2: The Doppler effect on listening frequency [14]

2.2 LiDAR Detection
LIDAR started appeared in the early 1960s, shortly after the advent of lasers. At that
time, the combined laser beam image recognition technology simulated the ability of
the radar to measure distances and detect objects. This distance is calculated based on
when the light ray started emitting from the light source and hit the item to be
measured and reflected.

2.2.1 LiDAR Application to Find Ranges and Mappings
LIDAR was first used in meteorology when the American Center for Atmospheric
Research used it to measure clouds. This technology began to spread and gain more
recognition when NASA astronauts used it to map the moon’s surface during the
Apollo 15 mission.
11 As explained by the US Department of Meteorology and Hydrology, a LIDAR system usually includes: Laser generator: often use wavelengths from 600 to 1000nm because it is cheap. In return, it is harmful the eyes, so that regulations will limit energy. The 1550nm wavelength is safe for the eyes at high points, but the receiver is not as modern, so it is usually only used for long-range and lower accuracy. [4] Scanner: components used to control the laser to rotate around the environment.[4] Receiver: the laser signal is reflected back.[4] A positioning device can be a GPS sensor and a gravity sensor to know the direction and scan position. Figure 3 illustrates the LIDAR system simulation. When the laser goes from the emitter, it will hit the scanner. Here used a rotating mirror to guide the laser around. When the laser beam hits the wall, it is reflected and recorded by the receiver, thereby calculating the distance of the transmitter to the wall. Similarly, when there is an obstacle in the middle of the room, the laser will come and be reflected again in a shorter time, i.e., the distance to the transmitter is shorter. Because the laser is rotating continuously, the image of the whole room can be synthesized.[4]
12

     Figure 3: LiDAR system simulation [15]
13
2.2.2 Speed Measurement by LiDAR
Figure 4: Speed measurement simulation using LIDAR [13]
When a vehicle passes through or breaks the first beam, the microprocessor inside
records the time, the beam was disconnected. When the car cuts the second beam, the
moment of the second interrupt is recorded. The sensor will calculate the passing
speed of the passing vehicle based on the distance between the two beams on the
road and the intervals.
By placing sensors on the road surface, it is possible to accurately measure all speed of
all vehicles in multi-lane environments - virtually eliminating the possibility of sensor
clogging. Furthermore, the sensors can simultaneously measure the speed of vehicles
moving in the same or opposite direction. [15]14
2.3 GPS Based Speed Measurement
The speed measurement in a GPS-based system based on a calculation between
satellites and ground devices such as smartphones or GPS trackers. By sending a signal
from the device to satellites and back, GPS based system can measure the speed of the
object at quite an accuracy speed.
Figure 5: GPS Based Speed Measurement example [16]
Figure 6: How GPS based system works [17]15
When the vehicle travels on the road, the data from transmission device will send data
to GPS satellites and received data back on the location and condition in real-time.
More data sent out leads to more location received back. Based on time and location
point, the device will calculate the speed.
2.4 Vision Based System for Speed Measurement
This system uses an optimized motion detector and a novel text detector t efficiently
locate vehicle plates plate regions, tracked across multiple frames, and rectified for
perspective distortion. Vehicle speed is measured by comparing the trajectories of the
tracked features to known real-world measure.[8]
Figure 7: Vision based system [8]16 2.5 Image Processing Techniques Vehicle speed measurement based on image detection is one of the most convenient methods for speed detection. New algorithms are introduced to calculate vehicle speed by comparing two consecutive frames. Its principle is that both images are converted from a 2D image plane to 3D coordinates based on a calibrated camera. Secondly, the difference of two consecutive frames is calculated, resulting in the background being removed and the media in the two structures mapped onto an image. Finally, the vehicle mass performance closest to the ground is compared to estimate its distance and speed. Vehicle speed detection is based on a video in urban intersections in calculating vehicle speed equal to the width of the detection area and its time to go through that detection area [8]. The vehicle velocity estimator to monitor traffic system calculates the vehicle speed based on the shift of gravity center of the vehicle. Most of the speed estimation methods is based on visibility estimate the average traffic speed over a while with an error rate of more than 10% of the actual value. Such an error rate is considered large for any practical use. Errors due to external conditions such as the time of day or night or the changing weather can be substantial, requiring frequent updates at the expense of computational complexity.
17

3. METHODS
Arduino ESP32 WeMos D1 R32 will be the center of the system, to collect images from
ESP 32 Cam and data from Radar HB100 to show the speed and the measure subject to
LCD 16x2 screen and then save to SD card.

3.1 Components
3.1.1 KIT Arduino ESP32
The center of the vehicle speed monitoring system is built on the KIT Arduino ESP32
WeMos D1 R32 platform (core is the ESP32-WROOM-32 chip). ESP32 KIT is used in a
compatible system and recognized by the Arduino IDE under the name ESP32 Dev
Module (Note: select ESP32 Dev module when connecting the ESP32 Kit with the
computer running Arduino IDE).

                       Figure 8: KIT ESP32 WeMos D1 R32 [18]
18
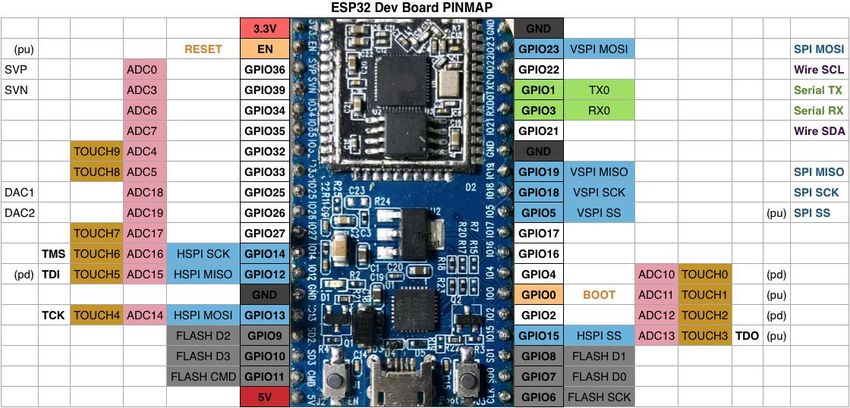
Figure 9: Name and function pins on KIT ESP32 [19]
Figure 10: Schematic of KIT ESP32 WeMos D1 R32 [19]19
This module contains the following features:
● Central core: Wireless Module - ESP-WROOM-32 based on Espressif ESP32 dual-
core Tensilica LX6 processor with 802.11 b / g / n Wi-Fi and Bluetooth 4.2 LE. [19]
● Operating frequency up to 240Mhz. [19]
● 448 KB ROM for booting and chip core features. [19]
● 8 KB SRAM in RTC (called RTC SLOW Memory) for access by the co-processor.
[19]
● 8 KB SRAM in RTC (called RTC FAST Memory) is used for data storage, accessed
by the CPU when RTC is booting from Deep-sleep mode. [19]
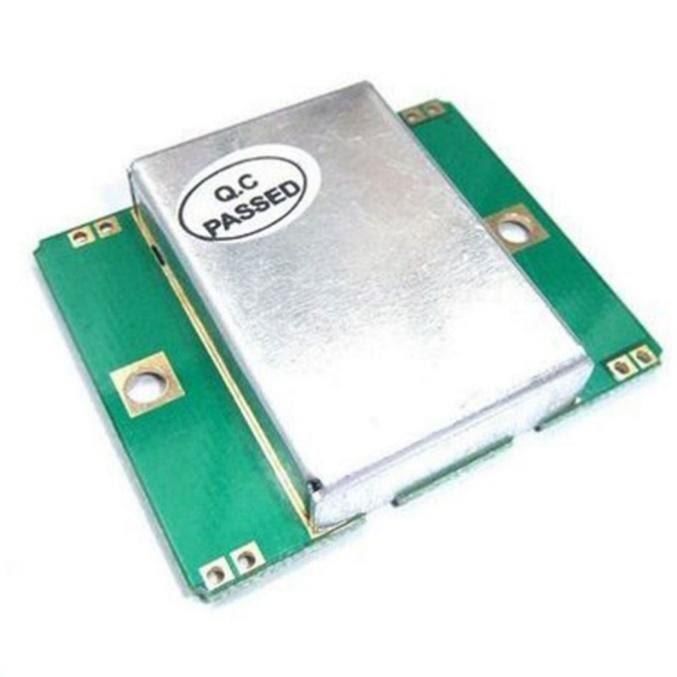
3.1.2 Radar HB100
This is a small motion sensor module using a 10,525 GHz frequency. It belongs to the X-
Band Bi-Static Doppler transceiver category. Inside, the radar obstacle sensor contains
a Dielectric Resonator oscillator (insulating material is usually ceramic to create
microwave waves) and a pair of Microstrip patch antenna. The antenna type is like a
PCB antenna on the circuit but often built into the sensor. Generates sound waves for
motion detection based on a very high reliability doppler effect.
Figure 11: RADAR HB100 [1]20
Figure 12: RADAR HB100 Diagram [1]
This module contains the following features:
● Non-contact detection [1]
● Regardless of temperature, humidity, noise, airflow, dust, light, suitable for a
harsh environment. [1]
● Strong resistance to RF interference [1]
● The output capacity is small and does not endanger the human body. [1]
● Long-distance: detection range more than 20 meters. [1]
● Receiver: Sensitivity (10dB S / N ratio) 3Hz to 80Hz broadband: -86dBm 3Hz to
80Hz 10uV [1]
● Radiation pattern: Vertical beamwidth 3dB: 36 degrees, horizontal beam width
3dB: 72 degrees [1]21
Figure 13: Horizontal and Vertical Beamwidth [2]
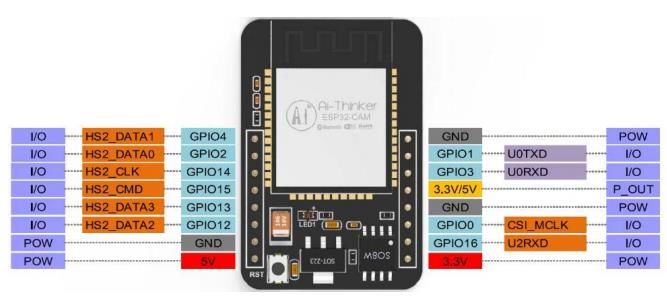
3.1.3 KIT ESP32 CAM
To be suitable for tracking and managing speed-breaking vehicles, this project uses the
ESP 32 CAM Kit to record management images. The ESP32-CAM is a small size, low-
power consumption camera module based on the ESP32. It comes with an OV2640
camera and offers an onboard TF card slot. ESP32-CAM can be widely used in smart IoT
applications such as wireless video surveillance, upload Wi-Fi images, QR recognition.
Figure 14: KIT ESP32 Cam [20]22
Figure 15: KIT ESP32 Map Pins [20]
Figure 16: KIT ESP32 Schematic [20]23
This module contains the following features:
● FPC connector. [20]
● Support OV2640 camera or OV7670 camera. [20]
● Output Image Format: JPEG (OV2640 only), BMP, GRAYSCALE. [20]
● Peripheral communication: UART / SPI / I2C / PWM. [20]
● UART baud rate: default 115200bps. [20]
3.1.4 LCD 16X2 Screen
LCD text 1602 is a familiar product inelectronic projects because it is easy to use and
highly applicable.
Figure 17: LCD Screen [21]
This module contains the following features:
● R / W selects read or write mode, high R / W activates read mode, low R / W
activates write mode. [21]
● Operating voltage: 5V. [21]
● Vee: As a contrast adjustment pin, the contrast will change according to the
voltage values applied in this; usually, the standard-setting is 0.4V to 0.9V. [21]24
3.1.5 I2C Converter Circuit for LCD
LCD has too many pins, making it challenging to connect and occupy many
microcontroller pins. The I2C converter module for LCD will solve this problem. Instead
of using at least six microcontroller pins to connect to the LCD (RS, EN, D7, D6, D5, and
D4), the conversion module only needs to Use two pins (SCL, SDA) for connection. The
I2C converter module supports all kinds of LCDs using the HD44780 driver (LCD 1602,
LCD 2004) connected to the microcontroller via I2C communication, compatible with
most of today’s microcontrollers.
Figure 18: I2C Module [22]
This module contains the following features:
● Operating voltage: 2.5-6V DC. [22]
● Monitor support: LCD1602,1604,2004 (driver HD44780). [22]
● Communication: I2C. [22]
● Default address: 0X27. [22]
● Built-in contrast-adjustable rotating resistor for LCD. [22]25
3.2 System Building
3.2.1 System Diagram
Speed detection systems can be divided into two main categories: amplifier circuit and
frequency counter for speed display. The proposed block diagram for a Doppler radar-
based vehicle speed detection system is shown in Figure 13. The speed detection
system will manage the speed limit of the vehicle on the road.
Figure 19: System Diagram
The speed of the vehicle is obtained from the continuous wave Doppler radar, which
can detect moving the movement of the object or speed through the Doppler effect.
The radar chosen for this system is HB100 with a transmitting frequency of 10.525GHz.
The radar module operates at + 5Vdc for continuous-wave operation (CW). Therefore,
the + 12V battery is used as a power source by converting it to + 5V through a voltage
regulator using LM2596S. The output of a 12V to 5V voltage regulator circuit is
connected to the + 5V pin of the module. After powering the radar module, the system
starts to operate, and the module sends the transmitted signal from the antenna to the
vehicle. Then, the reflected signal is returned to the transceiver antenna with a26
variable frequency. The difference between the transmitted and received signals is
called Doppler displacement. A microcontroller only works if its supply voltage is at
least 3.5V. Hence, a high gain low-frequency amplifier is connected to the IF terminal
to amplify the Doppler shift. The output of the amplifier is sent to the microcontroller.
The purpose of the microcontroller is to calculate the speed of the vehicle through its
frequency, which is the main factor that represents the speed. After performing the
vehicle speed calculation, the LCD screen is used to display the vehicle speed. If the
vehicle speed exceeds the permitted speed, the buzzer will sound. At the same time,
the ESP32 CAM will take pictures and save them to the memory card.
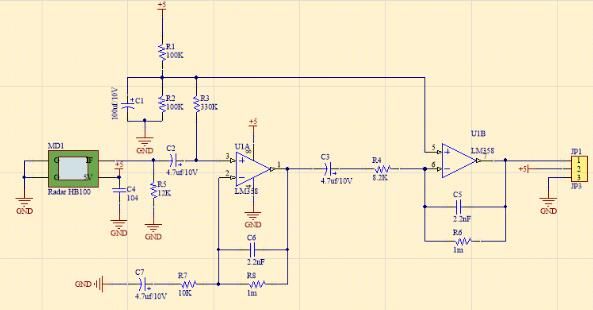
3.2.2 Amplifier Circuit for Radar HB100
The radar doppler determines the frequency change in electromagnetic waves due to
the movement of scattering closer to or away from the Observer by measuring the
phase change occurring in electromagnetic waves in a series of pulses. The Doppler
frequency is negative for objects too far away from the radar and positive for things in
the radar detection area. The system can be used in real-time applications
independent of temperature, humidity, airflow noise, dust, light. Since the sensor
output is a sine wave with a minimal amplitude, it should be amplified by the amplifier
before further processing.
Figure 20: Amplifier Circuit Diagram27
Figure 21: 3D Print Circuit
In this system, the continuous wave Doppler (CW) radar is a sensor combined with the
microcontroller to calculate the vehicle speed. Furthermore, the amplifier is used to
amplify the voltage level to control the microcontroller since the sensor output is in the
form of an analog signal. The sensor output is within the audio frequency range so that
the frequency is below the speed limit, i.e., close to 1.1Khz. The amplifier IC used for
this purpose is Quad LM358 op-amp. The output signal from the radar is in the range of
a few millivolts, so an amplifier is needed to convert the voltage level to a point where
a TTL logic can be controlled (Transistor Logic).
To minimize the effects of the noise, amplifiers need to be performed in two stages.
The first stage is configured as a non-inverting amplifier. Since the sensor output is a
small DC value (0.01 to 0.2Vdc), it is necessary to AC coupling of the output and
amplified at least 100 times for microcontroller control. The output of the first stage is
a sinusoidal signal with a small DC deviation. The capacitor filters the DC component at
the output. Assume Av1 = 100, for a non-inverting amplifier:
(4)28
From the datasheet of LM358, choose Rin1 = 10kΩ so that the output voltage is about
5V.
The second stage is configured as an inverting amplifier. The 2.2nF capacitor in the
amplifier feedback line configures an active low pass filter. High-frequency interference
is filtered, and the accuracy of the system is improved. The two stages are cascaded to
achieve the overall result of the amplifier. The second stage acts as a comparator, and
the output generated is the waveform received by the microcontroller.
(5)
The design of the amplifier circuit uses the op-amp LM324 as the driver selected 5V as
Vcc. For cascading stages, the Vbias for each stage should be 2.5V.29
R1 = R2 = 100kΩ
For minimum error due to input bias, currents must be reduced to almost 0.01mA
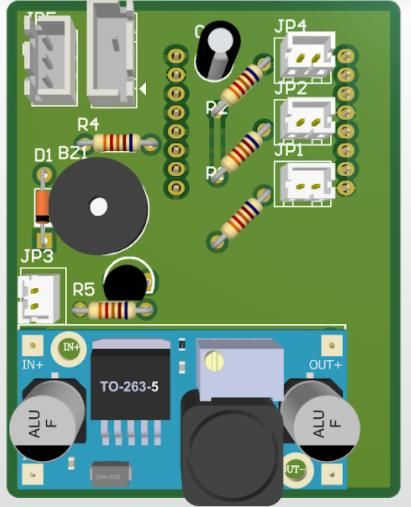
3.2.3 Circuit Connection to the System
The Speed monitoring system is assembled of the following blocks:
● Power unit: provides 5V power for the whole system.
● Installation block: easily adjust the speed limit.
● Speed reading unit: get the required input data
● Display unit: shows the frequency and speed of the vehicle.
● Notification block: when a vehicle exceeds the permitted speed, the buzzer will
signal.
Figure 22: Front of Circuit30
Figure 23: Back of Circuit
The doppler displacement equation is used to calculate the relationship between the
frequency change and the speed of a moving object’s speed.
fd = 2 * cosA * f * v / c (6)
● fd: frequency change in Hz (i.e., frequency of the output signal from the radar)
● v: velocity of the moving object
● c: velocity of electromagnetic waves in vacuum
● f: frequency of wave transmitted from the sensor (10,525 GHz)
Assuming the object is in front such that the value of angle cosA = 1, the expression for
the velocity of the object decreases to:
v = fd / 19.49074 (km / h)31
3.3 Software Building
There are several functions to explain in this project, but I will focus on four main
function will be focus on.
Figure 24: Function Flow
In the first block of function, the radar speed gun starts the Begin the shoot out and
captures the frequency bounce back from the object, by setting capture measurement
to zero, and begins the capture_start.
The second function Available, the function checks all frequencies and calculates the
frequency sent out and bounces back from the object to the device.
Function Read starts by the time the frequency bounces back, the gun will read all the
frequency from HB100, and starts to sort out.
Function CountToFrequency starts when function Read has been done. This function
counts the Frequency bounce back from the object and counts it, then compares with
the first frequency shoot out from the Begin.32
Figure 25: Waveform Calculation
We used the Interrupt Service Routine(ISR) to capture the timer vector, also to handle
the capture case and when overflow interrupts were pending( for example interrupts
were disabled for a while), or where the overflow occurred while this ISR was starting
up.
ISR also used timer to capture the signal from Radar HB100 and using that signal to
calculate when the range of the wave have to be discontinued. We used the formular:
t = 1/f (7)
Where t is the waveform period, and f is the length of two signal. After the calculation,
the signal will be stored in a buffer and then compare with the first signal were
generated from the Begin, from there the ESP32 can calculate the speed.33
4. TESTING AND RESULT
4.1. Speed Calculation
If the 'f' is the value of the frequency of the microcontroller, the corresponding speed
in Km / h is obtained by dividing it by a factor of 19.49. Some values for their respective
frequencies and speeds are shown in the table below:
Table 1: Speed Calculation
Frequencies Speed
0 Hz 0.00 km/h
100 Hz 5.13 km/h
400 Hz 20.52 km/h
800 Hz 41.04 km/h
1200 Hz 61.57 km/h
4.2 Accuracy when Measuring Speed.
Testing the overall system and sensor accuracy in speed measurement requires
standard calibration equipment such as a speed gun to determine the speed of a
moving vehicle. However, due to the lack of such resources available for testing, the
system’s accuracy of the system could not be accurately determined.34
Table 2: Accuracy compare
Speed from the car meter Speed from the system
0 Km/h 0 Km/h
10 Km/h 11 Km/h
17 Km/h 16 Km/h
20 Km/h 20 Km/h
25 Km/h 24 Km/h
30 Km/h 31 Km/h
35 Km/h 35 Km/h
The system accuracy is low. This could be due to several reasons:
● The direction between the motorcycle and the sensor is not perfectly aligned
(i.e., angle A is not zero).
● The table is based on the observations of the motorcyclist and the observer
looking at the LCD screen, making it difficult to synchronize the readings
made by two observers.
● The output is affected by the number of objects that move around.
4.3 Comparison with Other Speed Measurement Method
4.3.1 GPS Based System
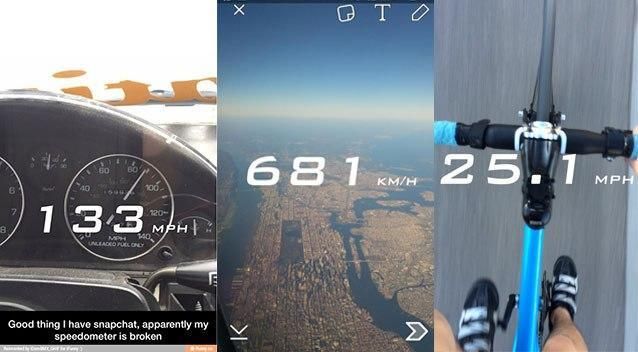
Figure 5 is shown an example of a GPS based system method using in an application
called Snapchat. In ideal conditions, this application shows the speed of the vehicle or
the speed of the person using that application in real-time with an almost accurate
speed show on a vehicle.35
We have tested this method again using the same application on a smartphone using a
car in two conditions, normal weather and snowing day, and in the open road also
inside the tunnel.
Table 3: Speed compare in open normal road and snowing conditions.
Speed by vehicle Speed show on the app
10 km/h 9.54 km/h
20 km/h 19.7 km/h
30 km/h 29.8 km/h
40 km/h 39.6 km/h
Table 3 shows the speed comparison between the speed provided by the car and the
speed on the application. As we can see, on the open road both in normal and snowing
weather the speed provided by both systems has almost the same value.
After the open road test, we tried going into the tunnel to compare both systems
again. This time we had different results.36
Table 4: Speed compare inside tunnel road normal and snowing conditions.
Speed by vehicle Speed show on the app
10 km/h 6.51 km/h
20 km/h 15.25 km/h
30 km/h N/A
40 km/h N/A
In this test, we are using the same speed as the test on the open road before. Table 4
has shown the result, the speed did not have the same numbers anymore, even if we
run faster at 30 km/h and so on, the system even cannot measure the speed. This can
be explained as the GPS-based system has to use many satellites to calculate and
measure, one of the weaknesses of this system is an indoor condition or complicated
environment such as jungle or caved. At this condition, the signal from both devices
and satellites has been blocked, so the calculation or measurement is impossible or not
accurate. Unlike GPS based system, the radar using the doppler effect has shown
results in a very accurate way.
4.3.2 Speed Measurement Based on Image
This technic is based on a single frame or a single camera to calculate speeds.
Unfortunately, we did not have the equipment to test, for more information, we can
read more from Intraframe Scene Capturing and Speed Measurement Based on
Superimposed Image. But as far as we know, this technic has been limited by the
camera and environment such as when foggy weather or darkness, the ability of the
camera has been limited in those conditions and leads to a false result.37 5 CONCLUSION AND FUTURE WORK The project introduces some speed measuring devices in traffic gives an overview of speed measurement methods. Presenting the principles of building hardware circuit systems to measure vehicle speed and save captured images to memory cards. The designed speed detection system is capable of continuously monitoring the vehicle's speed. The sensor works well for the car at a distance of about 7 meters. The output is more accurate when there are no other moving objects around. The value of each passing vehicle's speed is displayed on the LCD screen. With each passing speed vehicle passing the sensor, the horn and the camera are activated, and the image is saved on the SD card. The project camera used is a 2 Megapixel high-definition camera that communicates quickly, but the image quality is inferior and challenging to capture high-speed vehicles. Future development direction Expanding the model with more optimized types of sensors and cameras Develop website system for easy data management. Combine with image processing techniques to get high-quality data.
38

REFERENCES
     1. Agilence. 2016 HB100 Microwave Sensor Application Note, MSAN-001, ST
        Engineering Co. Ltd Accessed 08.10.2020
        Microsoft Word - MSAN001-V101-HB _2_.doc (limpkin.fr)
     2. Amit, S., Abhishek, T. 2015 Low-Cost X-Band Radar System for Multiple Target
        Detection, International Journal of research in Engineering Technology, 4(3)
        Accessed 08.10.2020
        Low cost x band radar system for multiple target detection by eSAT Journals -
        issuu
     3. Typical Doppler Signal Amplifier, April (2012)
     4. Alessandretti, G., A. Broggi, and P. Cerri. 2007 “Vehicle and guard rail detection
        using radar and vision data fusion,” IEEE Transactions on Intelligent
        Transportation Systems, Vol. 8, No. 1, 95–105,       . Accessed 02.10.2020
        Vehicle and Guard Rail Detection Using Radar and Vision Data Fusion | IEEE
        Journals & Magazine | IEEE Xplore
     5. C. Leo, D. David, 2008. “A License Plate Recognition and Speed Detection System”
     6. Bell,David A Bell.1997. “Operational Amplifiers and Linear Ics,” 2nd Edition.,
        Pearson
     7. Droitcour, A. D., O. Boric-Lubeck, V. M. Lubeck, J. Lin, and G. TA Kovacs.2004
        “Range correlation and i/q performance benefits in single-chip silicon doppler
        radars for noncontact cardiopulmonary monitoring,” IEEE Transactions on
        Microwave Theory and Techniques, Vol. 52, No. 3, 838–848.
     8. De la Rocha, E. and Palacios.R. 2010 Image Processing Algorithms for Detecting
        and Counting Vehicles Waiting at a Traffic Light, Journal of Electronic Imaging.`
     9. H. Asha, R Uday Shankar, Rashmin “Radar Based Cost-Effective Vehicle Speed
        Detection Using Zero Cross Detection”
     10. Lamis. A. 2011Radar System Design, August
     11. "LM358N Low Power Quad Operational Amplifiers" National Semi. Web. 28 Apr.
        2010.
39
12. Mike Golio, “Microwave and RF Product Applications,” 1st Edition,2005, CRC
PRESS
13. Lee Teschler, “Data injection – Testing autonomous sensors through realistic
simulation”.2019. Accessed 03.12.2020. Data injection — Testing autonomous
sensors through realistic simulation (microcontrollertips.com)
14. Hear and There: SOUND from Everywhere. Accessed 01.12.2020. Hear and There:
Sounds from Everywhere! · Frontiers for Young Minds (frontiersin.org)
15. Lidar systems simulation and validation. Accessed 03.01.2021. Lidar systems
simulation and validation | Simcenter (siemens.com)
Intraframe Scene Capturing and Speed Measurement Based on Superimposed
Image: New Sensor Concept for Vehicle Speed Measurement. Accessed
03.03.2021. Intraframe Scene Capturing and Speed Measurement Based on
Superimposed Image: New Sensor Concept for Vehicle Speed Measurement
(hindawi.com)
16. Kelli Burns. “Should Snapchat Delete the Speed Filter”.2016. Accessed 4.10.2020.
Should Snapchat Delete the Speed Filter? – Kelli S. Burns, Ph.D. (kellisburns.com)
17. Akshat Sharma. “ How IoT tracking devices can change the landscape of the fleet
management business”. 2019. Accessed 5.10.2020. How IoT tracking devices can
change the landscape of the fleet management business - JungleWorks
18. Wemos D1, online. Accessed 02.03.2021. For Wemos D1 Mini For Arduino UNO R3
D1 R32 ESP32 WIFI Wireless Bluetooth Development Board CH340 4M - buy from 9$ on
Joom e-commerce platform
19. ESP32 – DevKitC. Components101. Accessed 04.02.2021. ESP32 DevKitC Pinout,
Overview, Features & Datasheet (components101.com)
20. Kit ESP32 Cam. Banggood. Accessed 25.01.2021. 3 pcs esp32-cam wifi + bluetooth
camera module development board esp32 with camera module ov2640 Sale -
Banggood.com
21. LCD Screen. Pinterest. Accessed 15.01.2021. 16x2 LCD PinOut (pinterest.com)
22. I2C module. PCBoard. Accessed 15.01.2021. LCD Driver Module With I2C
Interface (pcboard.ca)40
You can also read