Velocity increases at Cook Glacier, East Antarctica, linked to ice shelf loss and a subglacial flood event - The Cryosphere
←
→
Page content transcription
If your browser does not render page correctly, please read the page content below
The Cryosphere, 12, 3123–3136, 2018
https://doi.org/10.5194/tc-12-3123-2018
© Author(s) 2018. This work is distributed under
the Creative Commons Attribution 4.0 License.

Velocity increases at Cook Glacier, East Antarctica, linked to ice
shelf loss and a subglacial flood event
Bertie W. J. Miles, Chris R. Stokes, and Stewart S. R. Jamieson
Department of Geography, Durham University, Science Site, South Road, Durham, DH1 3LE, UK

Correspondence: Bertie W. J. Miles (a.w.j.miles@durham.ac.uk)

Received: 17 May 2018 – Discussion started: 1 June 2018
Revised: 21 August 2018 – Accepted: 5 September 2018 – Published: 2 October 2018

Abstract. Cook Glacier drains a large proportion of the            1   Introduction
Wilkes Subglacial Basin in East Antarctica, a region thought
to be vulnerable to marine ice sheet instability and with po-      Ice which is grounded well below sea level in the marine
tential to make a significant contribution to sea level. Despite   basins of Antarctica with an inland-sloping bed is potentially
its importance, there have been very few observations of its       vulnerable to marine ice sheet instability. This is because an
longer-term behaviour (e.g. of velocity or changes at its ice      initial grounding line retreat into deeper water can create an
front). Here we use a variety of satellite imagery to produce      unstable and self-sustaining feedback leading to increased
a time series of ice front position change from 1947 to 2017       ice discharge, inland thinning, and a rapid sea level contribu-
and ice velocity from 1973 to 2017. Cook Glacier has two           tion (Hughes, 1981; Schoof, 2007). Floating ice shelves are
distinct outlets (termed East and West), and we observe the        crucial to the stability of ice streams and outlet glaciers that
near-complete loss of the Cook West Ice Shelf at some time         drain marine basins because they can exert an important but-
between 1973 and 1989. This was associated with a doubling         tressing effect (Furst et al., 2016). Thinning or retreat of these
of the velocity of Cook West Glacier, which may also be            ice shelves reduces their ability to restrain flow from the ice
linked to previously published reports of inland thinning. The     sheet (Pritchard et al., 2012). This is evident in parts of the
loss of the Cook West Ice Shelf is surprising given that the       West Antarctic Ice Sheet (WAIS) where the feedbacks result-
present-day ocean climate conditions in the region are not         ing from the rapid thinning of ice shelves (Paolo et al., 2015)
typically associated with catastrophic ice shelf loss. How-        has resulted in an increased discharge of ice into the ocean
ever, we speculate that a more intense ocean climate forcing       (Mouginot et al., 2014). This oceanic-driven thinning of ice
in the mid-20th century may have been important in forcing         shelves may have destabilized the Thwaites Glacier basin,
its collapse. Since the loss of the Cook West Ice Shelf, the       where marine ice sheet instability may already be underway,
presence of landfast sea ice and mélange in the newly formed       and which might undermine much of the WAIS over the com-
embayment appears to be important in stabilizing the glacier       ing decades to centuries (Joughin et al., 2014).
front and enabling periodic advances. We also show that the           The Wilkes Subglacial Basin (WSB) in East Antarctica
last calving event at the larger Cook East Ice Shelf resulted in   contains 3–4 m sea level equivalent of ice grounded below
the retreat of its ice front into a dynamically important por-     sea level (Mengel and Levermann, 2014). Geological evi-
tion of the ice shelf and observe a short-lived increase in ve-    dence suggests the WSB may have made substantial ( ∼ 3 m)
locity of Cook East between 2006 and 2007, which we link to        sea level contributions during the warm interglacials of the
the drainage of subglacial Lake Cook. Taken together, these        Pliocene (Williams et al., 2010; Cook et al., 2013; Bertram
observations suggest that the velocity, and hence discharge,       et al., 2018), which are thought to represent the best analogue
of Cook Glacier is highly sensitive to changes at its terminus,    for near-future climates under continued global warming. In-
but a more detailed process-based analysis of this potentially     deed, numerical ice sheet models predict future sea level con-
vulnerable region requires further oceanic and bathymetric         tributions from the WSB, but the magnitude and timing of the
data.                                                              contributions vary (Golledge et al., 2015; Ritz et al., 2015;
                                                                   DeConto and Pollard, 2016). Furthermore, dynamical mod-

Published by Copernicus Publications on behalf of the European Geosciences Union.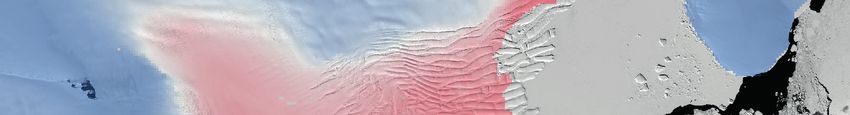
3124                                                                    B. W. J. Miles et al.: Velocity increases at Cook Glacier

elling of the present-day ice sheet margin of the WSB shows
                                                                            (a)
that its stability might be controlled by a relatively small
band of coastal ice (∼ 80 mm sea level equivalent), which
is preventing a self-sustained discharge of the entire basin
(Mengel and Levermann, 2014). The majority of this coastal
band of ice is drained by Cook Glacier (Mengel and Lever-                     David
mann, 2014), which is one of the largest in Antarctica. Its                                             Wilkes Subglacial
                                                                                                             Basin
current configuration consists of two distinct distributaries:
Cook East and Cook West (Fig. 1). Cook East flows into a
large 80 km long ice shelf, whereas Cook West terminates
close to, or at, its grounding line (Fig. 1). Despite having
one of the largest annual discharges of any Antarctic outlet
glacier (Rignot et al., 2013) (∼ 36 Gt a−1 ), and given its po-
tential significance to the stability of the WSB, there have                Bedrock elevation (m)                               Ninnis
been very few observations of its recent behaviour. Along                   -2141           3441
                                                                                                             Cook East    Cook West
                                                                                                                                               Mertz
with Totten Glacier, it was specifically highlighted in the                   153° E                152° E                 151° E                       150° E
most recent IPCC report (Vaughan et al., 2013) as being po-                 (b)
tentially vulnerable to marine ice sheet instability, but, unlike
Totten, there has been no obvious changes in ice shelf thick-
ness, ice surface elevation, or grounding line position over                                                             Cook West
the past decade (Pritchard et al., 2009; McMillan et al., 2014;     69° S
                                                                                                                                           Cape
Paolo et al., 2015; Konrad et al., 2018). However, some stud-                                                                            Freshfield
ies have previously highlighted Cook as a region of mod-
est inland thinning (e.g. Shepherd and Wingham, 2007), and
                                                                                                Cook East
Frezzotti et al. (1998) reported a major retreat of the Cook                                    Ice Shelf
West Glacier, which others have suggested might be flowing
too fast to be in balance (Rignot, 2006). In this paper, we

                                                                                                                                                             68° S
report on the long-term changes in Cook Glacier by combin-                                                                        Grounding line
ing measurements of ice front position from 1947 to 2017,                                                                       velocity (m yr -1)
                                                                                      Cape                                     0                      1512
together with glacier velocity estimates from 1973 to 2017                           Hudson
                                                                                                                                             km
from optically based feature tracking. Our results indicate                                                                    0    5 10 15 20
that, despite little change over the past decade, there has been                       154° E                153° E                 152° E

a long-term increase in the velocity of both Cook East and
Cook West glaciers that can be linked to changes at its ice         Figure 1. (a) Bedmap2 bed elevation of the Wilkes Subglacial Basin
front.                                                              (Fretwell et al., 2013); note that Cook East and West drain a large
                                                                    proportion of the Wilkes Subglacial Basin. (b) Landsat-8 image of
                                                                    Cook East and West glaciers from February 2017, overlain with
                                                                    velocities (Rignot et al., 2011) and grounding line (Depoorter et
2     Methods                                                       al., 2013).

2.1    Ice front position change
                                                                    al., 2013, 2016), giving an estimated total error of 1.5 pixels
We revisit and extend the results of Frezzotti et al. (1998)        (22.5–90 m). These errors are in the range of similar stud-
by using a combination of oblique aerial photography from           ies and are insignificant when quantifying ice front position
“Operation Highjump” in 1947 and ARGON, RADARSAT,                   change of large Antarctic outlet glaciers (Miles et al., 2013,
ASTER, Landsat, and WorldView-2 satellite imagery to cre-           2016). Because the 1947 aerial photographs were taken at
ate a 70-year time series of ice front position change from         an oblique angle, we estimate the ice front position relative
1947 to 2017 for both Cook West and Cook East glaciers              to stable features which have not moved over time (e.g. ice
(Table S1 in the Supplement). Changes in ice front position         rises). This creates larger uncertainties compared with mea-
were quantified by the well-established box method, which           surements from orthorectified satellite imagery. We estimate
takes into account uneven changes along the ice front (e.g.         these uncertainties at ∼ ± 2 km.
Moon and Joughin, 2008). Errors using this method arise
from the co-registration of satellite images, quantified by dig-    2.2           Glacier velocity from feature tracking
itizing the distance between stable features on image pairs
(1 pixel) and the manual digitization of the ice front, which       Estimates of glacier velocity were derived using COSI-Corr
has been calculated at 0.5 pixels in other studies (e.g. Miles et   (Co-registration of Optically Sensed Images and Correlation)

The Cryosphere, 12, 3123–3136, 2018                                                              www.the-cryosphere.net/12/3123/2018/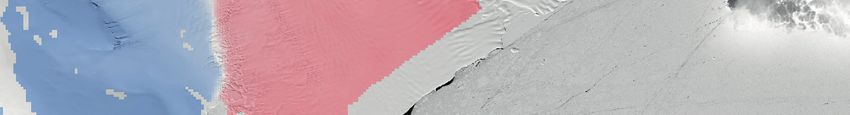
B. W. J. Miles et al.: Velocity increases at Cook Glacier                                                                    3125

feature-tracking software (Leprince et al., 2007; Scherler et     each epoch all pixels were sampled within the defined box;
al., 2008). This software tracks spectral signatures which re-    i.e. there were no rejected pixels. For Cook East the defined
late to features on the glacier surface that can be identified    box was on a section across the grounding line (Fig. S1).
in multiple images through time, and it has been shown to         As Cook West terminates close to its grounding line, we ex-
be one of the most robust methods of glacier velocity map-        tracted velocities 2 km upstream (Fig. S1).
ping (Heid and Kääb, 2012). It requires pairs of co-registered
optical cloud-free images which are spaced close enough in        2.3    Ice front advance rate
time for surface features to be identified in both images. In
this study, the temporal resolution of image pairs was largely    Preliminary inspection of the imagery clearly indicated that
determined by the availability of appropriate satellite im-       there have been no major calving events on the Cook East
agery, which was generally sparse due to a combination of         Glacier since 1973 because the shape of the ice margin is un-
poor coverage and persistent cloud cover. However, by using       changed. Thus, we were able to create a time series of the
a combination of Landsat-1, Landsat-4, Landsat-7, ASTER,          rate of ice front advance between 1973 and 2016. Although
and Landsat-8, we were able to create a velocity time series      it is not a direct measurement of glacier velocity, the rate of
from 1989 to 2016 for Cook East (Table S2) and from 1973          ice front advance is helpful in enabling additional indepen-
to 2017 for Cook West (Table S3). Image pairs were typically      dent estimates of ice advance (a proxy for ice velocity at the
spaced 1 year ±100 days apart, which is a suitable gap for the    terminus if no major calving events have taken place) further
preservation of surface features. The exception to this was in    back in time (i.e. between 1973 and 1989) and allows addi-
1973–1974, where image availability only allowed temporal         tional measurements to be made in the 1990s (Table S4). Ice
gap of 73 days (Table S3).                                        front advance rate was quantified by dividing ice front po-
   The COSI-Corr procedure first requires the accurate co-        sition change by the number of days between image pairs.
registration of image pairs. For Landsat-8 image pairs the        Taking into account the error of 1.5 pixels associated with
orbital data were of sufficient quality (e.g. Mouginot et         co-registration and manual mapping, errors were estimated
al., 2017) that no further manual co-registration was required.   between ±1 and ±86 m yr−1 , with range in error accounting
However, for all other image pairs, manual co-registration        for the varying spatial resolution of images and the temporal
was required and was achieved by using a combination of           gap between image pairs (Table S4).
nunataks and the boundaries of ice rises, which are known
to be stable features over time. Because these features are       3     Results
relatively common in the vicinity of Cook Glacier, image
pairs could be co-registered to an estimated accuracy of          3.1    Cook East
1 pixel. We used a window size of 256 × 256 pixels and a
grid size of 20 × 20 pixels to detect surface displacement,       The Cook East Ice Shelf last underwent a major calving event
which results in the production of velocity fields at a reso-     at some point between 1963 and 1973 (Figs. 2 and 3). This
lution 20 times coarser than the pixel resolution of the im-      calving event resulted in the retreat of its ice front deep into
age pair (Tables S2 and S3). Error in surface displacement        the constrained section of its embayment, resulting in the loss
was estimated at 0.5 pixels by manually tracking large sur-       of all passive ice and retreat into the dynamically constrained
face features, which is consistent with other studies using       section of the ice shelf (Furst et al., 2016) (Fig. 2). Since
this method (Scherler et al., 2008; Heid and Kääb, 2012).         1973 it has advanced ∼ 31 km and there have been no major
Total error ranged from ±51 m yr−1 in 1989 to between ±19         calving events. By extrapolating the rate of advance between
and ±24 m yr−1 from 2000 to 2017 (Tables S2 and S3).              1947 and 1963 to establish Cook East’s maximum possible
The coarser resolution and closer temporal resolution of the      extent, it is clear that its present-day ice front is further ad-
1973–1974 Landsat-1 image pairs resulted in a considerably        vanced (by ∼ 6 km) than the point at which it last underwent
higher error of ±450 m yr−1 (Table S3).                           a major calving event/retreat.
   Post-processing of ice velocity grids can reduce noise and        The velocity of Cook East increased approximately 20 %
remove erroneous pixels (e.g. Mouginot et al., 2017). We re-      from 416 ± 51 m yr−1 in 1989 to 496 ± 19 m yr−1 in 2000–
moved pixels where the velocity was greater than ±25 % of         2001 (Fig. 3b). Throughout 2001 to 2016 velocity remained
the MEASURES ice velocity product in velocity grids from          consistent with an average speed of 489 m yr−1 , with little
2000 to 2017 and ±40 % in the velocity grid from 1989 to          year-to-year deviation. The only exception to this was be-
account for any larger changes in glacier velocity. For the       tween 2006 and 2007, where Cook East was flowing 12 %
1973–1974 velocity grid, we filtered out all pixel values be-     (545 ± 22 m yr−1 ) faster than its 2001–2016 average. Veloc-
low 450 m yr−1 to account for the larger error of the Landsat-    ity profiles across the Cook East Ice Shelf show similar pat-
1 image pair. We then applied a low-pass filter to all velocity   terns (Fig. 4); with the exception of 1989 and 2006–2007,
grids to create the final products (Fig. S1 in the Supplement).   all profiles are clustered in a narrow band. In 1989 veloc-
To create the velocity time series, we extracted the mean         ity was anomalously slow across the entire ice shelf, and
value of pixels within a defined box across all epochs, and in    between 2006 and 2007 velocity was anomalously fast. No-

www.the-cryosphere.net/12/3123/2018/                                                    The Cryosphere, 12, 3123–3136, 2018

3126                                                                        B. W. J. Miles et al.: Velocity increases at Cook Glacier

                                                                                                               20   (a)

                                                                         Ice front position change (km)
                                                                                                               15

                                                                                                               10

                                                                e
                                                              ic
                                                           ic
                                                                                                               5

                                                          e
                                                        am

                                                        ic
   Ice front

                                                    yn

                                                     ve
                                                  si
                                                 D
        1947                                                                                                   0

                                                        s
                                                     Pa
        1963
                                                                                                               -5
        1973
        Mar 1989
                                                                                                              -10
        Nov 1989
        1997                                                                                                  -15
        2000                                                                                                    1947 1953 1959 1965 1971 1977 1983 1989 1995 2001 2007 2013

        2001                                                                                                        (b)
        2002                                                                                                  550
        2006

                                                                           Velocity (m yr -1)
        2007
        2008                                                                                                  500
        2009
        2010
        2011                                                                                                  450
        2012
        2013
                                               Passive boundary                                               400
        2014
                                               Grounding line
        2015                                                   km
        2016                                0 3 6      12     18

Figure 2. Mapped ice front position of the Cook East Ice Shelf be-                                                  (c)
                                                                           Ice front advance rate (m yr -1)

tween 1947 and 2016, with the passive ice boundary overlain (Furst                                            800
et al., 2016). Note that the 1973 ice front position of Cook East
lies several kilometres inland of the passive ice boundary. The grey                                          750
box delineates the region where ice front position change was cal-
culated.                                                                                                      700

                                                                                                              650
tably, these patterns also persist several kilometres upstream
of the grounding line (Fig. 4).
                                                                                                              600
   There was little change in the rate of mean ice front ad-
vance between 1973 and 1997. However, from 1997 to 2000                                                         1973      1979   1985   1991   1997     2003    2009    2015
(720 ± 20 m yr−1 ) and from 2002 to 2006 (749 ± 8 m yr−1 )
there was a consistent increase in the rate of ice front advance       Figure 3. (a) Ice front position change of the Cook East Ice Shelf
                                                                       during 1947–2016 from the grey box delineated in Fig. 2. (b) Mean
(Fig. 3c). This is consistent with velocity estimates from the
                                                                       velocity extracted at the grounding line of Cook East during 1989–
grounding line which show an increase in velocity between
                                                                       2016. (c) Cook East ice front advance rate during 1973–2016. Note
1989 and 2001. Throughout 2002–2016 there were small in-               the increase in both velocity (b) and ice front advance rate (c) in the
ternannual variations in ice front advance rate, with no obvi-         1990s and between 2006 and 2007. Grey bars represent the errors
ous trend. In a similar manner to velocity estimates from the          in both (b) and (c).
grounding line, the only exception to this was between 2006
and 2007, where the ice front advanced at 792 ± 30 m yr−1 ,
higher than the 2002–2016 average (752 m yr−1 ) (Fig. 3c).             the Cook West Ice Shelf retreated 13 km close to, or onto, its
                                                                       present grounding line (Figs. 5 and 6). This resulted in the es-
3.2    Cook West                                                       timated total loss of 1200 km2 of ice shelf between 1947 and
                                                                       1989. The large retreat of 5 km between November 1973 and
From 1947 to 2018 the Cook West ice front retreated approx-            January 1974 (Figs. 5 and 6) suggests that this retreat was
imately 34 km (Figs. 5 and 6). This retreat largely occurred           more likely to have occurred in the mid-1970s. Since 1989,
in two stages, with retreat initiating between 1947 and 1963,          observations show relatively little change, with only minor
when Cook West retreated 20 km, before stabilizing between             fluctuations (∼ 3 km) in ice front position. Perhaps surpris-
1963 and 1973, when the ice front retreated 2.8 km and there           ingly, we observe no signs of a re-advance of Cook West
was no obvious change in the surface structure of the ice              Glacier comparable to its pre-1989 ice front position.
shelf (Fig. 5). From 1973 to 1989 the remaining section of

The Cryosphere, 12, 3123–3136, 2018                                                                                              www.the-cryosphere.net/12/3123/2018/
B. W. J. Miles et al.: Velocity increases at Cook Glacier 3127
900
800
700
Velocity (m yr -1)
600
1989
2000/ 01
2006/ 07
500 2007/ 08
2008/ 09
2009/ 10
400 2013/ 14
2014/ 15
2015/ 16
MEaSUREs
300
-10 0 10 20 30 40 50 60
Distance from grounding line (km)
Figure 4. Cross-profile of the velocity of the Cook East Ice Shelf. Velocities were extracted along the same series of points shown in the
inset. The dotted line represents velocities extracted from the same cross-profile of the MEaSUREs dataset.
(a) Image date: 2017 (b) 1947 (c) 1963
Ice front
1947
1963
1973
1974
1989
2000
2001
2003
2004 Cape Freshfield
Ice front
2006
2007 (d) 1973 (e) 1989
2008
2009
2010
2011
2012
2013
2014
2015
2016
Grounding line
km 2017
0 2 4 8 12 2018
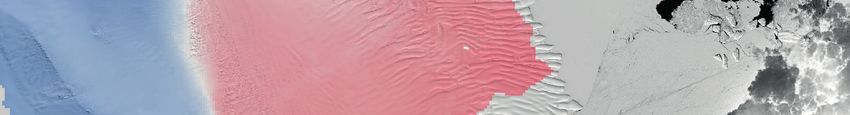
Figure 5. (a) Mapped ice front position of Cook West between 1947 and 2018. Note the exceptional retreat between 1947 and 1989. Grey
box delineates the region where ice front position change was calculated. Grounding line is from Depoorter et al. (2013). (b–e) Images of
Cook West Glacier in (b) 1947, (c) 1963, (d) 1973, and (e) 1989.
The velocity of Cook West Glacier increased from 692 ± variations in the velocity of Cook West between 2001 and
450 m yr−1 in 1973–1974 to 1438 ± 51 m yr−1 in 1989 2017, with no velocity estimates deviating from ±5 % of the
(Fig. 6b). Although the error associated with the 1973–1974 2001–2017 mean (1368 m yr−1 ). Between 2001 and 2017,
measurement is high, the pair of measurements still demon- Cook West was flowing fastest from 2001 to 2002 at 1463 ±
strates a major increase in velocity, which coincides with the 24 m yr−1 and slowest from 2016 to 2017 at 1306±22 m yr−1
retreat of the Cook West ice front (Fig. 6b). There were small (Fig. 6b).
www.the-cryosphere.net/12/3123/2018/ The Cryosphere, 12, 3123–3136, 20183128 B. W. J. Miles et al.: Velocity increases at Cook Glacier
4 Discussion 0
-5
Ice front change (km)
4.1 Cook East
-10
4.1.1 Long-term behaviour of the Cook East Ice Shelf -15
-20
The calving of the Cook East Ice Shelf between 1963 and
1973 resulted in the loss of dynamically important ice (Furst -25
et al., 2016) (Fig. 2). The retreat of large Antarctic ice shelves -30
into the dynamically important sections of their embayment
-35
is unusual (Fig. 2); calving events typically occur within the
(a)
bounds of the unconstrained section of ice shelves (Miles et -40
1947 1954 1961 1968 1975 1982 1989 1996 2003 2010 2017
al., 2013). However, since the retreat between 1963 and 1973,
the Cook East Ice Shelf has re-advanced and has remained 1550
stable, which is reinforced by data suggesting that there has 1450
been little change in the grounding line position of Cook East 1350
in recent years (Konrad et al., 2018). This indicates that a 1250
terminus retreat deep into an ice shelf embayment does not
Velocity (m yr-1)
1150
necessarily result in an irreversible retreat. This observation 1050
could be an important consideration in improving our under- 950
standing of how recent and future large calving events influ- 850
ence ice shelf stability in Antarctica, e.g. Larsen C (Jansen 750
et al., 2015). The return period of any potential calving cycle 650
at Cook East may be too long to determine if this relatively 550
deep retreat into the embayment is typical of its normal be- 450
(b)
haviour (Figs. 2 and 3). Based on the morphology and size 350
of an iceberg located near the Mertz Glacier Tongue in satel-
lite imagery in 1984, Frezzotti et al. (1998) estimated that the
calving of Cook East between 1963 and 1973 occurred in the Figure 6. (a) Ice front position time series of Cook West between
early 1970s. This means that its current ice front position is 1947 and 2018. (b) Velocity estimates and ice front retreat of Cook
West Glacier between 1973 and 2017 based on feature tracking.
further advanced than its last calving event (Fig. 3a). How-
The grey bars represent error. Note the increase in velocity between
ever, an inspection of the current morphology of the Cook
1973–1974 and 1989 coincides with the retreat of the Cook West
East Ice Shelf reveals no obvious signs of an imminent calv- Ice Shelf.
ing event, and we suggest another calving event is at least
several years away.
The increase in velocity between 1989 and 2000–2001
4.1.2 Drainage of subglacial Lake Cook and short-lived
(416 ± 51 to 496 ± 19 m yr−1 ) coincided with an increase in
velocity increase
the ice front advance rate, and, notably, most of this acceler-
ation is concentrated between 1997 and 2002 (Fig. 3c). On
Between 1 December 2006 and 4 December 2007, the Cook
the basis of this, we suggest that the increase in velocity be-
East Ice Shelf was flowing 12 % faster than its 2001–2016
tween observations in 1989 and 2000–2001 is likely to have
average speed (Fig. 3b). A similar speed-up is also evident
occurred in the late 1990s. There are limited oceanic data
on the grounded ice upstream and across the entire ice shelf
available to investigate possible changes in oceanic condi-
(Fig. 4). This is a greater magnitude of change than ex-
tions, but a potential mechanism could be changes in ice shelf
pected by interannual variability. In Antarctica, a small num-
thickness driven by enhanced basal melting. Indeed this in-
ber of short-lived accelerations in glacier flow have been ob-
crease coincides with the intense 1997–1998 El Niño event,
served and linked to subglacial flood events perturbing basal
which has been linked to abrupt changes in environmental
conditions and leading to enhanced lubrication (e.g. Stearns
conditions in the Pacific sector of Antarctica and ice shelf
et al., 2008; Scambos et al., 2011; Siegfried et al., 2016).
mass loss (Paolo et al., 2018).
Between November 2006 and March 2008, we note that a
subglacial lake drained ∼ 450 km upstream of Cook East
Glacier (Smith et al., 2009; McMillan et al., 2013; Flament
et al., 2014), resulting in the discharge of 5.2 ± 1.5 km3 (Fla-
ment et al., 2014) or between 4.9 and 6.4 km3 (McMillan
et al., 2013) of water, the largest single subglacial drainage
event ever recorded. The calculated flow path suggests that
The Cryosphere, 12, 3123–3136, 2018 www.the-cryosphere.net/12/3123/2018/B. W. J. Miles et al.: Velocity increases at Cook Glacier 3129
the flood could have reached Cook East, but not Cook West km
(Flament et al., 2014; Willis et al., 2016) (Fig. 7). Because Lake Cook 0 40 80 120 160
the timing of these two events coincides, we suggest that
the acceleration of Cook East Glacier could have been trig-
gered by the drainage of subglacial Lake Cook. The quick re-
sponse time between the onset of the drainage event and the
increase in velocity suggests that at least some of the flood
water flowed rapidly through existing channels, even if some
of the floodwater was stored in connecting subglacial lakes
(Flament et al., 2014). This adds to the few observations
which link changes in subglacial hydrology to glacier flow
dynamics in Antarctica (e.g. Stearns et al., 2008; Scambos et
al., 2011; Siegfried et al., 2016). This is important because
there are a number of other subglacial lakes which could
be routed through Cook East Glacier (Wright et al., 2008).
If any changes in subglacial hydraulic conditions occur in Cook West
Bedrock elevation (m)
the future, the sensitivity of Cook East to perturbations in its Cook East
-2141 3441
basal conditions could be an important consideration.
Figure 7. Region of most probable flow path (dashed line) of sub-
4.2 Cook West glacial Lake Cook (Flament et al., 2014) overlain on bed elevation
from Bedmap2 (Fretwell et al., 2013).
4.2.1 Link between ice shelf retreat and increased
velocity
4.2.2 Behaviour of Cook West post ice shelf loss
The near-complete loss of the Cook West Ice Shelf (Figs. 5
and 6) is highly unusual in the context of East Antarctic outlet Since the near-complete loss of the Cook West Ice Shelf, the
glaciers in the past 50 years. Broad trends in their ice front ice front has fluctuated by ∼ 3 km, but there have been no
position have been linked to climate at decadal timescales, signs of a substantial re-advance (Figs. 5 and 6). As a con-
but no other East Antarctic ice shelves have been observed sequence of the increase in Cook West’s velocity following
to retreat to their grounding lines and then not re-advanced the retreat of its ice shelf, its strain rate near the ice front will
(Miles et al., 2013, 2016; Lovell et al., 2017). Our results have increased (Benn et al., 2007). This may explain the ab-
show that the near-complete loss of the Cook West Ice Shelf sence of a re-advance because the increase in strain rate has
between 1973 and 1989 coincided with a likely doubling of resulted in an increase in the calving rate. However, the fact
Cook West’s velocity (Fig. 6). This suggests that the increase that the ice front position fluctuates by ∼ 3 km suggests that
in velocity was linked to a reduction in buttressing caused other external factors may also be important in stabilizing the
by the loss of the Cook West Ice Shelf. It would be ex- ice front position.
pected that an increase in velocity of such magnitude would The retreat of the Cook West Ice Shelf resulted in the for-
be accompanied by dynamic inland thinning. Consistent with mation of an embayment, which has been growing in size as
this notion are satellite altimetry records that, despite cover- the neighbouring Cook East Ice Shelf advanced (Fig. 1). This
ing different time periods between 1992 and 2010, all report embayment is typically filled with landfast sea ice, which
an inland thinning signal upstream of Cook West (Davis et may act to stabilize ice tongues (Massom et al., 2010). Con-
al., 2005; Zwally et al., 2005; Shepherd and Wingham, 2007; versely, sea ice break-out events have been linked to major
Pritchard et al., 2009; Flament and Remy, 2012; Schröder et instability and calving events elsewhere in East Antarctica
al., 2018). The thinning signals are modest (∼ 50 cm yr−1 ) in (Miles et al., 2017). Whilst we observe calving events with
comparison to observations in the Amundsen Sea sector, but sea ice present, leading to the build-up of ice mélange at the
we note that these observations were made, in some cases, ice front, the continuous presence of landfsat sea ice and
decades after the loss of the Cook West Ice Shelf. Thinning mélange appears to be important in enabling ice front ad-
rates could have been higher in the immediate years follow- vance (Fig. 8). Between 2009 and 2013 the Cook West ice
ing ice shelf retreat, as observed in the Crane Glacier, which front maintained approximately the same position (Fig. 8a),
formerly flowed into the Larsen B Ice Shelf (e.g. Rott et suggesting that repeated calving events prevented ice front
al., 2018). However, from 2010 onwards, inland thinning up- advance. Using the MODIS Worldview viewer, we observe
stream of Cook West appears to have slowed down or ceased multiple sea ice break-out events during this time period.
(McMillan et al., 2014), suggesting that the system might be In contrast, between 2014 and 2016 the ice front advanced
approaching equilibrium following the loss of the Cook West ∼ 3 km, during which we observe no break-out events and
Ice Shelf. see that landfast sea ice and mélange were continuously
www.the-cryosphere.net/12/3123/2018/ The Cryosphere, 12, 3123–3136, 20183130 B. W. J. Miles et al.: Velocity increases at Cook Glacier
Ice front Image date: Jan 2011 Ice front Image date: Jan 2016 km
2009 2014 0 2 4
2010 2015
2011 2016
2012
2013
Ice-front
2009
2010
2011
2012
2013
Multiple sea ice break-out No sea ice break-out
events 2009–2013 events 2014–2016
(a) (b)
Figure 8. Relationship between ice front position of Cook West and the presence of landfast sea ice and mélange at its ice front. (a) Mapped
ice front position overlain on a Landsat-7 image between 2009 and 2013, during which multiple sea ice break-out events were observed and
there is little change in ice front position. (b) Mapped ice front position overlain on a Landsat-8 image between 2014 and 2016, during which
no sea ice break-out events were observed and the ice front was able to advance. Note the build-up of ice mélange near the ice front.
present at the ice front (Fig. 8b). This suggests that the back more frequent disintegration-type calving events (e.g. Liu et
pressure applied by the landfast sea ice and mélange was al., 2015). The contrasting calving style is unlikely to have
enough to limit calving and enable ice front advance. This been driven by environmental forcing, as inferred by Liu et
behaviour is similar to seasonal ice front fluctuations of some al. (2015) for some other Antarctic ice shelves, because the
outlet glaciers in Greenland, where the seasonal formation of proximity of both ice shelves means they are likely to receive
mélange inhibits calving, resulting in ice front advance (e.g. similar forcing. Instead, it is more likely that the underlying
Amundsen et al., 2010; Todd and Christoffersen, 2014). The bed topography where the ice shelves approach floatation is
annual resolution of our data makes it difficult to determine more important (e.g. Bassis and Ma, 2015). However, even
if these fluctuations in ice front position have a direct effect taking into consideration the structurally weak nature of the
on the velocity of Cook West because calving events occur Cook West Ice Shelf, there still must have been significant
on a subannual scale. Future investigation into this process ocean climate forcing in order to force the complete loss of
is important because the interaction between ice front posi- its floating ice shelf.
tion, landfast sea ice, mélange, and ice dynamics following The widespread retreat of outlet glaciers in the Antarctic
the loss of ice shelves is poorly understood in Antarctica and Peninsula (Cook et al., 2016) and the collapse of the Larsen B
might be an important process missing in current numerical Ice Shelf (e.g. Scambos et al., 2003) have been linked to an
models (e.g. Massom et al., 2018) simulating future sea level increase in surface air temperatures and warm ocean forcing,
contributions from the ice sheet (e.g. Golledge et al., 2015; while the rapid thinning of ice shelves in the Amundsen Sea
DeConto and Pollard, 2016). The recent behaviour of Cook sector and at Totten Glacier have been linked to intrusions
West could be one of the clearest modern-day observations of modified Circumpolar Deep Water (mCDW) (e.g. Jenkins
for this process. et al., 2010; Rintoul et al., 2016). Satellite and modelled es-
timates of the present-day basal melt rate of the remaining
4.3 What caused the calving behaviour of the Cook ice Cook East Ice Shelf are low, suggesting that, on average, it
shelves? receives a relatively weak ocean heat source (Depoorter et
al., 2013; Rignot et al., 2013; Kusahara et al., 2017). Given
the proximity of Cook East to Cook West, it is also likely
Despite their close proximity, the behaviour of the Cook East
that Cook West also receives a relatively weak oceanic heat
and Cook West ice shelves differs over the observational pe-
source. We also do not observe any surface melt features in
riod. This can potentially be explained by the contrasting
the form of supraglacial lakes or channels during our ob-
structures of the ice shelves. Inspection of the Cook East Ice
servations, and regional ice core records show no long-term
Shelf (Fig. 2) shows little evidence of crevassing or fractur-
trend in accumulation (Goursaud et al., 2017). Thus, these
ing throughout the observational period, whereas the Cook
are not the ocean climate conditions which would typically
West Ice Shelf (Fig. 5b, c, d) was heavily crevassed and com-
be associated with the retreat, thinning, or catastrophic loss
paratively structurally weaker. This resulted in a different
of ice shelves. Therefore, it is likely that the rapid and near-
type of calving behaviour, whereby Cook East underwent in-
complete loss of the Cook West Ice Shelf was driven by
frequent tabular calving events, whilst Cook West underwent
The Cryosphere, 12, 3123–3136, 2018 www.the-cryosphere.net/12/3123/2018/B. W. J. Miles et al.: Velocity increases at Cook Glacier 3131
dominant outlet glacier retreat across the wider region in the
km Ninnis
0 25 50 75 100 1970s and 1980s to cooler conditions and glacier advance
Mertz from 1990 to 2010 (Miles et al., 2013). A similar change in
Cook West
wind pattern may also be reflected in temperature reconstruc-
-8
69° S
-60
-1200
00
-200
-60
tions from 1870 to 2010 in the New Zealand subantarctic
-12
0
-1000
0
00
Cook East -600
-400 -800 -600
islands, which lie directly between the Cook–Ninnis–Mertz
00
-4 -4 region and New Zealand, where there is an abrupt switch to-
00
-600 Mertz -200
Depression Mertz -200
wards a more variable climate from the 1940s onwards (Tur-
-600
Bank ney et al., 2017). Evidence of such variability is also recorded
68° S
-40
-2 -600
00
0
in wind direction at the nearest research station, Dumont
-1200
-400
-6
Ninnis
00
Cook Bank d’Urville, where there was an abrupt shift in the 1990s to-
-6
0
Depression 00 wards more easterly winds (Fig. 10). Taken together, analysis
-80
00
-10
of these studies hints at warmer regional climate during pe-
Grounding Line
Grounding line
0
67° S
-40
-40
0 -120
-1600 0 00 depth (m) riods of the mid-20th century and a cooler climate from the
-14
0 -2000 1990s onwards. This is consistent with our interpretation that
-1800
156° E 154° E 152° E 150° E 148° E warmer-than-present ocean climate forcing is likely to have
driven the rapid retreat of the Cook West Ice Shelf.
Figure 9. General Bathymetric Chart of the Oceans (GEBCO) At present there have been no subsurface ocean measure-
bathymetry of the Cook–Ninnis–Mertz region overlain on the Land- ments in the immediate vicinity of Cook West Glacier. How-
sat Image Mosaic of Antarctica (LIMA). Note location of the Cook ever, the local oceanography west of Cook near the Mertz
Depression on the continental shelf. and Ninnis glaciers is one of the most extensively studied
in Antarctica (Beaman et al., 2011; Kusahara et al., 2011;
Williams et al., 2011; Tamura et al., 2012; Campagne et
ocean climate conditions that were likely quite different from al., 2015; Aoki et al., 2017). Numerical modelling has sug-
the present day. gested that a key component of the local oceanography in
Multiple studies point towards a shift in climate towards the Mertz–Ninnis region is the westward advection of warm
greater decadal extremes since the mid-20th century in the mCDW from a depression on the continental shelf in front of
wider Cook–Ninnis–Mertz region (Fig. 9). Reconstructions Cook Glacier (Kusahara et al., 2017) (Fig. 9). The amount of
of sea surface conditions over the past 250 year show that warm mCDW advected onto the continental shelf from the
since 1960 there has been an increase in glacial meltwater as bathymetric depression is sensitive to both interannual vari-
more intense winds enhance mCDW intrusions onto the con- ability in atmospheric forcing and large changes in the re-
tinental shelf (Campagne et al., 2015). This deviates from the gional “icescape” (e.g. calving of the Mertz Glacier Tongue)
cyclic behaviour of sea surface conditions driven by the peri- (Cougnon et al., 2017; Kusahara et al., 2017). Therefore, the
odic formation of the Mertz polynya in association with the more variable climate in the mid-20th century may have re-
∼ 70-year calving cycle of the Mertz Glacier Tongue (Cam- sulted in greater mCDW intrusions. There have been no ob-
pagne et al., 2015; Giles, 2017). Reconstructions of ice dis- servations of the bathymetry in front of Cook Glacier, so it
charge of the region from marine sediment cores west of is not known if there are any connecting troughs to this de-
Mertz show an increase in ice discharge since ∼ 1980, the pression which could facilitate the delivery of warm mCDW
magnitude of which might be unprecedented throughout the intrusions towards the Cook outlet grounding line. However,
Holocene (Crespin et al., 2014). This was linked to an out-of- given the proximity of a potential ocean heat source to the
phase calving event of Ninnis Glacier (Crespin et al., 2014), Cook West Glacier and the absence of any other obvious
but we suggest the increase in discharge of Cook West fol- drivers, we suggest that periodic mCDW intrusions forced by
lowing the loss of its ice shelf may have also contributed to a more variable climate could have been important in driving
this recorded increase in ice discharge. the rapid retreat of the Cook West Ice Shelf. It is possible
In addition, a climate coupling exists between the Cook– that any climatically forced initial retreat of the Cook West
Ninnis–Mertz region and New Zealand’s glaciers, whereby Ice Shelf could have been enhanced if contact with a bathy-
large-scale atmospheric waves connect the two regions metric pinning point was lost, but we do not see any evidence
(Crespin et al., 2014; Mackintosh et al., 2017). The onset of of icebergs grounding on any former pinning point since its
the rapid retreat of mountain glaciers in New Zealand oc- retreat. However, we do note that the loss of the Cook West
curred around the 1940s; this retreat continued at varying Ice Shelf must have occurred shortly after the calving of the
rates until the 1990s, when glaciers advanced in response to neighbouring Cook East Ice Shelf between 1963 and 1973.
regional cooling (Mackintosh et al., 2017). A similar trend Therefore, any loss of contact with the neighbouring Cook
is seen in the Cook–Ninnis–Mertz region; along with Cook East Ice Shelf may have had a destabilizing effect on Cook
West (Fig. 5), Ninnis Glacier underwent a major retreat in the West, increasing its vulnerability to retreat (e.g. Albrecht and
1940s (Frezzotti et al., 1998), and there was a switch from Levermann, 2014).
www.the-cryosphere.net/12/3123/2018/ The Cryosphere, 12, 3123–3136, 20183132 B. W. J. Miles et al.: Velocity increases at Cook Glacier
160
150
Wind direction (°)
140
130
120
0 0
18 27
110 90 0
o k
Co
Dumont d’Urville
100
1957
1959
1961
1963
1965
1967
1969
1971
1973
1975
1977
1979
1981
1983
1985
1987
1989
1991
1993
1995
1997
1999
2001
2003
2005
2007
2009
2011
2013
Figure 10. Mean annual wind direction from Dumont d’Urville research station during 1957–2014.
The tabular calving regime of the Cook East Ice Shelf 5 Conclusion
means its observed behaviour is more challenging to inter-
pret than the neighbouring Cook West. Cyclic tabular calving
events are typically considered to be part of a natural cycle We have shown that, despite little change over the most re-
of advance and retreat linked to the internal stress regimes cent decade, there have been dynamic changes in the veloc-
of ice shelves, e.g. from the Ross Ice Shelf (Joughin and ity of both the Cook East and West glaciers during periods
MacAyeal, 2005) and Amery Ice Shelf (Fricker et al., 2002), over the past ∼ 45 years. For Cook East we provide one of
and/or bathymetric constraints, e.g. at the Mertz Glacier the few observations linking a short-lived increase in veloc-
Tongue (Giles, 2017). However, the potential impact of ity to a subglacial flood event, in addition to a longer-term
multi-decadal climate variability on the periodicity and mag- velocity increase of approximately 20 % between 1989 and
nitude of major calving events has only rarely been consid- 2001. For Cook West we link a doubling of its velocity to
ered. Whilst it is difficult to interpret any changes in the calv- the near-complete loss of its floating ice shelf between 1973
ing cycle of Cook East Ice Shelf owing to the lack of calving and 1989, which may have been forced by a more variable
observations, there are notable differences between its cur- climate in the mid-20th century. Since the loss of the Cook
rent cycle and its previous calving cycle. Its present-day ice West Ice Shelf, there have been no signs of a comparable re-
front position is around 6 km further advanced than its es- advance, but small cycles in ice front position appear to be
timated maximum in the previous calving cycle. Given that linked to sea ice conditions.
there are no obvious rifts and that these can take years to fully The changes we observe highlight the importance of ex-
develop, it is likely that its next calving event will be from a tending observational records of glacier change in Antarc-
significantly more advanced position than the last event be- tica, which are typically confined to satellite altimetry and
tween 1963 and 1973. Furthermore, the unusually deep re- velocity measurements from the mid-1990s onwards. It is
treat of the Cook East ice front into the dynamic section of possible that in regions where there is multi-decadal climate
the ice shelf in the 1970s (Fig. 2) possibly indicates that it variability this may not be a long enough time period to as-
calved earlier and deeper than it perhaps would have under a sess the sensitivity of outlet glaciers to changes in climate. In
natural cycle of advance and retreat. Therefore, the behaviour the case of Cook West, the changes in velocity we observe in
of the Cook East Ice Shelf may also be consistent with a response to the loss of its floating ice shelf are some of the
more variable climate in the mid-20th century (e.g. Crespin et largest recorded in the satellite era in Antarctica. However,
al., 2014; Campagne et al., 2015; Turney et al., 2017) driving in terms of observations of subsurface ocean temperatures,
its deep retreat into its embayment, whilst the cooler con- bathymetry, and bed topography, it is one of the least studied.
ditions of the more recent decades are associated with the This needs to be addressed in order to fully understand the
advance and stability of the ice shelf. Future investigation is processes driving changes in the recent past and improve our
needed into the potential influence of climate variability on understanding of how it will respond to future changes in cli-
the long-term calving cycles of medium to large ice shelves mate. This is important because Cook Glacier drains a large
in Antarctica. proportion of the Wilkes Subglacial Basin and may have the
potential to make future rapid sea level contributions.
The Cryosphere, 12, 3123–3136, 2018 www.the-cryosphere.net/12/3123/2018/B. W. J. Miles et al.: Velocity increases at Cook Glacier 3133
Data availability. Landsat and ARGON imagery along with Bassis, J. N. and Ma, Y.: Evolution of basal crevasses links ice shelf
the aerial photography used in this study is freely avail- stability to ocean forcing, Earth Planet. Sc. Lett., 409, 203–211,
able from Earth Explorer. Cosi-Corr is an ENVI plug-in 2015.
and can be freely downloaded via its we bpage. GEBCO Beaman, R. J., O’Brien, P. E., Post, A. L., and De Santis, L.: A
bathymetric data are available to download from https://www. new high-resolution bathymetry model for the Terre Adelie and
gebco.net/ (https://doi.org/10.1002/2015EA000107, https://doi.org/ George V continental margin, East Antarctica, Antarct. Sci., 23,
10.1175/1520-0442(2004)0172.0.CO;2). Meteo- 95–103, 2011.
rological data from Dumont d’Urville are available from the SCAR Benn, D. I., Warren, C. R., and Mottram, R. H.: Calving processes
MET READER. Ice front position shapefiles and velocity grids are and the dynamics of calving glaciers, Earth-Sci. Rev., 82, 143–
available from the corresponding author. 179, 2007.
Bertram, R. A., Wilson, D. J., van de Flierdt, T., McKay, R. M.,
Patterson, M. O., Jimenez-Espejo, F. J., Escutia, C., Duke, G.
The Supplement related to this article is available online C., Taylor-Silva, B. I., and Riesselman, C. R.: Pliocene deglacial
at https://doi.org/10.5194/tc-12-3123-2018-supplement. event timelines and the biogeochemical response offshore Wilkes
Subglacial Basin, East Antarctica, Earth Planet. Sc. Lett., 494,
109–116, 2018.
Campagne, P., Crosta, X., Houssais, M. N., Swingedouw, D.,
Author contributions. BM conceived the study, designed and exe- Schmidt, S., Martin, A., Devred, E., Capo, S., Marieu, V., Clos-
cuted the method presented in the research, conducted the analysis, set, I., and Masse, G.: Glacial ice and atmospheric forcing on the
and drafted the original manuscript. All authors discussed the re- Mertz Glacier Polynya over the past 250 years, Nat. Commun.,
sults and contributed towards editing the manuscript. 6, 6642, https://doi.org/10.1038/ncomms7642, 2015.
Cook, A. J., Holland, P. R., Meredith, M. P., Murray, T., Luckman,
A., and Vaughan, D. G.: Ocean forcing of glacier retreat in the
western Antarctic Peninsula, Science, 353, 283–286, 2016.
Competing interests. The authors declare that they have no conflict
Cook, C. P., van de Flierdt, T., Williams, T., Hemming, S. R., Iwai,
of interest.
M., Kobayashi, M., Jimenez-Espejo, F. J., Escutia, C., Gonzalez,
J. J., Khim, B. K., McKay, R. M., Passchier, S., Bohaty, S. M.,
Riesselman, C. R., Tauxe, L., Sugisaki, S., Galindo, A. L., Pat-
Acknowledgements. This work was partly funded by the Natural terson, M. O., Sangiorgi, F., Pierce, E. L., Brinkhuis, H., and Sci-
Environment Research Council (grant number: NE/R000824/1) entists, I. E.: Dynamic behaviour of the East Antarctic ice sheet
and partly by a Durham University Doctoral Scholarship. Landsat during Pliocene warmth, Nat. Geosci., 6, 765–769, 2013.
imagery was provided free of charge by the US Geological Survey Cougnon, E. A., Galton-Fenzi, B. K., Rintoul, S. R., Legrésy, B.,
Earth Resources Observation and Science Center. We thank the Williams, G. D., Fraser, A. D., and Hunter, J. R.: Regional
DigitalGlobe Foundation for the provision of WorldView imagery Changes in Icescape Impact Shelf Circulation and Basal Melt-
free of charge. We thank Ed L. Pope for proving subglacial lake ing, Geophys. Res. Lett., 44, 11519–511527, 2017.
drainage basins and Thomas Flament for providing subglacial flow Crespin, J., Yam, R., Crosta, X., Masse, G., Schmidt, S., Campagne,
path data. We thank Poul Chirstoffersen and Jeremy M. Lloyd for P., and Shemesh, A.: Holocene glacial discharge fluctuations and
valuable discussions. We would like to thank Ted Scambos and recent instability in East Antarctica, Earth Planet. Sc. Lett, 394,
an anonymous reviewer for reviewing the manuscript, along with 38–47, 2014.
the editor, Etienne Berthier, for providing constructive comments Davis, C. H., Li, Y. H., McConnell, J. R., Frey, M. M., and Hanna,
which led to the improvement of this paper. E.: Snowfall-driven growth in East Antarctic ice sheet mitigates
recent sea-level rise, Science, 308, 1898–1901, 2005.
Edited by: Etienne Berthier DeConto, R. M. and Pollard, D.: Contribution of Antarctica to past
Reviewed by: Ted Scambos and one anonymous referee and future sea-level rise, Nature, 531, 591–597, 2016.
Depoorter, M. A., Bamber, J. L., Griggs, J. A., Lenaerts, J. T. M.,
Ligtenberg, S. R. M., van den Broeke, M. R., and Moholdt, G.:
References Calving fluxes and basal melt rates of Antarctic ice shelves, Na-
ture, 502, 89–92, 2013.
Albrecht, T. and Levermann, A.: Spontaneous ice-front retreat Flament, T. and Remy, F.: Dynamic thinning of Antarctic glaciers
caused by disintegration of adjacent ice shelf in Antarctica, Earth from along-track repeat radar altimetry, J. Glaciol., 58, 830–840,
Planet. Sc. Lett., 393, 26–30, 2014. 2012.
Amundson, J. M., Fahnestock, M., Truffer, M., Brown, J., Luthi, Flament, T., Berthier, E., and Rémy, F.: Cascading water underneath
M. P., and Motyka, R. J.: Ice mélange dynamics and implications Wilkes Land, East Antarctic ice sheet, observed using altime-
for terminus stability, Jakobshavn Isbrae Greenland, J. Geophys. try and digital elevation models, The Cryosphere, 8, 673–687,
Res., 115, F01005, https://doi.org/10.1029/2009JF001405, 2010. https://doi.org/10.5194/tc-8-673-2014, 2014.
Aoki, S., Kobayashi, R., Rintoul, S. R., Tamura, T., and Kusahara, Fretwell, P., Pritchard, H. D., Vaughan, D. G., Bamber, J. L., Bar-
K.: Changes in water properties and flow regime on the conti- rand, N. E., Bell, R., Bianchi, C., Bingham, R. G., Blanken-
nental shelf off the Adelie/George V Land coast, East Antarc- ship, D. D., Casassa, G., Catania, G., Callens, D., Conway, H.,
tica, after glacier tongue calving, J. Geophys. Res.-Oceans, 122, Cook, A. J., Corr, H. F. J., Damaske, D., Damm, V., Ferracci-
6277–6294, 2017.
www.the-cryosphere.net/12/3123/2018/ The Cryosphere, 12, 3123–3136, 20183134 B. W. J. Miles et al.: Velocity increases at Cook Glacier oli, F., Forsberg, R., Fujita, S., Gim, Y., Gogineni, P., Griggs, Nat. Commun., 2, 159, https://doi.org/10.1038/ncomms1156, J. A., Hindmarsh, R. C. A., Holmlund, P., Holt, J. W., Jacobel, 2011. R. W., Jenkins, A., Jokat, W., Jordan, T., King, E. C., Kohler, Kusahara, K., Hasumi, H., Fraser, A. D., Aoki, S., Shimada, K., J., Krabill, W., Riger-Kusk, M., Langley, K. A., Leitchenkov, Williams, G. D., Massom, R., and Tamura, T.: Modeling Ocean– G., Leuschen, C., Luyendyk, B. P., Matsuoka, K., Mouginot, Cryosphere Interactions off Adélie and George V Land, East J., Nitsche, F. O., Nogi, Y., Nost, O. A., Popov, S. V., Rignot, Antarctica, J. Climate, 30, 163–188, 2017. E., Rippin, D. M., Rivera, A., Roberts, J., Ross, N., Siegert, Leprince, S., Ayoub, F., Klinger, Y., and Avouac, J. P.: Co- M. J., Smith, A. M., Steinhage, D., Studinger, M., Sun, B., Registration of Optically Sensed Images and Correlation (COSI- Tinto, B. K., Welch, B. C., Wilson, D., Young, D. A., Xiangbin, Corr): an operational methodology for ground deformation mea- C., and Zirizzotti, A.: Bedmap2: improved ice bed, surface and surements, in: 2007 Ieee International Geoscience and Remote thickness datasets for Antarctica, The Cryosphere, 7, 375–393, Sensing Symposium, Barcelona, Spain, 23–28 July 2007, IEEE, https://doi.org/10.5194/tc-7-375-2013, 2013. 1943–1946, https://doi.org/10.1109/Igarss.2007.4423207, 2007. Frezzotti, M., Cimbelli, A., and Ferrigno, J. G.: Ice-front change and Liu, Y., Moore, J. C., Cheng, X., Gladstone, R. M., Bassis, J. N., iceberg behaviour along Oates and George V Coasts, Antarctica, Liu, H., Wen, J., and Hui, F.: Ocean-driven thinning enhances 1912–96, Ann. Glaciol., 27, 643–650, 1998. iceberg calving and retreat of Antarctic ice shelves, P. Natl. Acad. Fricker, H. A., Young, N. W., Allison, I., and Coleman, R.: Iceberg Sci. USA, 112, 3263–3268, 2015. calving from the Amery Ice Shelf, East Antarctica, Ann. Glaciol., Lovell, A., Stokes, C., and Jamieson, S.: Sub-decadal variations 34, 241–246, 2002. in outlet glacier terminus positions in Victoria Land, Oates Furst, J. J., Durand, G., Gillet-Chaulet, F., Tavard, L., Rankl, M., Land and George V Land, East Antarctica (1972–2013), Antarct. Braun, M., and Gagliardini, O.: The safety band of Antarctic ice Sci., 29, 468–483, https://doi.org/10.1017/S0954102017000074, shelves, Nat. Clim. Change, 6, 479–482, 2016. 2017. Giles, A. B.: The Mertz Glacier Tongue, East Antarctica. Changes Mackintosh, A. N., Anderson, B. M., Lorrey, A. M., Renwick, J. in the past 100 years and its cyclic nature – Past, present and A., Frei, P., and Dean, S. M.: Regional cooling caused recent future, Remote Sens. Environ., 191, 30–37, 2017. New Zealand glacier advances in a period of global warming, Golledge, N. R., Kowalewski, D. E., Naish, T. R., Levy, R. H., Fog- Nat. Commun., 8, 14202, https://doi.org/10.1038/ncomms14202, will, C. J., and Gasson, E. G. W.: The multi-millennial Antarctic 2017. commitment to future sea-level rise, Nature, 526, 421–425, 2015. Massom, R. A., Giles, A. B., Fricker, H. A., Warner, R. C., Goursaud, S., Masson-Delmotte, V., Favier, V., Preunkert, S., Fily, Legresy, B., Hyland, G., Young, N., and Fraser, A. D.: Ex- M., Gallée, H., Jourdain, B., Legrand, M., Magand, O., Minster, amining the interaction between multi-year landfast sea ice B., and Werner, M.: A 60-year ice-core record of regional climate and the Mertz Glacier Tongue, East Antarctica: Another fac- from Adélie Land, coastal Antarctica, The Cryosphere, 11, 343– tor in ice sheet stability?, J. Geophys. Res., 115, C12027, 362, https://doi.org/10.5194/tc-11-343-2017, 2017. https://doi.org/10.1029/2009JC006083, 2010. Heid, T. and Kääb, A.: Evaluation of existing image matching meth- Massom, R. A., Scambos, T. A., Bennetts, L. G., Reid, P., Squire, ods for deriving glacier surface displacements globally from op- V. A., and Stammerjohn, S. E.: Antarctic ice shelf disintegration tical satellite imagery, Remote Sens. Environ., 118, 339–355, triggered by sea ice loss and ocean swell, Nature, 558, 383–389, 2012. 2018. Hughes, T. J.: The Weak Underbelly of the West Antarctic Ice- McMillan, M., Corr, H., Shepherd, A., Ridout, A., Laxon, S., and Sheet, J. Glaciol., 27, 518–525, 1981. Cullen, R.: Three-dimensional mapping by CryoSat-2 of sub- Jansen, D., Luckman, A. J., Cook, A., Bevan, S., Kulessa, B., Hub- glacial lake volume changes, Geophys. Res. Lett., 40, 4321– bard, B., and Holland, P. R.: Brief Communication: Newly devel- 4327, 2013. oping rift in Larsen C Ice Shelf presents significant risk to stabil- McMillan, M., Shepherd, A., Sundal, A., Briggs, K., Muir, A., ity, The Cryosphere, 9, 1223–1227, https://doi.org/10.5194/tc-9- Ridout, A., Hogg, A., and Wingham, D.: Increased ice losses 1223-2015, 2015. from Antarctica detected by CryoSat-2, Geophys. Res. Lett., 41, Jenkins, A., Dutrieux, P., Jacobs, S. S., McPhail, S. D., Perrett, J. 3899–3905, 2014. R., Webb, A. T., and White, D.: Observations beneath Pine Island Mengel, M. and Levermann, A.: Ice plug prevents irreversible dis- Glacier in West Antarctica and implications for its retreat, Nat. charge from East Antarctica, Nat. Clim. Change, 4, 451–455, Geosci., 3, 468–472, 2010. 2014. Joughin, I. and MacAyeal, D. R.: Calving of large tabular icebergs Miles, B. W. J., Stokes, C. R., Vieli, A., and Cox, N. J.: Rapid, from ice shelf rift systems, Geophys. Res. Lett., 32, L02501, climate-driven changes in outlet glaciers on the Pacific coast of https://doi.org/10.1029/2004GL020978, 2005. East Antarctica, Nature, 500, 563–566, 2013. Joughin, I., Smith, B. E., and Medley, B.: Marine Ice Sheet Col- Miles, B. W. J., Stokes, C. R., and Jamieson, S. S. R.: Pan–ice-sheet lapse Potentially Under Way for the Thwaites Glacier Basin, glacier terminus change in East Antarctica reveals sensitivity of West Antarctica, Science, 344, 735–738, 2014. Wilkes Land to sea-ice changes, Science Advances, 2, e1501350, Konrad, H., Shepherd, A., Gilbert, L., Hogg, A. E., McMillan, M., https://doi.org/10.1126/sciadv.1501350, 2016. Muir, A., and Slater, T.: Net retreat of Antarctic glacier ground- Miles, B. W. J., Stokes, C. R., and Jamieson, S. S. R.: Simultaneous ing lines, Nat. Geosci., 11, 258–262, 2018. disintegration of outlet glaciers in Porpoise Bay (Wilkes Land), Kusahara, K., Hasumi, H., and Williams, G. D.: Impact of the Mertz East Antarctica, driven by sea ice break-up, The Cryosphere, 11, Glacier Tongue calving on dense water formation and export, 427–442, https://doi.org/10.5194/tc-11-427-2017, 2017. The Cryosphere, 12, 3123–3136, 2018 www.the-cryosphere.net/12/3123/2018/
You can also read