VFB-Happening
Rik Scheerlinck, KBC Group CFO
←
→
Page content transcription
If your browser does not render page correctly, please read the page content below

VFB-Happening Rik Scheerlinck, KBC Group CFO

Important information for investors
                •    This presentation is provided for information purposes only. It does not constitute an offer to buy or
                     sell any security issued by an entity of the KBC group, nor does it constitute investment advice.

                •    KBC believes that this presentation is reliable, although some information is condensed and
                     therefore incomplete. KBC cannot be held liable for any direct or consequential loss or damage
                     resulting from the use of the information.

                •    This presentation contains non-IFRS information and forward-looking statements with respect to the
                     strategy, earnings and capital trends of KBC. The forward-looking statements are based on a best
                     effort assessment of expected economic growth, were drafted in accordance with applicable
                     legislation and involve numerous assumptions and uncertainties. A change in the expected
                     economic growth or applicable legislation can cause changes in the forward-looking statements.
                     More generally, there is a risk that these statements may not be fulfilled and that future
                     developments could differ materially. KBC does not undertake any obligation to update the
                     presentation in line with new developments.

                •    By reading this presentation, investors are deemed to represent that they possess sufficient
                     expertise to understand the risks involved. Investors are expected to make their own investment
                     decisions without undue reliance on this presentation.

                                                       2
VFB-Happening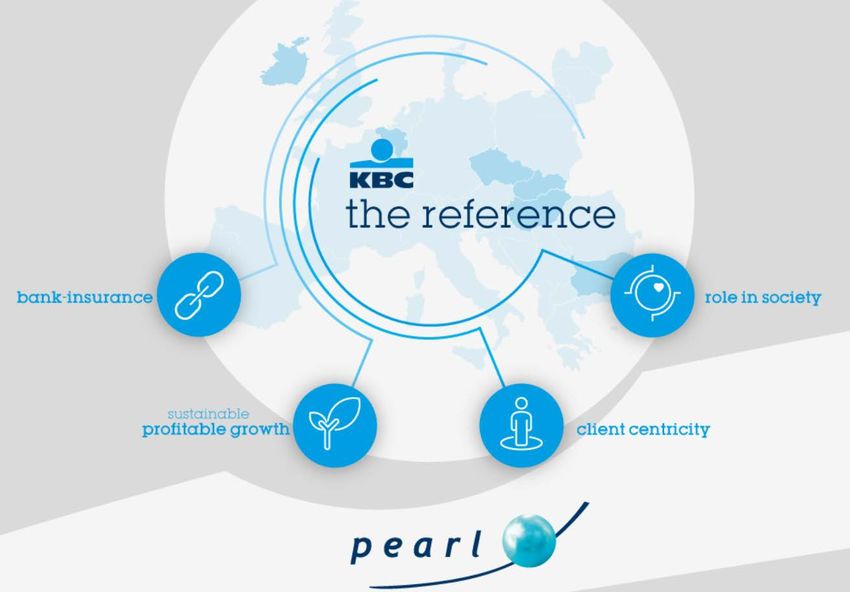
Agenda
KBC Business Profile
KBC Group strategy
Group-wide digital transformation
Our financial plan
The investor’s view
Wrap up
3
VFB-Happening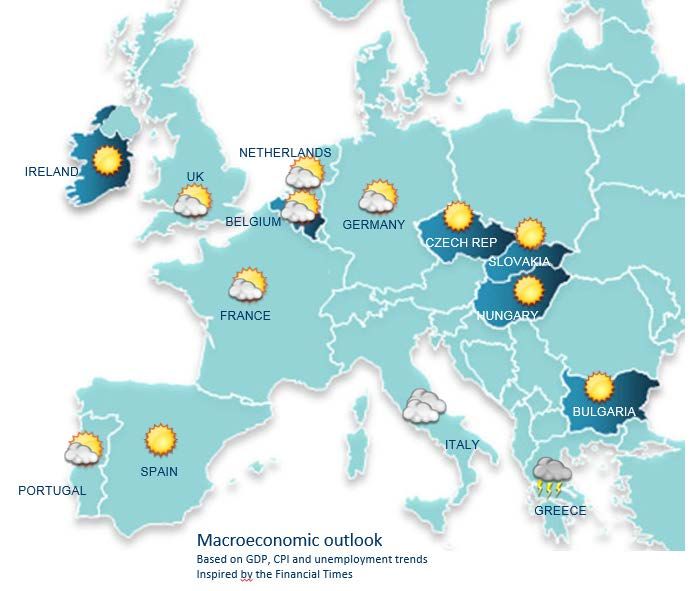
KBC’s Business Profile

                       4
VFB-Happening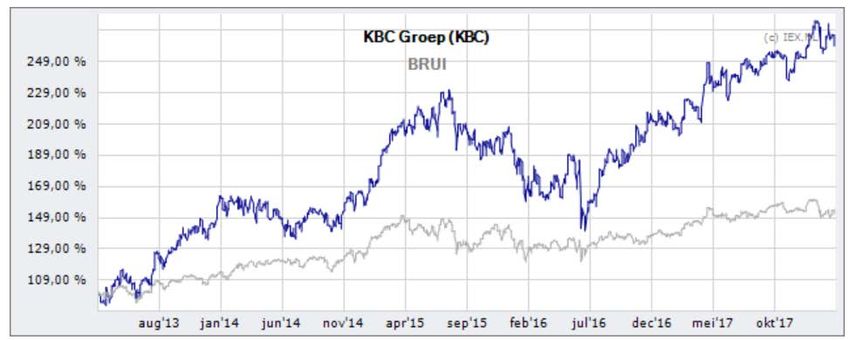
Overview key financial data at FY17
                                                                                                        KBC Group
                      Market cap1                                  Net result                                Total assets                             Total equity     CET1 ratio2

                                31                                   2 575                                         292                                        19          16.3
                              bn EUR                                     m EUR                                     bn EUR                                    bn EUR         %

                                                    KBC Bank                                                                                              KBC Insurance
                 Net result3:                                                             2 180m EUR                           Net result 3:                                438m EUR
                 Total assets:                                                              256bn EUR                          Total assets:                                 38bn EUR
                 Total equity:                                                                16bn EUR                         Total equity:                                    3bn EUR
                 CET1 ratio 4:                                                                      14.5%                      Solvency II ratio:                                212%
                 C/I ratio5 :                                                                          55%                     Combined ratio:                                     88%
                 Credit Cost Ratio:                                                                 -0.06%6
                1.   As at February 2018
                2.   Presented ratio is fully loaded; on a phased-in basis the ratio stands at 16.5% for KBC Group
                3.   Difference between net result at KBC Group and the sum of the banking and insurance contribution is accounted by the holding-company/group item
                4.   Includes KBC Asset Management ; excludes holding company eliminations
                5.   Adjusted for specific items (see glossary for definition)
VFB-Happening   6.   Negative sign means release                                                                                                                                        5
Well defined core markets: access to
                                     ‘new growth’ in Europe
                                KBC Group’s core markets

VFB-Happening   1. Source: KBC data, February 2018
                                                           6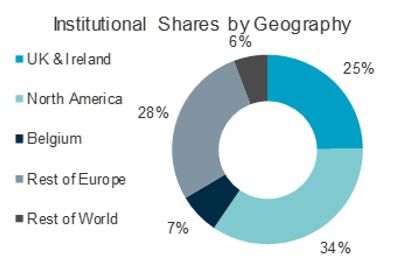
Balance sheet :
                                           Loans and deposits continue to grow in most core countries
                                                                                            Y-O-Y ORGANIC* VOLUME GROWTH FOR MAIN ENTITIES
                                                                                                                                                                                  13%
                                                    CZ                                                                                    CZ
                                                                     BE                                                                               CZ
                                                                                         6%                                                    11%
                                                                                                                                                                      8%
                                                                                                                                                           9%
                                                                                                                                 8%                                                             6%
                                                  3%

                                                                      1%

                                               Loans**            Retail            Deposits***                                 Loans**    Retail   Deposits***     Loans**      Retail     Deposits***
                                                                 mortgages                                                                mortgages                             mortgages
                                                                                                                                               18%

                                                   11%                                                                                                     14%
                                                                                                                                 11%
                                                                     7%                7%

                                                                                                                                                                                               8%
                                                                                                                                                                                   2%

                                                 Loans**          Retail   Deposits***                                          Loans**    Retail     Deposits***    -1%
                                                                 mortgages                                                                mortgages                 Loans**       Retail    Deposits***
                                                                                                                                                                              mortgages****

                *      Volume growth excluding FX effects and divestments/acquisitions
                **     Loans to customers, excluding reverse repos (and bonds)
VFB-Happening   ***
                ****
                       Customer deposits, including debt certificates but excluding repos
                       Retail mortgages in Ireland: new business (written from 1 Jan 2014) +47% y-o-y, while legacy -7% y-o-y
                                                                                                                                                       7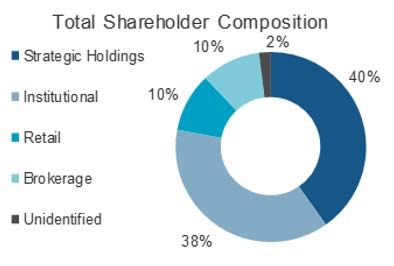
A low risk bank-insurance group
                           BREAKDOWN ACCORDING TO RWA                                        LOAN DISTRIBUTION:
                                   (end 4Q17)                                                 TOTAL RETAIL = 56%
                                                                                                 (end 4Q17)

                                                                            SME/Corporate loans                        Residential mortgages
                                                   Market risk
                                              4%
                                                      Operational risk
                                                12%                                    44%                                 44%
                Credit risk 75%

                                              10%
                                                     Insurance Activities

                                                                                                        12%
                                                                                                  Other Retail loans

VFB-Happening                                           8
Evolution of net result

                                      2.639

                                                                       2 575
                                       765        2 427

                         1.762
                          138

                1.015                  2 218
                  55
                          1 624

                 960

                                       -344
                FY2013   FY2014       FY2015     FY2016               FY2017

                                               Adjustment/Legacy
                                               Impact Financial Holding        =   Net Profit
                                               Goodwill impairments
                                               Underlying/Adjusted Result

VFB-Happening                     9
Sustainable returns, clearly above the sector average

                             Return-on-Equity (ROE) (%)
                                                                      Median Peer
                                           22%                        Group 8,3%
                                                                        (2016)
                                                     18%
                                                              17%
                     15%

                                 13%

                                                                             =   Net Profit
                    FY2013     FY2014     FY2015    FY2016   FY2017

VFB-Happening                                10
More revenue diversification …
Total Income - Costs, impairments and taxes = Net Profit
* The above management view focusses on our ability to do client business and adjusts for distribution commissions and non-life technical charges (which is
a product of the acceptance process) .
VFB-Happening 11Bank-insurance model paying off :
Well diversified income
Loans and advances to customers Deposits from customers
(EUR m)
(EUR m)
+18% +20%
133 231 141 502 193 968
124 551 128 223 170 109 177 730
120 371 161 135 161 783
FY2013 FY2014 FY2015 FY2016 FY2017 FY2013 FY2014 FY2015 FY2016 FY2017
Asset under management (AUM)
(EUR m)
+34%
208 807 213 123 219 169
185 704
162 977
VFB-Happening FY2013 FY2014 FY2015 FY2016 FY2017
12Bank-insurance model paying off :
Well diversified income
NON LIFE SALES
(Gross written premium) LIFE SALES
(EUR m) (EUR m)
+18% -1%
1 430 1 518 2 114
1 282 1 342 1 892 1 793 1 881
FY2014 FY2015 FY2016 FY2017 FY2014 FY2015 FY2016 FY2017
VFB-Happening
13Strong Ratio’s
Median Peer
Median Peer
Group 63% Cost/Income ratio (banking) Non-Life combined ratio
(2016) Group 97%
57%
54% 55% 55% (2016) 94% 93%
91% 88%
2014 2015 2016 2017 2014 2015 2016 2017
Credit cost ratio
0,42%
0,23%
0,09%
VFB-Happening -0,06%
14
2014 2015 2016 2017High Returns across our core markets
NET PROFIT – KBC GROUP
FY17 ROAC: 25%
2,639 2,575
2,427
1,762
2014 2015 2016 2017
NET PROFIT – BELGIUM NET PROFIT – CZECH REPUBLIC NET PROFIT – INTERNATIONAL MARKETS
FY17 ROAC: 26%
FY17 ROAC: 43% FY17 ROAC: 22%
1,516 1,564 1,575 702
1,432 596
529 542 428 444
245
2014 2015 2016 2017 2014 2015 2016 2017
-182
2014 2015 2016 2017
VFB-Happening
Amounts in m EUR
15KBC Group Strategy
16Our business model has proven to be very
successful ….
MORE OF THE SAME,
BUT DIFFERENTLY
17So we are keeping our core strategy
unchanged …
VFB-Happening
18KBC Group and digitalisation:
Enhanced channels for empowered clients
Creating superior client satisfaction via a
seamless, multi-channel client-centric distribution approach
Real time
Enhanced channels for empowered clients
VFB-Happening
19What will we deliver?
Further optimise our integrated distribution
model according to a real-time omni-channel
approach
Prepare our applications to engage with Fintechs
and other value chain players
Invest in our digital presence (e.g., social media) to
enhance client relationships and anticipate their needs
Further increase efficiency and effectiveness of data
management
Set up an open architecture IT package as core banking
system for our International Markets Business Unit
VFB-Happening 20KBC Group and digitalisation today (FY 2017):
Digital sales are increasing : example BU Belgium*
Consumer loans Travel insurance
14 000 800
12 000 700
10 000 600
8 000 500
6 000 400
4 000 300
2 000 200
0 100
0
Oct
Feb
Sep
Jan
Mar
Apr
May
Aug
Nov
Dec
Jun
Jul
Oct
Feb
Sep
Jan
Mar
Apr
May
Aug
Nov
Dec
Jun
Jul
2017 2017
Pension savings Current accounts
5 000 30 000
4 000 25 000
3 000 20 000
15 000
2 000
10 000
1 000 5 000
0 0
Oct
Feb
Sep
Jan
Mar
Apr
May
Aug
Nov
Dec
Jun
Jul
Oct
Feb
Sep
Jan
Mar
Apr
May
Aug
Nov
Dec
Jun
Jul
2017 2017
VFB-Happening
21
* BU Belgium Cumulative sales numbersKBC Group and digitalisation:
Omnichannel is embraced by our customers*
Digital signing after contact with the branches Digital sales @ KBC Live increases,
or KBC Live in 2017 strong performance in non-life
90%
18 000
80%
16 000
70% 14 000
KBC Live cumulative sales 2017
60% 12 000
50% 10 000
40% 8 000
6 000
30%
Mar
May
Jun
Feb
Jul
Sep
Oct
Aug
Nov
Dec
Apr
Jan
4 000
2 000
Digital signing of consumer loans
Digital signing of debt protect cover life insurance
0
Digital signing mortgage loans Jan Feb Mar Apr May Jun Jul Aug Sep Oct Nov Dec
Digital signing housing insurance
Digital signing of commercial credits
Non life insurance Life insurance Housing loans Consumer loans Investment plans
VFB-Happening * BU Belgium numbers
22We aim to be one of the better
capitalised financial institutions
23
VFB-HappeningWe start from a strong capital position…
Fully loaded Basel 3 CET1 ratio at KBC Group (Danish
Compromise)
16.3%
14.9%
15.8% A fully loaded common equity
14.3%
ratio of 16.3% based on the Danish
Compromise at end 1Q17, which
clearly exceeds the minimum
capital requirements of 10.60%*
10.60% pro set by the ECB / NBB
forma regulatory
minimum
* Excludes a pillar 2 guidance (P2G) of 1.0% CET1
FY14 FY15 FY16 FY17
VFB-Happening 24What does it mean for our capital deployment?
Impact of Basel 4 agreement: update ‘Reference Capital Position’
KBC Group wants to keep a flexible buffer of up Flexible buffer for M&A 2.0%
to 2% CET1 for potential add-on M&A in our core
markets
‘Reference
This buffer comes on top of the ‘Own Capital
Target’ of KBC Group, and all together forms the Own Capital Target 14,0%
= 16.0% Capital
‘Reference Capital Position’ Position’
Any M&A opportunity will be assessed subject to
very strict financial and strategic criteria
2016
VFB-Happening 25Capital distribution to
shareholders
The payout ratio policy (i.e. dividend + AT1 coupon) of at least 50% of
consolidated profit is reconfirmed, with an annual interim dividend of 1
EUR per share being paid in November of each accounting year as an
advance on the total dividend
On top of the payout ratio of 50% of consolidated profit, each year, the
Board of Directors will take a decision, at its discretion, on the
distribution of the capital above the ‘Reference Capital Position‘
VFB-Happening 26
26More of the same …
And have updated our guidance
Guidance… by…
CAGR total income (‘16-’20)* ≥ 2.25% 2020
C/I ratio banking excluding bank tax ≤ 47% 2020
C/I ratio banking including bank tax ≤ 54% 2020
Combined ratio ≤ 94% 2020
Dividend payout ratio ≥ 50% As of now
* Excluding marked-to-market valuations of ALM derivatives
VFB-Happening 27And have updated our guidance
… but differently …
Make further progress in our bank-insurance model
Guidance by… Guidance by…
CAGR Bank-Insurance clients CAGR Bank-Insurance stable clients
(1 Bank product + 1 Insurance product) (3 Bk + 3 Ins products in Belgium; 2 Bk + 2 Ins
products in CE)
BU BE >2% 2020 BU BE >2% 2020
BU CR > 15 % 2020 BU CR > 15 % 2020
BU IM > 10 % 2020 BU IM > 15 % 2020
Guidance on inbound omni-channel/digital behaviour*
Guidance by …
% Inbound contacts via omni-channel and
digital channel
KBC Group** > 80 % 2020
• Clients interacting with KBC through at least one of the non-physical channels (digital or through a remote advice centre), possibly in
addition to contact through the physical branch. This means that clients solely interacting with KBC through the physical branch (or ATM)
are excluded
** Bulgaria & PSB out of scope for Group target
VFB-Happening 28Shareholder structure and basis (free float)
Free Float
VFB-Happening
VFB-Happening 29Shareholder basis (free float) and Analysts’ coverage
VFB-Happening
VFB-Happening
30Share price performance and dividend pay-out
KBC
BEL-20
Dividend per share (in EUR)
2012 2013 2014 2015 2016 2017
1,00 0,00 2,00 0,00 2,80 3,00
VFB-Happening
31KBC Group wants to be among the best
performing financial institutions in Europe
• KBC wants to be among Europe’s best performing financial institutions. This will
be achieved by:
o Strengthening our bank-insurance business model for retail, SME and mid-cap
clients in our core markets, in a highly cost-efficient way
o Focusing on sustainable and profitable growth within the framework of solid
risk, capital and liquidity management
o Creating superior client satisfaction via a seamless, omni-channel, client-
centric distribution approach
• By achieving this, KBC wants to become the reference in bank-insurance in its core
markets
VFB-Happening 32You can also read