Victorian waste flows - Final 11 OCTOBER 2019 Blue Environment Pty Ltd - Infrastructure Victoria
←
→
Page content transcription
If your browser does not render page correctly, please read the page content below
Final

Victorian waste flows
11 OCTOBER 2019

PREPARED FOR
Infrastructure Victoria

PREPARED BY
Blue Environment Pty Ltd
IN ASSOCIATION WITH
Brock Baker Environmental Consulting
Sustainable Resource Use Pty Ltd
Report title                     Victorian waste flows
 Client                           Infrastructure Victoria
 Status                           Final
 Author(s)                        R Godfrey, J Trinh, B Grant, C Wardle
 Reviewer(s)                      J Pickin
 Project number                   P1092
 Report date                      11 October 2019
 Contract date                    5 August 2019
 Information current to           11 October 2019
 Copyright                        Infrastructure Victoria 2019

Disclaimer
This report has been prepared for Infrastructure Victoria in accordance with the terms and conditions of appointment
dated 5 August 2019, and is based on the assumptions and exclusions set out in our scope of work. Information in this
document is current as of 11 October 2019. While all professional care has been undertaken in preparing this report, Blue
Environment Pty Ltd cannot accept any responsibility for any use of or reliance on the contents of this report by any third
party.
The mention of any company, product or process in this report does not constitute or imply endorsement by Blue
Environment Pty Ltd.
© Infrastructure Victoria 2019

Blue Environment prints on 100% recycled paper
Blue Environment Pty Ltd
ABN 78 118 663 997
Suite 209, 838 Collins St, Docklands Vic 3008
Email: blue@blueenvironment.com.au
Web: www.blueenvironment.com.au
Phone: +61 3 9081 0440 / +61 3 5426 3536
Contents
Summary ..................................................................................................................................... i
1. Introduction ....................................................................................................................... 4
2. Context............................................................................................................................... 5
     2.1 Management framework ...................................................................................................... 5
     2.2 Data sources.......................................................................................................................... 5
3. Waste pathways ................................................................................................................. 9
     3.1 Generation and management ............................................................................................... 9
     3.2 Sorting ................................................................................................................................. 11
     3.3 Recovery.............................................................................................................................. 12
     3.4 Disposal ............................................................................................................................... 15
     3.5 Other ................................................................................................................................... 18
     3.6 Summary ............................................................................................................................. 18
4. Material flows ...................................................................................................................22
     4.1 Organics .............................................................................................................................. 22
     4.2 Packaging glass.................................................................................................................... 28
     4.3 Paper and cardboard .......................................................................................................... 30
     4.4 Plastics................................................................................................................................. 31
     4.5 Metals ................................................................................................................................. 36
     4.6 Masonry .............................................................................................................................. 38
     4.7 E-waste ................................................................................................................................ 40
     4.8 Tyres .................................................................................................................................... 41
     4.9 Textiles ................................................................................................................................ 43
5. Issues and opportunities ....................................................................................................44
     5.1 Material projections............................................................................................................ 44
     5.2 Commodity prices ............................................................................................................... 45
     5.3 Issues and challenges .......................................................................................................... 49
     5.4 Industry examples ............................................................................................................... 51
     5.5 Infrastructure opportunities ............................................................................................... 52
References .................................................................................................................................54

Appendices
Appendix A           Data sources .................................................................................................................. 56
Appendix B           Waste data by material and region ............................................................................... 59

Figures
Figure 1         A circular economy for Victoria ........................................................................................... 4
Figure 2         Flow of waste and recovered resources.............................................................................. 6
Figure 3         Waste flows in Victoria by material................................................................................... 20
Figure 4         Fates of end-of-life tyres Victoria 2015-16........................................................................ 42
Figure 5         Metal prices for Australian waste exports 2017-19 .......................................................... 47
Figure 6         Plastic commodity prices for Australian waste exports 2017-19 ...................................... 48
Figure 7         Paper commodity prices for Australian waste exports 2017-19 ....................................... 48

Tables
Table 1          List of datasets used ............................................................................................................ 7
Table 2          Tonnes and proportion of waste recovered in Victoria by material 2017-18 ................... 12
Table 3          Estimated tonnes of waste recovered in each region by material 2017-18 ..................... 13

Victorian waste flows                                                                                                                            Final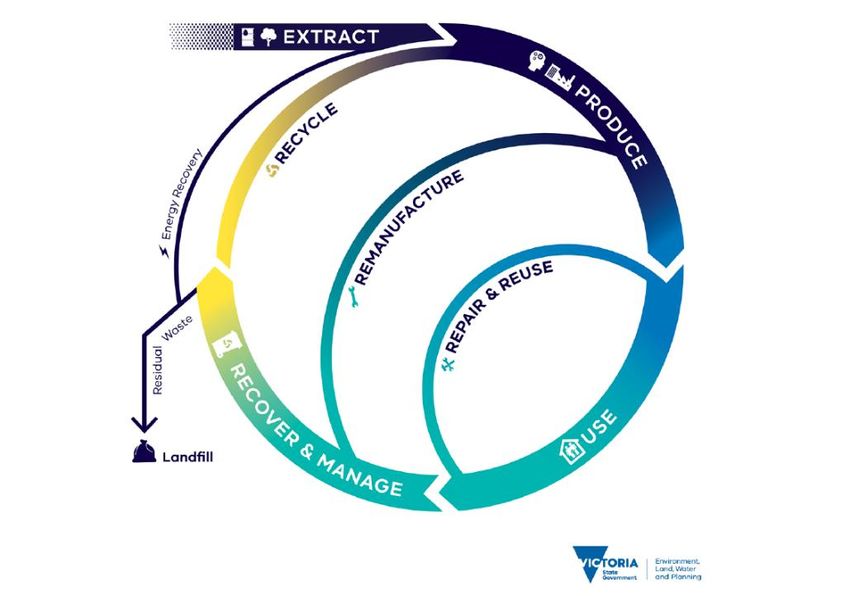
Table 4       Reprocessors by region 2018 ............................................................................................ 14
Table 5       Tonnes of waste landfilled in each region 2017-18 .......................................................... 15
Table 6       Estimated tonnes of waste landfilled by region and material 2017-18 ............................ 16
Table 7       Estimated tonnes of material landfilled, recovered and managed in Victoria, 2017-
              18 ....................................................................................................................................... 19
Table 8       Total waste managed by region and material in tonnes 2017-18..................................... 21
Table 9       Estimated tonnes of organics managed in Victoria 2017-18 ............................................ 23
Table 10      Estimated tonnes of food organics generated and recovered in Victoria 2017-18 .......... 23
Table 11      Estimated recovery of food and garden organics by region 2017-18 ............................... 24
Table 12      Processing of organics by region 2017-18 ......................................................................... 25
Table 13      Indicative prices for compost products ............................................................................. 27
Table 14      Estimated plastics recovered 2017-18 .............................................................................. 32
Table 15      Victorian metal exports 2017-18 ....................................................................................... 36
Table 16      Projected generation of materials to 2037-38 (tonnes/year) ........................................... 44
Table 17      Indicative commodity prices (as at August 2019) ............................................................. 46

ACKNOWLEDGEMENTS
Blue Environment is grateful to the many organisations who shared data in the development of this
report including:
     Australian Packaging Covenant Organisation
     Barwon South West Waste and Resource Recovery Group
     Department of the Environment and Energy
     Department of the Environment, Land, Water and Planning
     Envisage Works
     Gippsland Waste and Resource Recovery Group
     Goulburn Valley Waste and Resource Recovery Group
     Grampians Central West Waste and Resource Recovery Group
     Loddon Mallee Waste and Resource Recovery Group
     Metropolitan Waste and Resource Recovery Group
     North East Waste and Resource Recovery Group
     Sustainability Victoria

Victorian waste flows                                                                                                                               Final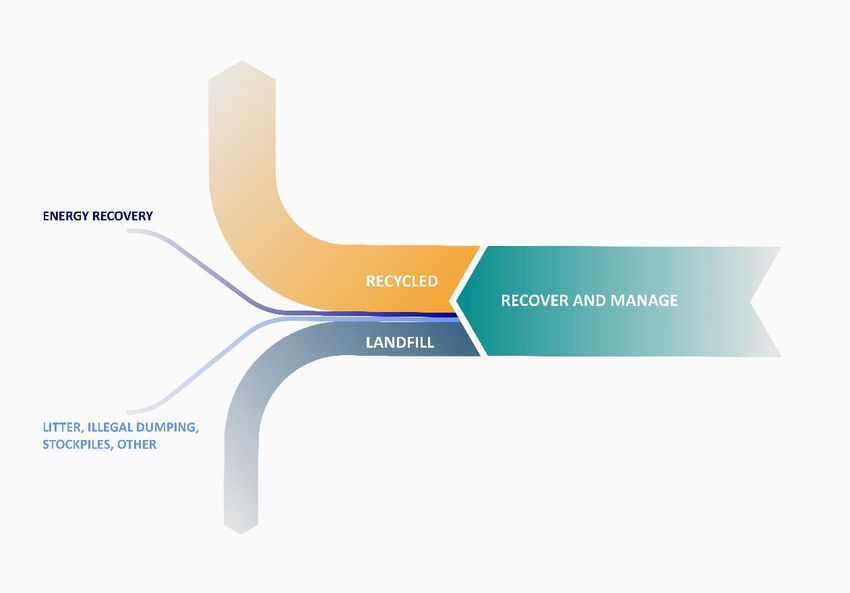
Abbreviations and glossary
 ABS                 acrylonitrile butiadiene styrene
 AD                  anaerobic digestion
 APCO                Australian Packaging Covenant Organisation
 ASA                 acrylonitrile styrene acrylate
 BFR                 brominated flame retardant
 C&D                 construction and demolition
 C&I                 commercial and industrial
 CDS                 container deposit scheme
 COAG                Council of Australian Governments
 DoEE                Department of the Environment and Energy
 DELWP               Department of Environment, Land, Water and Planning
 EPA                 Environment Protection Authority
 EPS                 expanded polystyrene
 FOGO                food organics and garden organics
 HDPE                high density polyethylene
 LDPE                low density polyethylene
 MRF                 materials recovery facility
 MSW                 municipal solid waste
 PET                 polyethylene terephthalate
 PP                  polypropylene
 PS                  polystyrene
 PU                  polyurethane
 PVC                 polyvinyl chloride
 RSC                 Royal Society of Chemistry
 SAN                 styrene acrylonitrile
 SME                 small to medium enterprise
 SV                  Sustainability Victoria
 t                   tonnes
 WMRR                Waste Management and Resource Recovery Association of Australia
 WRRG                Waste and Resource Recovery Group

Victorian waste flows                                                                  Final

Summary
       The Victorian waste and resource recovery industry is currently experiencing a period of volatility
       due to a range of market issues and export bans. Changes to recycling infrastructure could offer the
       potential for improved industry resilience and realise local economic opportunities, including
       transition to a circular economy. This report analyses waste and material flows in Victoria in order to
       identify infrastructure opportunities that will increase resource recovery rates and improve material
       outcomes.

       Data analysis shows that for the baseline year of 2017-18 (the most recent data available) around
       13.4 million tonnes of waste was managed in Victoria. About 8.7 million tonnes were recovered, 4.4
       million tonnes were landfilled and about 200,000 tonnes entered the environment as litter, illegal
       dumping or abandoned waste. The total amount of waste managed by region and material type is
       estimated in the table below, indicating most materials are managed in the Melbourne metropolitan
       region.

       Table S1 Total waste managed by region and material in tonnes 2017-18
                  Barwon       Gippsland   Goulburn   Grampians       Loddon        Metro-       North        Victoria
                    South                    Valley      Central       Mallee       politan       East
                     West                                  West
Organics*         138,000         74,800      77,700    193,500         90,900      1,879,600     34,800     2,489,100
Paper and         107,600        166,500      60,200     80,100         78,700      1,474,000     30,800     1,997,800
cardboard
Packaging            3,400         2,400        2,700         9,500       3,000       322,500        500       344,100
glass
Plastics            29,100        32,900      19,400         61,300     22,300        415,500      5,900       586,300
E-waste                800           600           700        1,900         900        78,400        100        83,500
Tyres                  500           300           300        2,000         300        66,100        100        69,500
Metals               5,300         3,500        3,700        19,900       3,800     1,553,500        700     1,590,400
Textiles             7,700         5,100        5,500        27,000       5,700       138,500      1,000       190,400
Masonry           260,700         55,100    136,800         199,000    179,100      4,316,500     75,600     5,222,900
Waste               13,200         9,700      12,800         12,300     15,800        194,800      2,500       261,100
processing
residuals
from MRF
Other waste       193,000         12,700      14,600         30,700     17,500        258,600      3,400       530,700
All               759,300        363,600    334,400         637,200    418,000 10,698,000 155,400 13,366,000
         Tonnes of organics managed does not include 477,900 tonnes of biosolids.
         Table does not include 578,200 tonnes of waste used for energy recovery.
         Other waste includes illegal dumping, litter and abandoned waste (e.g. 175,000 tonnes of C&D near Lara)

       The overall recovery rate for Victoria was about 65%, with processing and markets different for each
       material type. While the success of reuse or recycling initiatives differ for each material type, there
       are some common limiting factors:
       •    Material is often contaminated, requiring additional sorting and processing to make the
            material ready for reuse and remanufacturing. Current recovery facilities may not be equipped
            to adequately sort and treat the material to meet relevant contamination thresholds or market
            standards.

       Victorian waste flows                                                                                     Final
                                                           Page i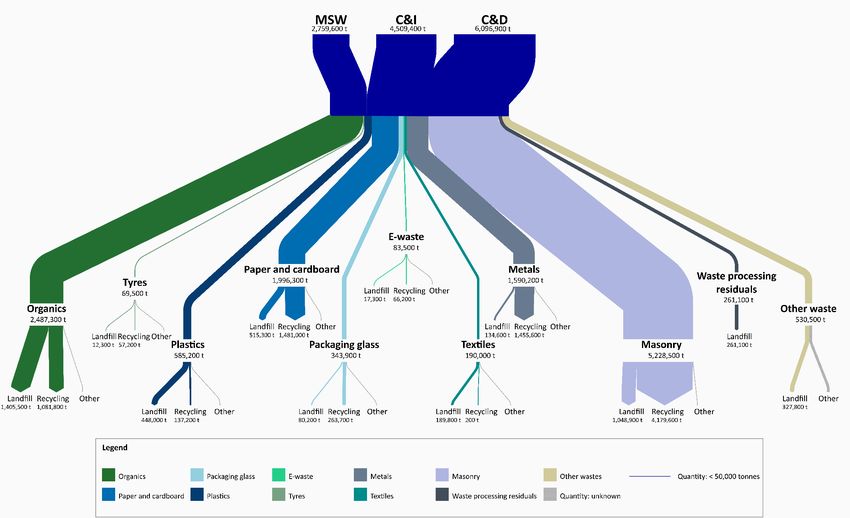
•    Materials are often generated at some distance from end-markets. Inability to benefit from
     economies of scale can mean the costs for collection, transport and processing may not be fully
     recovered.
•    Markets for some recovered materials are robust and well-established, while others are still in
     development stage or non-existent. Many materials (such as metals, plastics, paper and
     cardboard) are reliant on export markets, which have been significantly impacted by recent
     import bans in China and other Asian countries.

Victoria has a range of future infrastructure opportunities to enhance resource recovery and
transition to a circular economy. The common purpose is for facilities which allow for aggregation,
sorting and decontamination of bulk quantities of a range of materials, and produce market-ready
products for remanufacture.

While the feasibility of individual facilities would need to be confirmed, key opportunities include:
•    Ongoing development of organics processing facilities to meet population growth in the
     Metropolitan and Barwon South West regions, as well as peri-urban growth areas in Goulburn
     Valley (Mitchell), Loddon Mallee (Macedon Ranges), Gippsland (Baw Baw, Bass Coast) and
     Grampians Central West (Moorabool, Golden Plains) regions.
•    Infrastructure and equipment for enhanced organics recovery and management including:
     - separation of organics from high density housing and commercial businesses
     - processing and bulk-haul infrastructure in underserviced parts of regional Victoria
     - compost decontamination equipment
     - processing, energy recovery or value-add systems for oversize and low-value organic
          products
     - energy recovery and bio-refining infrastructure for timber and woody wastes (these could
          also process agricultural and forestry biomass)
     - mixed waste processing technologies to extract recyclables for recycling and organic-rich
          fractions (including non-recyclable paper and cardboard) for energy recovery, noting that
          the fossil carbon component of input will contribute to greenhouse gas generation
     - processing capacity for food processing wastes (including almond hulls in Loddon Mallee
          region) and forestry/plantation residues in Gippsland and Barwon South West regions
     - bioenergy facilities capable of processing forestry and agricultural biomass, as well as
          MSW, C&I and C&D wastes in regional Victoria.
•    Upgraded MRFs with improved sorting and decontamination equipment and processes. The
     MRFs should allow for capture of materials additional to the current suite (including soft and
     hard plastics) and separation of current mixed streams into discrete materials.
•    Plastics sorting and flaking facility, allowing production of a market-ready output which is
     readily usable by plastics recyclers. Subject to market demand, the facility should allow for
     separation of PET, HDPE, LDPE, PP, PS and PVC.
•    Plastics recycling facilities which have the capacity to produce food-grade materials and meet
     growing market demand. Subject to demand, these could be located in regional Victoria close
     to food processors and manufacturers (e.g. in Goulburn Valley and North East regions) where
     market supply arrangements can be negotiated.
•    Pilot plant to explore the use of plastics in hydrogen fuel manufacture. As a potential fossil fuel
     replacement, hydrogen fuel is of increasing interest in Australia and could form the basis of a
     future valued industry in Victoria.
•    Paper recycling and remanufacturing facilities, including pulping facilities and mills for
     production of cardboard and moulded fibre packaging.

Victorian waste flows                                                                                Final
                                                 Page ii
• Glass beneficiation plants with improved sorting equipment to capture small glass fragments
and remove contaminants.
• Mechanical e-waste processing facilities which can recycle a range of e-waste materials in bulk
quantities. For optimum economic return, they should be able to recycle printed circuit boards
and recover precious metals and rare earth elements. As facilities handling bulk quantities, they
are best located in the Metropolitan region where e-waste from around Victoria can be
aggregated. There may be some transition of current manual handling facilities to mechanical
processing; there may also be some closure of outdated facilities and new market entrants.
New facilities should also be commissioned to handle new materials (such as photovoltaic
panels and batteries) as they enter the waste stream in large numbers.
• Pyrolysis facilities for energy recovery from waste tyres, including market opportunities for use
of gas/liquid fuel.
• One or more ‘dirty’ MRFs to recover additional materials from the residual waste stream,
particularly from the C&I sector and multi-unit developments, and thermal energy from waste
facilities (co-located with the dirty MRFs) for energy recovery from the residual waste stream
(including shredder floc) which cannot otherwise be recycled. The facilities could be located in
suitable industrial precincts (e.g. in Melbourne and Geelong) which allow for use of heat and
electricity.
Victorian waste flows Final
Page iii1. Introduction
Infrastructure Victoria commissioned this report to gain an understanding of the flows and fates of waste
and recovered resources in Victoria. The project objectives are to provide:
• a current benchmark of waste data flows, market value, value-add opportunities and fates of materials
in the Victorian waste and resource recovery sector presented within a circular economy context
• detailed analysis that provides clarity and transparency on the recovery fates of waste and recovered
resources and the markets they enter
• identification of opportunities to increase recovery rates and improve material outcomes to realise a
circular economy in Victoria.
The investigation involved accessing current datasets from various organisations to develop a baseline of
quantities involved; analysis of waste and recovered resource flows, fates, markets and transaction costs;
and consultation with key stakeholders. This research formed the basis for identification of potential
opportunities for intervention by Infrastructure Victoria in the flow of materials in the context of
developing a circular economy in Victoria.
The Victorian recycling industry is currently experiencing a period of volatility due to a range of market
issues and export bans. Changes to recycling infrastructure could offer the potential for improved industry
resilience and realise local economic opportunities, including transition to a circular economy.
The circular economy seeks to reduce the environmental impacts of production and consumption and gain
more productive use from natural resources. This sees continual reuse and recycling of materials, reducing
the need for extraction of virgin materials, the amount of waste disposed to landfill and our environmental
footprint. The concept is shown in Figure 1.
Figure 1 A circular economy for Victoria
Source: DELWP 2019
Victorian waste flows Final
Page 42. Context
2.1 Management framework
The Victorian waste management and resource recovery planning framework is built on the establishment
of seven geographical regions across local government boundaries:
• Barwon South West (incorporating nine local councils)
• Gippsland (six local councils)
• Goulburn Valley (six local councils)
• Grampians Central West (12 local councils)
• Loddon Mallee (eight local councils)
• Metropolitan (31 councils in metropolitan Melbourne)
• North East (seven local councils).
Each region has a Waste and Resource Recovery Group (WRRG) established under the Environment
Protection Act 1970, with statutory responsibilities for waste and resource recovery planning. Waste and
material flows are therefore managed and reported according to each region. These regions form the basis
of discussion of regional flows included in this report.
2.2 Data sources
This report uses a synthesis of available data and industry knowledge to provide an evidence-based
foundation for understanding waste and recovered resource flows in Victoria. While Victoria works
towards a circular economy, there is a current gap in available data on some steps included in the
conceptual diagram in Figure 1. There is little data available on the size and scope of remanufacture and
repair/reuse initiatives. There are also some flows of waste to the environment, including litter, illegal
dumping and stockpiles, that are not well quantified. This report therefore focuses on flows as shown in
Figure 2 overleaf.
Victorian waste flows Final
Page 5Figure 2 Flow of waste and recovered resources
Waste and recycling industry data is complex. The main data limitation in the report relates to data
comparability. The method and quality of waste data collected across Victoria varies between facility,
council and region. Waste is also generally measured by sector (e.g. municipal solid waste, commercial and
industrial, construction and demolition) and by material stream (e.g. organics, plastics, metals, etc.). These
two measures are generated from different data which do not readily reconcile.
Waste data continues to improve with efforts to standardise and expand data collection in Victoria, albeit
data gaps and comparability remain apparent. The most significant data gap is how materials are
processed after collection and where recycled materials flow. After waste is collected, limited data is
reported on processed materials as it moves from facility-to-facility due to the commercially sensitive
nature of this information. Material flow data is critical to understanding how Victoria can transition to a
circular economy. In the absence of in-depth material flow data, the analysis here focuses on material
flows at an aggregated level either by sector or material by region/state.
Most data within this report was obtained from Victorian Government agencies, which collect it for
monitoring and reporting purposes. This mainly comprises tonnes of waste sent to landfill and various
forms of recycling. Where available, this data has been supplemented and sometimes replaced by more
recent industry data or other estimates such as Australian Government data on recycling commodity
exports and plastics recycling.
Table 1 lists the best available datasets used. Note that at the time of writing, 2018-19 datasets were not
available and that 2017-18 has been adopted as the baseline year.
Victorian waste flows Final
Page 6Table 1 List of datasets used
Dataset Source Reference year
Australian Packaging Covenant Organisation (APCO) APCO/Envisage Works 2017-18
packaging flow data
Barwon South West local govt survey data Barwon South West WRRG 2017-18
Regional Implementation Plans Barwon South West, Gippsland, Various
Goulburn Valley, Grampians Central
West, Loddon Mallee, Metropolitan,
North East WRRGs
National waste database Department of the Environment and 2016-17
Energy (DoEE)
Victoria in Future 2019 Department of Environment, Land, 2017-18
Water and Planning (DELWP)
Victorian waste flows Department of Environment, Land, 2016-17
Water and Planning
Goulburn Valley local govt survey data Goulburn Valley WRRG 2017-18
Loddon Mallee local govt survey data Loddon Mallee WRRG 2017-18
Metropolitan resource recovery centre network Metropolitan WRRG 2017-18
Metropolitan reprocessor capacity Metropolitan WRRG 2017-18
Metropolitan WRRG recycling data Metropolitan WRRG 2017-18
E-waste reprocessing capacity data Sustainability Victoria (SV) 2016-17
Landfill composition Sustainability Victoria 2017-18
Landfill data Sustainability Victoria 2017-18
Market bulletin data Sustainability Victoria 2017-18
Plastics data Sustainability Victoria 2017-18
Statewide Waste and Resource Recovery Sustainability Victoria 2015-16
Infrastructure Plan
Used tyres material flow analysis and market Sustainability Victoria 2015-16
opportunities assessment model
Victorian recycling industry annual report Sustainability Victoria 2017-18
Victorian local govt annual waste services report (inc. Sustainability Victoria 2017-18
litter)
Victorian e-waste materials flow analysis Sustainability Victoria 2017-18
Waste export data - Victoria Sustainability Victoria 2017-18
See Appendix A for more details
Datasets used in the report have been made available to the public in the interest of transparency, where
possible. Some datasets contain sensitive commercial and legal information and are classified as
confidential. Any confidential data included in the report has been de-identified or aggregated to mitigate
disclosure risks.
Some datasets precede the baseline year, in which case a range of factors (including population
projections, household/industry generation rates and industry knowledge) have been used to benchmark
Victorian waste flows Final
Page 7all data to 2017-18. Other data transformations have also been done to quantify wastes by material, sector
and region as appropriate. Any form of data manipulation may impact on the reliability of the data. Based
on this, the quality of data has been measured throughout the analysis to ensure the methods are
accountable. Each input dataset is ranked with data quality attributes. An analysis of reliability for each
dataset is provided in Appendix A. Overall aggregated data that is routinely collected according to
established standards is generally high quality.
Information on gate fees, material costs and market prices are based on a range of public information from
internet searches, industry publications and estimates based on industry knowledge.
All data used in development of this report is included in the accompanying Microsoft Excel workbook
along with a 20-year waste projection to help identify future demand for infrastructure. Note all numbers
expressed in this report have been rounded, and may include estimates where required for data availability
or quality purposes. Assumptions are detailed in the findings and datasets.
Victorian waste flows Final
Page 83. Waste pathways
This section details the flow of waste through the Victorian waste and resource recovery network, focusing
on what happens after the point of ‘recover and manage’ in a circular economy. A number of data gaps
and discrepancies have been identified in the datasets used in assessing the waste pathways and are noted
throughout this chapter where appropriate.
Waste pathways are dynamic as they are underpinned by contractual arrangements for waste collection,
disposal and processing and the location of markets (which differ by material and region). Inconsistencies
in some data collection and reporting adds uncertainty around the total waste generated and managed1.
There is also limited information available to identify cross-regional or interstate flows. As such, the
estimated quantities of waste generated by sector in this chapter are to be considered with some degree of
uncertainty. This section discusses current flows as indicated by the available data, noting that future
pathways may be different.
3.1 Generation and management
Waste is generated from three main sectors:
• municipal solid waste (MSW) – domestic and other waste generated or managed by local government
• commercial and industrial (C&I) – waste generated by business and industry
• construction and demolition (C&D) – waste from building and development activities.
Waste from these three sectors may enter the management pathway separately or together. Waste
quantities are recorded at the point of receipt at waste management facilities. There is a regulatory
requirement for the source of waste to be recorded for waste being deposited at licensed landfills,
however this does not include all waste facilities in Victoria. Waste entering unlicensed landfills or transfer
stations (particularly in rural areas) may not be recorded by source.
Not all waste is managed in the same region that generated it, with waste transported to other regions for
processing or disposal to landfill; some waste is also known to be transported to or from other states e.g.
inflows of recyclables from South Australia and outflows of waste to NSW for disposal. The main reasons
for this relate to the lack of reprocessing capacity in some regions for certain materials or lack of landfill
airspace for disposal, collaborative arrangements between Victorian and NSW councils, and sufficient
economies of scale that make transport feasible. Commercial reprocessors are also known to import
materials from generators interstate. Waste quantities transported outside Victoria have been excluded
where known.
Given this, the following sections relate to waste ‘managed’ which aligns with the 2018 Statewide Waste
and Resource Recovery Infrastructure Plan (SV 2018).
There are various data sources that estimate the total waste managed by sector however some are
outdated (e.g. WRRG regional implementation plans) or are aggregated and require some assumptions to
be made. In this report, the total waste managed has been estimated based on the sum of:
• waste landfilled from SV landfill data
1Waste ‘generated’ refers to waste that is produced. Waste ‘managed’ refers to waste that has passed through or been managed
(disposed, recovered, other recovery) at waste management facilities but may have been generated in another region.
Victorian waste flows Final
Page 9• materials recovered from SV’s Victorian Recycling Industry Annual Report (excludes rock/excavation
stone, soil/sand2 but includes e-waste quantities).
• other waste pathways such as illegal dumping, littering, abandoned waste from EPA illegal dumping
records and SV’s Local Government Waste Services Report.
This is based on a statewide level given that there is limited up-to-date information available to deduce
waste quantities by region and sector.
MSW
The largest component of MSW comes from kerbside bin collection services (e.g. garbage, co-mingled
recycling, food and garden organics). Other MSW sources include drop-off facilities (including resource
recovery centres, transfer stations and landfills), hard waste collections, litter collections, council street
sweepings and other council activities, and public place waste and recycling services.
In 2017-18, about 2.8 million tonnes of MSW was estimated to be generated in Victoria (around 21% of the
total waste stream). However, this is a conservative figure as there are a number of data anomalies (and
potentially some under-reporting) as a consequence of the following:
• Subject to contractual arrangements for council collection services, kerbside waste may sometimes
include waste from businesses (or vice versa), for which the split between MSW and C&I waste is
generally not known.
• Council waste data extends to waste facilities such as resource recovery centres and transfer stations.
Data recording systems often differ across councils, particularly in rural areas, and materials may be
differentially recorded according to weight, volume, number of units, load size or other parameters.
Factors used for standardisation may differ.
• There are a number of other waste types collected at regional facilities for which records can
sometimes be poor; this includes materials such as tyres, concrete, e-waste, timber and others.
• The quantities and types of materials received at privately-owned facilities (especially recovered
resources from transfer stations) may not be widely reported.
C&I
About 4.5 million tonnes of C&I waste was estimated to be generated in 2017-18, comprising around 34%
of the total waste generated in Victoria.
Sources of C&I waste differ by region depending on the industry sectors that are present but typically arise
from small to medium enterprises (SMEs) or large businesses. For SMEs, C&I waste may be collected via
council kerbside services or commercial collection contractors, or taken directly to local waste
management facilities. For large businesses, waste is generally collected by commercial contractors,
however some businesses may manage their waste on-site without entering the waste management
pathway. This could include selected waste streams (e.g. industrial organic solids and sludges from an on-
site wastewater treatment plant) or entire industry sector practices (e.g. forestry or farming residues which
are left in-situ).
C&I waste data is captured at the point of management however commercial confidentiality concerns
means there are limitations on the information available, particularly at a regional level.
2 Rock/excavation stone and soil/sand are outside the scope of the analysis.
Victorian waste flows Final
Page 10C&D
C&D waste is generated from residential, commercial and construction and demolition activities and is
generally collected as mixed or segregated streams. C&D waste makes up about 46% of the total waste
generation in Victoria which is estimated to be about 6.1 million tonnes. Similar to the C&I data, C&D data
is commercially sensitive and data availability on pathways is generally limited.
3.2 Sorting
Sorting occurs at various points in the waste pathway and may include source separation at the point of
generation or segregation of materials downstream at waste management facilities. The level of sorting
achieved impacts on the quality of recycling outputs and market viability.
Source separation tends to be inconsistent as it involves manual sorting which relies on individual
knowledge of what can and cannot be recycled. Poor sorting at kerbside contributes to high bin
contamination rates in the co-mingled recycling stream, which impacts on the quality of outputs
downstream. Currently, the average bin contamination rate in the kerbside recycling stream is 11% by
weight for the metropolitan region and 10% in regional areas. However, some areas are known to have
contamination rates as high as 25%. Some sorting also occurs at drop-off facilities prior to downstream
recovery processes.
Material recovery facilities (MRFs) play a significant role in the Victorian waste and resource recovery
infrastructure network, as the network is structured around the collection of mixed waste streams for
downstream sorting. A total of 13 MRFs operate in Victoria, of which five are located in the Melbourne
metropolitan region. All MRFs are owned and operated by private organisations. Some of these MRFs are
also known to receive and sort recyclables from interstate such as South Australia and Tasmania.
Note three MRFs are owned by SKM Recycling, which was recently placed in receivership. The future
operation of the three facilities (two in Melbourne and one in Geelong) is currently uncertain.
Most MRFs sort co-mingled recyclables from the MSW and, to a limited extent, the C&I sectors into
discrete material types for further processing downstream. Some recyclables may be missed during sorting
and end up in the residual stream for disposal at landfill, along with contaminated recyclables.
Only a small portion of C&I recyclables are taken to MRFs. Both C&I and C&D waste can follow various
paths from the point of generation to recovery, often determined by the commercial arrangements in
place with waste management contractors. This includes:
• Supplier ‘take-back’ arrangements, where supply contracts include return of faulty or unwanted
goods. Logistics companies typically play a major role in these arrangements and there may be a
number of aggregation sites between the waste generator and reprocessor.
• Single-stream and mostly uncontaminated materials may be taken directly from the point of
generation to reprocessing facilities. Examples include abattoir paunch waste directed to organic
reprocessing facilities and glass bottles collected from pubs/clubs taken to glass beneficiation plants.
• Small businesses often utilise drop-off facilities (both council and privately-owned), depositing items
such as garden organics (e.g. from lawn mowing, gardening services) and cardboard (e.g. from
retailers) for recycling.
• There are some stand-alone C&D sorting facilities in Victoria that recover materials with recycling
value from mixed C&D waste. These are typically operated by C&D skip bin hire companies.
• Some large factories, based on industrial ecology principles, may use waste from another factory as a
raw material, although the incidence of this in Victoria is thought to be low.
Victorian waste flows Final
Page 11• A number of large organisations may have national contracts with waste management companies
which allow for collection and disposal of all waste streams. There is often a financial incentive for the
contractors to sort material at their own sites and recover as much material as possible, prior to
disposal of the residual waste.
3.3 Recovery
There are three main recovery pathways in Victoria: repair and reuse, recycling and energy recovery.
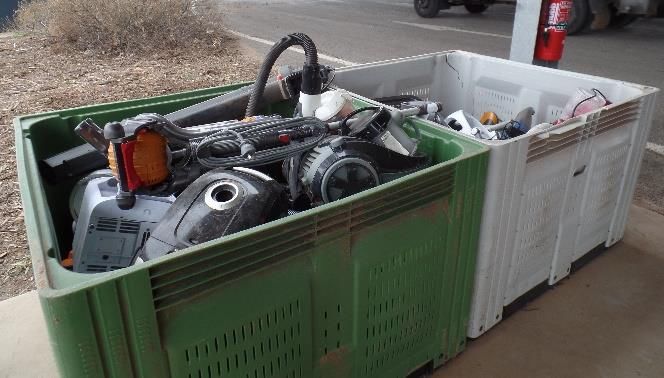
Repair and reuse
Repair and reuse shops in Victoria are generally located at resource recovery centres or landfills and
operated by community groups, local councils or not-for-profit organisations. While exact numbers are not
known, there is thought to be fewer than 20 repair and reuse shops in Victoria.
Materials are generally sourced from items diverted from the waste stream; typical items include furniture,
bicycles and homewares. If items are not readily sold (a common occurrence), they re-enter the waste
stream and are usually disposed to landfill. Consequently there is limited data available on the quantity of
materials recovered and flows from repair and reuse shops (e.g. to landfill and for reuse).
Recycling
Most waste that is recovered in Victoria is sent for recycling. In 2017-18, about 8.7 million tonnes of
resources were recovered in Victoria.
The Victorian Recycling Industry Annual Report (SV 2019b) reports on the quantities recovered by material
type (aggregates, masonry and soil, glass, metals, organics, plastics, rubber and textiles). This is a voluntary
reporting system that relies on the willingness of individual organisations to participate. As such, the total
quantities reported each year are likely to differ each year and may not be representative of how much is
recovered from all facilities in Victoria, however it is considered to represent the ‘best’ estimate available.
To align with the scope of the analysis, some data adjustments have been made to account for e-waste and
exclude materials such rock/excavation stone, soil/sand and other rubber waste. The adjusted quantities
of waste recovered in Victoria have been summarised in Table 2 below.
Table 2 Tonnes and proportion of waste recovered in Victoria by material 2017-18
Tonnes % of total recovered (by
weight)
Organics 1,081,800 12%
Paper and cardboard 1,481,000 17%
Packaging glass 263,700 3%
Plastics 137,200 2%
E-waste 66,200On a weight basis, almost 50% of waste recovered in 2017-18 comprised of masonry materials. Paper and
cardboard and metals were the next highest types of materials recovered, followed by organics.
There is limited up-to-date data available on the quantities recovered by region by material and cross-
regional flows from the point of generation to point of recovery across the sectors. Some data is available
from the regional implementation plans prepared by each WRRG. It is uncertain whether the data remains
representative of the current situation however it is considered to provide the ‘best’ indication of
quantities recovered in each region by material given that most reprocessing facilities are likely to still be in
operation.
To provide an indication of the quantities recovered in each region, a number of data sources have been
used and supplemented by some assumptions to fill in data gaps. Victorian data from Table 2 has been
disaggregated to determine the quantity of waste estimated to be recovered in the metropolitan area
(based on 2017-18 data provided by the Metropolitan WRRG) and non-metropolitan area. The quantities
of waste recovered in the non-metropolitan area have been further disaggregated based on the proportion
of waste recovered in each region from the WRRG regional implementation plans3.
Table 3 presents the quantities of waste recovered at reprocessing facilities in each region by material.
Note that the quantities shown in the table for organics are an exception. In the table, the organics
category consists of three sub-streams: food and garden organics, timber, and other organics. Waste
tonnages for food and garden organics refers to how much was recovered in each region rather than how
much was received at reprocessing facilities. Waste tonnages for timber and other organics refers how
much was received at reprocessing facilities in the region.
Table 3 Estimated tonnes of waste recovered in each region by material 2017-18
Barwon Gippsland Goulburn Grampians Loddon Metro- North
South Valley Central Mallee politan East
West West
Organics* 77,900 33,700 30,200 25,300 38,700 850,000 26,000
Paper and cardboard 86,200 152,100 44,100 12,100 61,600 1,097,100 27,900
Packaging glass 0 0 0 0 0 263,700 0
Plastics 10,500 20,300 5,300 2,700 7,300 87,900 3,300
E-waste 0 0 0 600 0 65,600 0
Tyres 0 0 0 0 0 57,200 0
Metals 0 0 0 0 0 1,455,600 0
Textiles 0 0 0 0 0 200 0
Masonry 222,400 30,900 113,600 17,600 158,900 3,564,400 71,800
All 397,000 237,000 193,000 58,300 266,500 7,441,700 129,000
*excludes biosolids
Based on industry knowledge, some materials are known to flow from regional areas to the metropolitan
area for reprocessing, such as metals, packaging glass, textiles and tyres, although some sorting may occur
regionally. This has been reflected in Table 3.
Table 3 indicates that most waste that is recovered in Victoria is reprocessed in the Metropolitan region4.
3 Assumes that the proportion of waste recovered in each region by material remains the same each year.
4 Recovered refers to materials that have been diverted from landfill for reprocessing or use through facilities in the region
irrespective of where the recovery or reprocessing takes place. Reprocessed refers to materials that have passed through
reprocessing facilities in the region.
Victorian waste flows Final
Page 13A wide range of reprocessors operate in Victoria but the available information on their operating status is
generally limited or outdated. Table 4 provides a summary of the types and number of reprocessors in
each region, based on the most recent information available (2015-16 from the Statewide Waste and
Resource Recovery Infrastructure Plan) and updated where known. Note that the table includes some
dismantling facilities that send materials to another facility for reprocessing. Some facilities also accept
more than one type of material and there may be some double counting in the figures in Table 4.
Table 4 Reprocessors by region 2018
Region Barwon Gippsland Goulburn Grampians Loddon Metro- North East
South Valley Central Mallee politan
West West
Food organics 1 2 1
Garden organics 11 2 1 4 1 4
Mixed food and 3 1 2
garden organics
Timber 2 3 3 1 1
Other organics 6 4 7 3 4
Paper and 1 6 1
cardboard
Glass 2
Plastics 1 3 1 2 18
Tyres and rubber 2
Metals 2 5
Masonry 5 13 3 4 2 22 2
Textiles 2 1
E-waste 1 1 5
Waste to energy 2 1 2 2 2
Source: Statewide Waste and Resource Recovery Infrastructure Plan 2018
Blue refers to reprocessors being present in the region, yellow refers to no reprocessors present
The data provided in the table may not be representative of the current facilities operating in Victoria given
that there is no up-to-date information available on the number and types of reprocessors operating in
each region. Since the release of the WRRG regional implementation plans, new facilities have been
established, some have closed or been upgraded or changed. There is insufficient information to update
the table at this time but it is considered to be the ‘best’ estimate available.
Energy recovery
While some large energy from waste facilities have been proposed in Victoria, none have yet been
developed. There are a number of small-scale industrial facilities that recover energy from waste which is
generated on-site. Examples in Victoria include energy recovered from piggery manures, almond husks and
timber residues. However as this material is managed in-situ it is not considered to have entered the waste
stream.
Some landfills in Victoria are equipped with methane gas collection systems that generate electricity from
the decay of waste. Methane is generated mainly from the decomposition of food, garden organics and
paper and cardboard waste from MSW and C&I sectors. The quantity of waste contributing to methane
production when landfilled can be considered to be ‘recycled’ in this context.
Data reporting on energy recovery from landfills is not required under Victorian regulation, but is included
in national reporting. At the time of writing, the most recent data available on energy recovery was for
Victorian waste flows Final
Page 142016-17. Based on this, about 578,200 tonnes of waste was used for energy recovery (of which 99% was
derived from landfill gas capture and electricity generation).
3.4 Disposal
Landfills are the main waste disposal pathway in Victoria for MSW, C&I and C&D waste. In 2017-18, 61
licensed landfills received non-prescribed waste, of which 23 were in the Metropolitan region. Additional
unlicensed landfills service the waste disposal needs of small population centres (less than 5,000 people).
A number of other sites have landfill licences but are currently inactive or in the process of closing.
Not all waste is landfilled in the region that generates it. Some regional councils transport their waste to
large metropolitan landfills with economies of scale sufficient to offer attractively low prices. Several
hundred thousand tonnes of C&I waste are transferred each year from the Metropolitan region to the
Maddingly Brown Coal landfill in the Grampians Central West region.
Some waste generated in northern areas of the Goulburn Valley, Loddon Mallee and North East regions is
known to be transported to NSW landfills for disposal (e.g. Albury landfill, Buronga landfill). As the NSW
landfill levy does not apply further south than the Illawarra region (around Wollongong), these landfills are
levy-free and generally cheaper than Victorian disposal options. Interstate and cross-regional waste
disposal flows are often undertaken by commercial contractors under arrangements that are confidential
and subject to change. While information is therefore limited, SV (SV 2018) has estimated that over 46,000
tonnes/year is deposited in NSW landfills.
In 2017-18, a total of 4.44 million tonnes of waste was landfilled. This excludes prescribed industrial waste
category B, category C and category C asbestos. About 1.7 million tonnes (39% by weight) was MSW and
2.7 million (61%) was solid industrial waste (i.e. C&I and C&D waste).
There is relatively good data on how much waste is landfilled in each region in Victoria (due to EPA
mandatory reporting requirements), particularly at landfills that have a weighbridge. Landfills without
weighbridges generally report based on volume estimates and are converted to tonnes using conversion
factors, adding some level of uncertainty to the data.
Table 5 shows the quantity of waste landfilled in each region by sector. Note that the data provided is
based on the assumption that C&I waste makes up 65% by weight of the solid industrial waste landfilled,
and C&D makes up 35%.
Table 5 Tonnes of waste landfilled in each region 2017-18
Barwon Gippsland Goulburn Grampians Loddon Metro- North Victoria
South Valley Central Mallee politan East
West West
MSW 87,000 63,800 84,200 80,700 104,300 1,281,300 16,700 1,718,000
C&I 63,300 39,500 36,200 322,700 29,400 1,273,000 5,700 1,769,800
C&D 34,100 21,200 19,500 173,800 15,800 685,400 3,100 953,000
Total 184,500 124,500 140,000 577,200 149,500 3,239,700 25,400 4,440,800
Landfills vary substantially in size. In 2017-18 (excluding prescribed waste) six licensed sites received more
than 100,000 tonnes of waste and 42 sites received less. The landfill accepting the most waste received
almost 30% of the total, as much as the smaller 42 licensed sites.
There is limited information on the composition of waste landfilled in each region. SV conducted a landfill
waste audit in 2018 which provides an indication of the average composition of waste landfilled in Victoria.
Victorian waste flows Final
Page 15However, this is considered to be a snapshot only given that the composition is likely to vary depending on
the type of landfill receiving the waste (e.g. putrescible or inert) and waste types accepted.
The quantity of waste landfilled by material type and region is provided in Table 6. This has been estimated
on the basis that the average composition of waste landfilled in each region is the same. These estimates
are to be considered with some uncertainty given that there are discrepancies when compared with other
waste flow models. For example, the Victorian e-waste flow model estimates that about 69,000 tonnes of
e-waste were landfilled in Victoria which suggests that the quantity in Table 6 could be an underestimate.
Similarly, the Victorian used tyres material flow analysis and market opportunities assessment model
estimates that 53,500 tonnes of end-of-life tyres are sent to landfill, indicating the quantity landfilled could
also be an underestimation.
Table 6 Estimated tonnes of waste landfilled by region and material 2017-18
Barwon Gippsland Goulburn Grampians Loddon Metro- North Victoria
South Valley Central Mallee politan East
West West
Organics 60,100 41,100 47,500 168,200 52,200 1,029,600 8,800 1,407,300
Paper and 21,400 14,400 16,100 68,000 17,100 376,900 2,900 516,800
cardboard
Packaging 3,400 2,400 2,700 9,500 3,000 58,800 500 80,400
glass
Plastics 18,600 12,600 14,100 58,600 15,000 327,600 2,600 449,100
E-waste 800 600 700 1,300 900 12,800 100 17,300
Tyres 500 300 300 2,000 300 8,900 100 12,300
Metals 5,300 3,500 3,700 19,900 3,800 97,900 700 134,800
Textiles 7,700 5,100 5,500 27,000 5,700 138,300 1,000 190,200
Masonry 38,300 24,200 23,200 181,400 20,200 752,100 3,800 1,043,300
Waste 13,200 9,700 12,800 12,300 15,800 194,800 2,500 261,100
processing
residuals
from MRF
Other waste 15,100 10,700 13,200 28,900 15,500 242,000 2,500 328,000
Total 184,500 124,500 140,000 577,200 149,500 3,239,700 25,400 4,440,800
Does not include quantities of shredder floc
Totals may not add up due to rounding
Table 6 indicates that most of the waste landfilled in Victoria is organic waste. Masonry materials are the
second largest type of waste landfilled, followed by paper and cardboard and plastics.
Disposal costs
Disposal costs generally differ across Victoria according to waste type, quantity, location and facility type,
although some trends are common:
• Waste from the C&I sector is the most expensive to dispose of to landfill; this reflects the higher
management risks and environmental protection requirements. A number of council-owned facilities
will only accept C&I waste in small amounts (e.g. limited to 3-tonne trucks) or will not accept it at all
(particularly at transfer stations).
• Drop-off fees for recyclable material are lower than fees for waste which is deposited to landfill. This
price differential applies to MSW, C&I and C&D waste, but may not be sufficient in all cases to drive
separation of recyclables from landfill waste. Examples include:
Victorian waste flows Final
Page 16- C&I waste where the labour cost of separation, logistics of storage and other issues are believed
by individual businesses to outweigh the reduced cost of disposal of the recyclable component of
their waste stream
- self-hauled MSW where householders are not inclined to separate their waste.
• Waste from the C&D sector is the cheapest to dispose of to landfill as the bulk of the material is inert
waste, with lower environmental risks and management costs. Much of it can be separated and
recycled (e.g. concrete, bricks, timber). Some landfills (e.g. Fyansford landfill in the Barwon South
West region) accept only inert waste.
• Council facilities often accept materials at no cost when they can be recycled (e.g. comingled
recyclables, metals) or at minimal cost (e.g. garden organics, e-waste).
• Fees are charged by weight at large facilities which have a weighbridge installed. Many rural facilities
do not have a weighbridge and charge by volume or container size (e.g. car boot load, trailer/tandem
trailer). For selected items, the fee may be charged per unit (e.g. tyres, televisions).
• Some facilities impose a minimum charge regardless of the amount of waste, and others (particularly
council facilities) charge different rates for residents or non-residents.
• Some councils provide ‘tip vouchers’ to their ratepayers, allowing free waste disposal for a set number
of visits. This can sometimes be in conjunction with pre-bushfire season clean-ups.
Landfill gate fees include the Victorian landfill levy, which for the 2017-18 baseline year of this report was:
• $63.28/tonne for all waste types in the metropolitan area and regional cities (now $65.90/tonne)
• in rural areas, $31.71/tonne for municipal waste and $55.46/tonne for industrial waste (now
$33.03/tonne and $57.76/tonne respectively).
The levy has risen approximately 2% per year since 2017-18 and is currently the subject of a Victorian
Government review.
Disposal fees for self-hauled MSW deposited at regional facilities range between $12 and $25 per car load.
This is lower than at facilities in the Metropolitan region, where comparable waste attracts fees between
$23 and $50 per car. Disposal fees for bulk loads of MSW are based on different units (e.g. m3, tonnes) at
different facilities, making comparison difficult.
Advertised fees for landfill disposal of C&I waste range between $173 and $246/tonne (including levy) in
the Metropolitan region, and between $172 and $240/tonne in regional areas. The calculated average fee
in the Metropolitan area ($198/tonne) is marginally higher than the regional average ($194/tonne),
reflecting the higher value placed on the site’s airspace. However as generators with large quantities of
waste to dispose of can often negotiate a discount on the advertised fee, the actual fee paid at
Metropolitan landfills (where quantities are generally larger) may be closer to (or less than) the fee applied
at regional landfills.
A small number of Metropolitan transfer stations will accept C&I waste; disposal fees at these facilities are
generally at the higher end of the range mentioned above (around $230/tonne) to reflect the additional
cost of transport to landfill.
Victorian waste flows Final
Page 173.5 Other
Some waste generated in Victoria enters the environment as litter, illegally dumped or abandoned waste
and is referred to as ‘other’ waste in this report. Litter is generated mainly from the MSW sector, while
most waste that is illegally dumped or abandoned is thought to come from the C&I and C&D sectors. The
scale of environmental discharges vary significantly by year, region and composition (particularly for illegal
dumping incidents and abandoned waste). If collected, this waste is generally taken to landfill for disposal.
Data on roadside litter and illegal dumping is captured in local government and EPA recording systems. At
the time of writing, only the local government data was available. Based on this, about 202,700 tonnes of
litter, illegal dumping and abandoned waste were reported to be present in the environment in Victoria.
This is considered to be underestimated and is likely to change annually.
Recent high-profile incidents where waste has been abandoned due to company failures or defaults
include:
• approximately 175,000 tonnes of C&D waste near Lara (in Barwon South West region)
• approximately 9,500 tonnes of tyres near Stawell (now removed by the EPA)
• approximately 5,000 tonnes of tyres near Numurkah (now removed by the EPA).
It is possible there are others yet to be identified.
Large amounts of abandoned waste can include materials that could be recycled (e.g. tyres, C&D waste).
Subject to how the abandoned waste arises, some stockpiles may be diverted to a reprocessing facility
rather than to landfill for disposal. However, this varies on a case-by-case basis and information on the fate
is generally limited unless made available by the EPA.
Stockpiling of sorted recyclables is currently occurring in Victoria, with MRF operators and reprocessors
holding material pending a return to better market conditions. If the company fails, there is a risk that the
sorted material could also be abandoned, requiring government intervention for disposal. The period for
which each company can feasibly stockpile material is unknown; it is possible that unless markets improve
in the short to medium term, much of the stockpiled material may need to be landfilled. Some industry
estimates suggest there is around 130,000 tonnes of recyclables currently stockpiled in Victoria.
3.6 Summary
Across all three MSW, C&I and C&D sectors in Victoria, a total of 13.4 million tonnes were estimated to be
managed in 2017-18. About 8.7 million tonnes were recovered, 4.4 million tonnes were landfilled and
about 200,000 tonnes entered the environment as litter, illegal dumping or abandoned waste. The overall
recovery rate for Victoria was about 65% in 2017-18.
Quantities of waste managed by sector, fate and material type have been estimated in Table 7. Note this is
based on a number of datasets and assumptions to fill data gaps which are provided in detail in the
accompanying Microsoft Excel workbook. The data provided in Table 7 has also been expressed
diagrammatically as shown in Figure 3.
Victorian waste flows Final
Page 18You can also read