Video Influencers: Unboxing the Mystique - Marketing Science ...
←
→
Page content transcription
If your browser does not render page correctly, please read the page content below
Marketing Science Institute Working Paper Series 2020
Report No. 20-147

Video Influencers: Unboxing the Mystique

Prashant Rajaram and Puneet Manchanda

 Video Influencers: Unboxing the Mystique” © 2020
 Prashant Rajaram and Puneet Manchanda

MSI working papers are distributed for the benefit of MSI corporate and academic members
and the general public. Reports are not to be reproduced or published in any form or by any
means, electronic or mechanical, without written permission.

Marketing Science Institute Working Paper Series
Video Influencers: Unboxing the Mystique

 Prashant Rajaram*
 Puneet Manchanda

 June 2020
 This Version: December 19, 2020

*Rajaram (prajaram@umich.edu) is a doctoral candidate and Manchanda (pmanchan@umich.edu) is Isadore and Leon Winkelman Professor and
Professor of Marketing, both at the Stephen M. Ross School of Business, University of Michigan, Ann Arbor, MI 48109, USA. This paper is a part
of the first author’s dissertation. The authors would like to thank David Jurgens, Eric Schwartz, Jun Li, Yiqi Li, Yu Song, the Marketing faculty
and doctoral students at the Ross School of Business, seminar participants at Ivey Business School, University of Wisconsin-Madison, Singapore
Management University, Bocconi University and the National University of Singapore for their valuable comments and feedback.

Marketing Science Institute Working Paper Series
Abstract

Influencer marketing is being used increasingly as a tool to reach customers because of the growing
popularity of social media stars who primarily reach their audience(s) via custom videos. Despite the rapid
growth in influencer marketing, there has been little research on the design and effectiveness of influencer
videos. Using publicly available data on YouTube influencer videos, we implement novel interpretable
deep learning architectures, supported by transfer learning, to identify significant relationships between
advertising content in videos (across text, audio, and images) and video views, interaction rates and
sentiment. By avoiding ex-ante feature engineering and instead using ex-post interpretation, our approach
avoids making a trade-off between interpretability and predictive ability. We filter out relationships that are
affected by confounding factors unassociated with an increase in attention to video elements, thus
facilitating the generation of plausible causal relationships between video elements and marketing outcomes
which can be tested in the field. A key finding is that brand mentions in the first 30 seconds of a video are
on average associated with a significant increase in attention to the brand but a significant decrease in
sentiment expressed towards the video. We illustrate the learnings from our approach for both influencers
and brands.

Keywords: Influencer Marketing, Brand Advertising, Social Media, Interpretable Machine Learning, Deep
Learning, Transfer Learning

 1
Marketing Science Institute Working Paper Series
1. Introduction
Influencers have the capacity to shape the opinion of others in their network (Oxford Reference, 2020).
They were traditionally celebrities (e.g., movie stars and athletes) who leveraged their expertise, fame and
following in their activity domain to other domains. However, 95% of the influencers today, or “social
media stars,” are individuals who have cultivated an audience over time by making professional content
that demonstrates authority and credibility (Creusy, 2016; O'Connor, 2017b). The growth in their
audience(s) has been in part attributed to the fact that influencer videos are seen as “authentic” based on a
perception of high source credibility. The increasing popularity of social media stars has resulted in an
exponential growth of the influencer marketing industry which is expected to reach a global valuation of
$10B in 2020 from $2B in 2017 (Contestabile, 2018). There are now more than 1100 influencer
marketing agencies in the world that allow brands to partner with influencers to promote their products
(Influencer Marketing Hub and CreatorIQ, 2020). These influencers primarily reach their audience(s) via
custom videos that are available on a variety of social media platforms (e.g., YouTube, Instagram, Twitter
and TikTok) (Brooks, 2020). In contrast to conventional advertising videos, influencer videos have
emerged as a distinct medium (see Section 3.1 for details explaining why). Despite the rapid emergence
and growth of influencer videos, there is limited research on their design and effectiveness (or indeed
influencer marketing in general). Specifically, little is known about the relationship between video
content and viewer reactions as well as the evolution of these videos over time.1
 In this paper, we investigate whether the presence and nature of advertising content in videos is
associated with relevant outcomes (views, interaction rates, and sentiment). There are three main
challenges in carrying out these tasks. First, most data in influencer videos are unstructured. In addition,
these data span different modalities – text, audio and images. This necessitates the use of state-of-the-art
machine learning methods commonly referred to as deep learning. The second challenge arises from the
fact that past approaches in marketing using such methods have typically made a tradeoff between
predictive ability and interpretability. Specifically, such deep learning models predict marketing outcomes
well out-of-sample but traditionally suffer from poor interpretability. On the other hand, deep learning
models that use ex-ante handcrafted features obtain high interpretability of the captured relationships but
suffer from poor predictive ability. Our “interpretable deep learning” approach handles unstructured data
across multiple modalities (text, audio and images) while avoiding the need to make this trade-off.
Finally, the analysis of unstructured data is computationally very demanding, leading us to use “transfer

1The literature on influencer marketing has primarily looked at the effect of textual content in sponsored blog posts on engagement with the post
(Hughes et al., 2019) and the effect of outbound activities to other users on increasing follower base (Lanz et al., 2019).

 2
Marketing Science Institute Working Paper Series
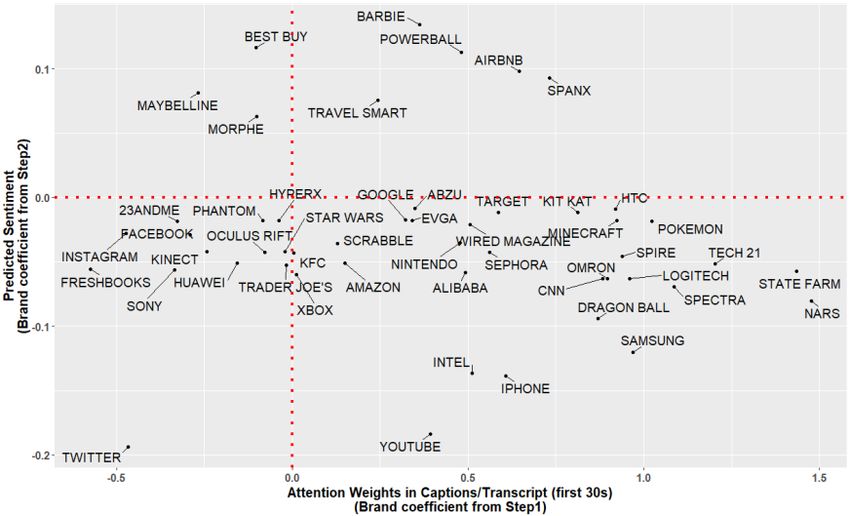
learning.” We apply our approach to publicly available influencer videos on YouTube (the platform
where influencers charge the most per post2 (Klear, 2019)).
 Our approach helps us identify statistically significant relationships between marketing (brand)
relevant outcomes and video elements. The significance of these relationships is supported by a
significant change in attention (importance) paid by the model to these video elements. For the outcomes,
we use publicly available data to develop metrics based on industry practice (Influencer Marketing Hub
and CreatorIQ, 2020) and past research on visual and verbal components of conventional advertising
(Mitchell, 1986). These metrics are # views, engagement (#comments / # views), popularity (# likes / #
views), likeability (# likes / # dislikes) and sentiment (details are in Section 3.3). The influencer video
elements we consider are text (e.g., brand names in title, captions/transcript and description), audio (e.g.,
speech, music, etc.), and images (e.g., brand logos, persons, clothes, etc. in thumbnails and video frames).
 As noted earlier, the analysis of videos is computationally demanding, so we use a random
sample of 1650 videos in order to interpret the relationship between the video elements and marketing
outcomes. These videos are scraped from 33 YouTube influencers who span 11 product categories and
obtain revenue from brand endorsements.3 A concern with the use of our sample size is the possibility of
“overfitting.” In order to prevent that, we implement transfer learning approaches (which also have the
added benefit of aiding interpretation). Transfer learning approaches, which are applied across all
modalities of text, audio and image data, involve using models pre-trained (at a high monetary and
computational cost) on a separate task with large amounts of data which are then fine-tuned for our
different but related task. This is followed up with an ex-post interpretation step that allows identification
of salient word pieces in text, moments in audio and pixels in images.
 The focus on interpretation allows us to document some interesting relationships (based on a
holdout sample) across all three modalities (while controlling for other variables including influencer
fixed effects). First, we find that brand name inclusion, especially in the consumer electronics and video
game categories, in the first 30 seconds of captions/transcript is associated with a significant increase in
attention paid to the brand but a significant decrease in predicted sentiment. Second, human sounds,
mainly speech (without simultaneous music), within the first 30 seconds are associated with a significant
increase in attention, and their longer duration is associated with a significant increase in predicted views
and likeability. Similarly, music (without simultaneous human sound) within the first 30 seconds is
associated with a significant increase in attention. However, longer music duration is associated with a
significant decrease in predicted engagement, popularity and likeability but a significant increase in

2 An influencer with 1M–3M followers on YouTube can on average earn $125,000 per post - this is more than twice the earnings from a post on
Facebook, Instagram or Twitter (O'Connor, 2017a).
3 Our usage of this data falls within the ambit of YouTube’s fair use policy (YouTube, 2020).

 3
Marketing Science Institute Working Paper Series
predicted sentiment. Third, larger pictures (of persons as well as clothes & accessories) in five equally
spaced video frames (within the first 30 seconds) are associated with a significant increase in attention
and predicted engagement. Fourth, more animal sounds in the first 30 sec of a video is associated with a
significant increase in attention and a significant increase in predicted likeability. Finally, we also
demonstrate that the focus on interpretability does not compromise the predictive ability of our model.
 These results are relevant for multiple audiences. For academics, who may be interested in testing
causal effects, our approach is able to identify a smaller subset of relationships for formal causal testing.
This is done by filtering out more than 50% of relationships that are affected by confounding factors
unassociated with attention (importance) paid to video elements. For practitioners, we provide a general
approach to the analysis of videos used in marketing that does not rely on primary data collection. For
brands, influencers and influencer agencies, our results provide an understanding of the association
between video features and relevant outcomes. Influencers can iteratively refine their videos using our
model and results to improve performance on an outcome of interest. Brands, on the other hand, can
evaluate influencer videos to determine their impact and effectiveness at various levels of granularity
(individual video elements, interactions of elements or holistic influence).
 Overall, this paper makes four main contributions. First, to the best of our knowledge, it is the
first paper that rigorously documents the association between advertising content in influencer videos and
marketing outcomes. Second, it presents an interpretable deep learning approach that avoids making a
tradeoff between interpretability and predictive ability. It not only predicts well out-of-sample but also
allows interpretation and visualization of salient regions in videos across multiple data modalities – text,
audio, and images. Third, it generates novel hypotheses between advertising content and a change in the
outcome of interest for formal causal testing as noted above. Finally, it provides a comprehensive, data-
based approach for marketers (and influencers) to assess and evaluate the quality of videos.
 The remainder of the paper is organized as follows. Section 2 discusses the related literature
while Section 3 describes the institutional setting and data used for analysis. Section 4 details the models
for analyzing structured and unstructured data. The results are described in Section 5 while the
implications of our approach and findings for practitioners (influencers and marketers) are described in
Section 6. Section 7 concludes with a discussion of the limitations and directions for future research.

 4
Marketing Science Institute Working Paper Series
2. Related Literature

In this section, we review the literature on influencer marketing and unstructured data analysis (using
deep learning) and describe how our work builds on it.4

2.1 Influencer Marketing
The nascent literature on influencer marketing has so far focused only on textual data (written text,
transcripts, etc.). Hughes et al. (2019) find that high influencer expertise on sponsored blog posts is more
effective in increasing comments below the blog if the advertising intent is to raise awareness versus
increasing trial. However, influencer expertise does not drive an increase in likes of the sponsored post on
Facebook, showing that the type of platform has a role to play in driving engagement. Zhao et al. (2019)
study the audio transcript of live streamers on the gaming platform Twitch, and find that lower values of
conscientiousness, openness and extraversion but higher values of neuroticism are associated with higher
views. Other research, such as Lanz et al. (2019), studies network effects on a leading music platform,
and finds that unknown music creators can increase their follower base by seeding other creators with less
followers than creators who are influencers (with more followers). Our focus is to add to this literature by
helping marketers better understand the role of text, audio and image elements in influencer videos.

2.2 Unstructured Data Analysis in Marketing via Deep Learning
The use of deep learning methods to analyze unstructured data in the marketing literature has gained
increasing prominence in recent years due to its ability to capture complex non-linear relationships that
help make better predictions on outcomes of interest to marketers. Marketing research on textual data has
used combinations of Convolutional Neural Nets (CNNs) and Long Short-Term Memory Cells (LSTMs)
to predict various outcomes including sales conversion at an online retailer (X. Liu et al., 2019), whether
Amazon reviews are informative (Timoshenko & Hauser, 2019) and sentiment in restaurant reviews
(Chakraborty et al., 2019). Research on image data has also used CNNs but within more complex
architectures such as VGG-16 to predict image quality (Zhang et al., 2017) or classify brand images
(Hartmann et al., 2020), Caffe framework to predict brand personality (L. Liu et al., 2018) and ResNet152
to predict product return rates (Dzyabura et al., 2018). Past research on both text and image data has
found that deep-learning models that self-generate features have better predictive ability than those that
use ex-ante hand-crafted features (Dzyabura et al., 2018; L. Liu et al., 2018; X. Liu et al., 2019). While
hand-crafted features suffer from poor predictive ability, they allow interpretability of their effect on the

4While there is marketing literature analyzing the effectiveness of conventional advertising videos (McGranaghan et al., 2019; Teixeira et al.,
2010, 2012), the difference between the two types of videos (see Section 3.1) makes it hard to use and/or build on.

 5
Marketing Science Institute Working Paper Series
outcome variable. We avoid ex-ante feature engineering of unstructured data, and instead use ex-post
interpretation, so that we do not need to make a trade-off between predictive ability and interpretability.
 Marketing literature has also worked with video data. Pre-trained facial expression classifiers
have been used on images from video frames to infer product preference while shopping (Lu et al., 2016).
Similarly, hand-crafted video features have been automatically extracted from images, audio and text of
projects on the crowd funding platform Kickstarter to study their relationship with project success (Li et
al., 2019). More recently, there has been research that embeds information from different data modalities
using deep learning methods to create unified multi-view representations. Combinations of structured data
and text have been used to predict business outcomes (Lee et al., 2018); brand logo images and textual
descriptions have been combined to suggest logo features for a new brand (Dew et al., 2019); and car
designs have been combined with ratings data to suggest new designs (Burnap et al., 2019). In our paper,
we do not generate a modality given the other modalities, but instead focus on providing tools to improve
each modality and interpreting the association between multiple modalities (text, images and audio) and
our outcomes of interest.

3. Data
3.1 Institutional Setting

As noted earlier, influencer videos have emerged as a distinct marketing medium. They are quite different
from conventional advertising videos5 in at least three ways. First, these videos can (and almost always
do) contain information that is unrelated to the sponsoring brand(s). This amount of information varies by
type of video. On the one extreme are “integrated-advertising” videos (e.g., unboxing videos, hauls,
product reviews, etc.) that feature the brand prominently throughout the video; at the other extreme are
the “non-integrated-advertising” videos that feature the name of the sponsored brand only in a part of the
video in the form of mini-reviews, audio shout outs, product placements or brand image displays
(Mediakix, 2020). The latter type of videos includes vlogs, educational videos, gaming videos, etc. that
are not directly related to the sponsoring brand(s).
 Second, influencer videos are typically much longer than a standard TV commercial especially on
platforms such as Instagram and YouTube.6 By making longer videos, influencers stand to gain higher
revenue from more mid-roll ad exposures. Furthermore, videos with higher expected watch time are more
likely to be recommended to viewers by the YouTube recommendation algorithm (Covington et al.,

5 Past work on characteristics of conventional advertising videos has studied their effect on ad viewing time (McGranaghan et al., 2019; Olney et
al., 1991), ad attention (McGranaghan et al., 2019; Teixeira et al., 2010, 2012), ad liking / irritation (Aaker & Stayman, 1990; Pelsmacker & Van
den Bergh, 1999) and purchase intent (Teixeira et al., 2014).
6 The median duration of videos across our sample of 1650 videos is 5.3 min which is 10 times longer than the commonly used commercial

duration of 30 seconds (W. Friedman, 2017).

 6
Marketing Science Institute Working Paper Series
2016). Hence, influencer video content needs to hold viewer attention for a longer duration so that the
video can reach a larger audience, potentially leading to higher word of mouth and content sharing.
 Third, influencer videos can be interrupted by traditional ads on YouTube. While YouTube only
allows videos that are eight minutes or longer to have mid-roll ads, pre-roll ads can be a part of all
influencer videos (Google, 2020c). As advertising is the primary source of revenue for influencers
(Zimmerman, 2016), it is common for influencers to enable advertising on their videos, making it likely
for viewers to see traditional-ad-interrupted influencer videos. Given that viewers are exposed to both
influencer conveyed advertising and brand conveyed (traditional) advertising during the same viewing
experience, the cognitive processing of information conveyed from each source can be quite different.
 In addition to the above differences, influencer videos are also perceived to have higher source
credibility (Tabor, 2020). Information about the brand is conveyed by an individual with high credibility
and expertise in a related subject area, e.g., review of a beauty product coming from an influencer who
has demonstrated expertise in the beauty industry.

3.2 Video Sample
We focus on 120 influencers identified by Forbes in February 20177 (O'Connor, 2017b). These
influencers obtain revenue from brand endorsements and post mostly in English across Facebook,
YouTube, Instagram and Twitter. They span 12 product categories8 (10 influencers in each). We exclude
the influencers in the Kids category as YouTube has disabled comments on most videos featuring
children. Out of the remaining 110 influencers, we exclude influencers who do not have a YouTube
channel. We also use the industry threshold of 1000 followers for a person to be classified an influencer
(Maheshwari, 2018) and also exclude one atypical influencer with more than 100M followers.
Furthermore, we short-list those influencers who have at least 50 videos so that we can capture sufficient
variation in their activity, which leaves us with a pool of 73 influencers. From this pool, we randomly
choose 3 influencers per category, which gives a total of 33 influencers9 and a master list of 32,246
videos, whose title and posting time were scraped using the YouTube Data API v3 in October 2019. In
addition, we also record the subscriber count for each channel at the time of scraping. From this pool of
33 influencers, we randomly choose 50 public videos for each influencer so that we have a balanced
sample of 1650 videos that is feasible to analyze. Excluding videos in which either likes, dislikes or

7 The criteria used by Forbes to identify these influencers include total reach, propensity for virality, level of engagement, endorsements, and
related offline business.
8 The 12 product categories are Beauty, Entertainment, Fashion, Fitness, Food, Gaming, Home, Kids, Parenting, Pets, Tech & Business, and
Travel.
9 Three of the randomly chosen influencers had comments disabled on more than 95% of their videos, and hence three other random influencers

were chosen in their place from the respective category.

 7
Marketing Science Institute Working Paper Series
comments were disabled by the influencer(s) leaves us with 1620 videos (all scraped in November 2019).
Table 1 shows the specific data scraped.
 Number of views (from time of posting to time of scraping)
 Number of comments (from time of posting to time of scraping)
 Metrics
 Number of likes (from time of posting to time of scraping)
 Number of dislikes (from time of posting to time of scraping)
 Structured Length Video Length (min)
 Data Tags Tags associated with each video (see Google (2020a) for details)
 Number of playlists the video is a part of
 Playlist Position of video in each playlist
 Number of videos on all the playlists the video is a part of
 Time Time of posting video
 Title
 Description
 Text
 Captions (if present)
 Unstructured
 Comments (Top 25 as per YouTube’s proprietary algorithm) with replies
 Data
 Audio Audio file
 Thumbnail
 Images
 Video file

 Table 1: Scraped data for videos

3.3 Outcome Variables
The top three ways of measuring influencer marketing success in the industry are conversions, interaction
rates and impressions (Influencer Marketing Hub and CreatorIQ, 2020). Unfortunately, conversion data
are not publicly available. We capture the remaining two (sets of) variables and in addition also capture
sentiment.

(1) Impressions (Views)
Views are important not only to brands, but also to influencers. Higher views help brands increase
exposure levels of their influencer marketing campaign, and help influencers earn more revenue equal to a
55% share of ad CPM10 on YouTube (Rosenberg, 2018). Furthermore, an increase in views is correlated
with an increase in channel subscribers,11 and higher subscriber count allows the influencer to earn higher
CPM rates (Influencer Marketing Hub, 2018) as well as to ex-ante charge higher for a brand collaboration
(Klear, 2019; O'Connor, 2017a).

10Median ad CPM rates on YouTube are $9.88, and form the primary source of revenue for YouTube influencers (Lambert, 2018; Zimmerman,
2016)
11Total views for all videos of an influencer channel are highly correlated with subscriber count for the channel across the 33 influencers in our
sample, = 0.91.

 8
Marketing Science Institute Working Paper Series
There are a few different ways in which public view counts are incremented on YouTube. First,
watching a complete pre-roll ad that is 11 to 30 seconds long OR watching at least 30 seconds of a pre-
roll ad that is longer than 30 seconds OR interacting with a pre-roll ad (Google, 2020b). Second, if a pre-
roll ad is skipped OR there is no pre-roll ad OR the complete pre-roll ad is smaller than 11 seconds, then
watching at least 30 seconds of the video (or the full video if it has a shorter duration) has been
historically documented to be the minimum requirement for public view counts to increase (Parsons,
2017).
 On average, only 15% of viewers have been typically found to watch 30 seconds of a YouTube
pre-roll ad (Influencer Marketing Hub, 2018). Hence, it is likely that most view counts are incremented
because of viewing the first 30 seconds of video content. As views are exponentially distributed, we show
the distribution of the log of views across our sample of 1620 videos in Figure 1. The distribution is
approximately normal and ranges from 3.71 to 17.57 with a median of 11.85 (or 140,000 views).

 Figure 1 – Distribution of log view count

(2) Interaction Rates
Brands care more about interaction rates than views to not only ex-ante decide on a collaboration but also
to ex-post measure campaign success (Influencer Marketing Hub and CreatorIQ, 2020). Hence, in
addition to using impressions (views) as an outcome of interest, we develop three measures of interaction
rates that are captured in publicly available data: (a) engagement = (# comments / # views), (b) popularity
= (# likes / # views), and (c) likeability = (# likes / # dislikes). While measuring number of comments and
likes is common practice in industry and academia (Dawley, 2017; Hughes et al., 2019), we scale each
measure by (number of) views to develop unique measures that are not highly correlated with views,12 and
hence can be used to compare interaction rates for videos with different levels of views. The third metric,

12Across 1620 videos spanning 33 influencers, there is a high correlation between log views and log (comments+1) at 0.91, between log views
and log (likes+1) at 0.95 and between log views and log (dislikes+1) at 0.92 (we add 1 to avoid computation of log(0)).

 9
Marketing Science Institute Working Paper Series
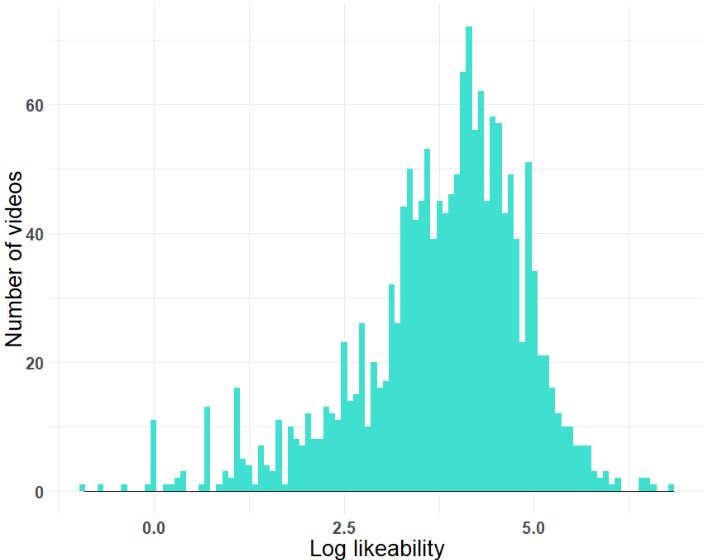
(# likes / # dislikes), is unique to YouTube because YouTube is the only major influencer platform in the
US which publicly displays number of dislikes to the content.13 As the three interaction rates are also
exponentially distributed, we take their natural log, and add 1 to avoid computation of log(0) or log(∞):
 comments+1 likes+1
(a) log engagement = log ( views
 ), (b) log popularity = log ( views ), and (c) log likeability = log
 likes+1
(dislikes+1). The distribution of the log of the interaction rates for the 1620 videos is shown in Figure 2a,

2b and 2c. The distribution of all three interaction rates is approximately normal. Log engagement has a
median of – 6.21 (or 19 comments per 10K views), log popularity has a median of – 3.81 (or 220 likes per
10K views) while log likeability has a median of 3.99 (or approximately 54 likes per dislike).

 Figure 2a – Distribution of Log Engagement Figure 2b – Distribution of Log Popularity

 Figure 2c – Distribution of Log Likeability

13 Other influencer platforms either do not allow dislikes to content or only allow content to be marked as ‘not interesting’ which is not publicly
displayed.

 10
Marketing Science Institute Working Paper Series
(3) Sentiment
Past work has found that the visual and verbal components of advertising can have an effect on attitude
towards the ad which in turn can have a direct effect on overall brand attitude, including attitude towards
purchasing and using the product (Mitchell, 1986). Hence, it is likely that brands would benefit from
understanding viewer attitude towards the video as it acts as a proxy for sales. We capture attitude
towards a video by measuring the average sentiment expressed in the Top 25 comments below a video
using Google’s Natural Language API. Comments below a YouTube video are by default sorted as ‘Top
comments’ and not ‘Newest first,’ using YouTube’s proprietary ranking algorithm.14 Note that we do not
measure the sentiment in the replies to each of the Top 25 comments because sentiment expressed in the
reply is likely to be sentiment towards the comment and not sentiment towards the video.
 The Natural Language API by Google is pre-trained on a large document corpus, supports 10
languages, and is known to perform well in sentiment analysis on textual data (including emojis) in
general use cases (Hopf, 2020). For comments made in a language not supported by the API, we use the
Google Translation API to first translate the comment to English, and then find its sentiment. The
sentiment provided is a score from −1 to +1 (with increments of 0.1), where −1 is very negative, 0 is
neutral and +1 is very positive. We calculate the sentiment of each comment below a video for a
maximum of Top 25 comments, and then find the average sentiment score.15
 The distribution of sentiment scores for the 1620 videos is shown in Figure 3. It ranges from −0.9
to 0.9 with a median of 0.34, which we use as a cut-off to divide sentiment in the videos into two buckets
– “positive” and “not positive (neutral or negative).” The large peak at 0 is because of 71 videos where
viewers do not post any comments (even though comment posting has not been disabled by the
influencer). We assume that if viewers choose to not post comments below a video, then the sentiment
towards the video is neutral (0).

14 Higher ranked comments (lower magnitude) have been empirically observed to be positively correlated with like/dislike ratio of comment,
like/dislike ratio of commenter, number of replies to the comment and time since comment was posted (Dixon & Baig, 2019). Moreover, a
tabulation shows that 99% of comments are made by viewers and not the influencer (who owns the channel) and hence we do not separate the two.
15 As a robustness check, we use Top 50 and Top 100 comments for a random sample of 66 videos (2 videos per influencer) and also explore use
of progressively decreasing weights instead of a simple average. We find that the sentiment calculated using any of these measures is highly
correlated with a simple average of Top 25 comments ( ≥ 0.88).

 11
Marketing Science Institute Working Paper Series
Figure 3 – Distribution of average sentiment score across Top 25 comments

 Hence, we have a total of four continuous outcomes and one binary outcome. We find that the
Pearson correlation coefficient between all outcomes ranges from 0.02 to 0.66 with a median of 0.20
(absolute value) as shown in Table 2, indicating that each measure potentially captures different
underlying constructs.

 Log Log Log Binary
 Log likeability
 views engagement popularity Sentiment
 Log views 1
 Log engagement 0.04 1
 Log popularity 0.20 0.66 1
 Log likeability 0.43 0.14 0.57 1
 Sentiment (binary) −0.21 −0.15 0.02 0.15 1

 Table 2: Correlation between outcomes

3.4 Features
Next, we generate features from the data scraped in Table 1 and list them in Table 3. As can be seen from
the table, we have 33 fixed effects for channel, 11 fixed effects for category, features for video length,
tags and playlist information, six time-based-covariates and an indicator variable for whether captions are
available for the video. For the video description, a maximum of 160 characters are visible in Google
Search and even fewer characters are visible below a YouTube video before the ‘Show More’ link
(Cournoyer, 2014). Hence, we truncate each description to the first 160 characters as it is more likely to
contribute to any potential association with our outcome variables. Captions are only present in 74% of

 12
Marketing Science Institute Working Paper Series
videos, and for those videos without a caption, we use Google’s Cloud Speech-to-Text Video
Transcribing API to transcribe the first 30 seconds of the audio file to English.16

 Type Class Features
 Fixed Effects Influencer Fixed Effects (33)
 Fixed Effects Category Fixed Effects (11)
 Length Video Length (min)
 Tags Number of video tags
 Number of playlists the video is a part of
 Playlist Average position in playlist
 Information
 Average number of videos on all the playlists the video is a part of
 Structured Time between upload: Upload time and scrape time
 Features Year of upload (2006 to 2019)
 Time between upload: Given video and preceding video in master list
 Time based
 covariates Time between upload: Given video and succeeding video in master list
 Rank of video in master list
 Day fixed effects in EST (7) and
 Time of day fixed effects in intervals of 4 hours from 00:00 hours EST (6)
 Captions
 Indicator of whether video has closed captions
 Indicator
 Title
 Text Description (first 160 characters)
 Unstructured Captions or Transcript (first 30 sec)
 features Audio Audio file (first 30 sec)
 Thumbnail
 Images
 Image frame at 0 sec (first frame), 7.5 sec, 15 sec, 22.5 sec, 30 sec
 Structured Complete Total number of URLs in description
 features Description Indicator of Hashtag in description

 Table 3: Video features - structured and unstructured

 We begin by focusing on the first 30 seconds for two reasons.17 First, the minimum duration of
video content that needs to be viewed for an impression to be registered is 30 seconds, and second, higher
computational costs associated with more data in our deep learning models require us to restrict data size
to a feasible amount. Similarly, we restrict the duration of the audio file to the first 30 seconds. We use
audio data in addition to captions/transcript to analyze the presence of other sound elements such as music

16
 While most videos have English speech, if the first 30 seconds of audio have only non-English speech or there is only background
music/sound, the transcription process results in an empty file. 65% of the 26% of videos that are transcribed result in an empty file.
17 Note that as part of our robustness checks, we contrast our approach with the use of data from the middle 30 sec and last 30 sec of the video
(see Section 5.4).

 13
Marketing Science Institute Working Paper Series
and animal sounds. Image data comprise high-resolution images that are 270 pixels high and 480 pixels
wide. These images comprise the thumbnail and video frames at 0 sec (first frame), 7.5 sec, 15 sec, 22.5
sec and 30 sec.18 We restrict our analysis to the first 30 seconds of the video to be consistent with our
analysis of text and audio data, and we consider a maximum of five frames in the first 30 seconds because
of computational constraints of GPU memory that can be achieved at a low cost.
 We create two additional structured features from the complete description to use for analysis as
the complete description is not supplied to the Text model. These features are included as they can lead
the viewer away from the video. They comprise total number of URLs in description and an indicator for
hashtag in description. The first three hashtags used in the description appear above the title of the video
(if there are no hashtags in the title), and clicking on it can lead the viewer away from the video to another
page that shows similar videos (Google, 2020e).19

3.5 Brand Usage

We compile a list of popular global brands and a comprehensive list of brands with offices in USA. Three
lists of Top 100 Global brands in 2019 are obtained from BrandZ, Fortune100 and Interbrand. To this, we
add a list of more than 32,000 brands (with US offices) from the Winmo database. This is further
combined with brand names identified by applying Google’s Vision API - Brand Logo Detection on
thumbnails and video frames (0s, 7.5s, 15s, 22.5s & 30s) in our sample of 1620 videos. From this
combined list, we remove more than 800 generic brand names such as ‘slices,’ ‘basic,’ ‘promise,’ etc. that
are likely to be used in non-brand related contexts. Using regular expressions, we identify a list of 250
unique brands that are used in different text elements of a video: video title, video description (first 160
characters) and video captions/transcript (first 30 sec). The Logo detection API provides a list of 51
unique brands that are used in image elements of the video – thumbnails and video frames. The
percentage of videos that have a brand used in each video element is as follows: title – 11.2%, description
(first 160 characters) – 36.8%, captions/transcript (first 30 sec) – 17.2%, thumbnails – 1.1% and video
frames (across five frames in first 30sec) – 2.6%.20 The distribution of the number of brand mentions in
each text element is shown in Figure 4a, and the number of brand logos in each image element is shown
in Figure 4b.

18 As each video can be recorded at a different frame rate or with variable framing rates, we capture the frame equal to or exactly after the
specified time point. For example, a video recorded at a fixed rate of 15 frames/sec will have a frame at 7.46 sec and 7.53 sec but not 7.50 sec - so
we record the frame at 7.53 sec in place of 7.50 sec.
19 We do not have information on how often a video was recommended to viewers by the YouTube recommendation algorithm. We discuss the
potential impact of not observing this feature in Section 5.2.4.
20 We do not study brand usage in the Top 25 comments below a video as an outcome variable because only about 5% of the comments across all

1620 videos have a brand mentioned.

 14
Marketing Science Institute Working Paper Series
Figure 4a: Distribution of number of brand mentions in text Figure 4b: Distribution of number of brand logos in images

 We find that brand mentions are most common in the description (first 160 characters), followed
by captions/transcript (first 30 sec), and then video title. Moreover, all text elements typically have only
one brand mentioned once; the observations where two or more brands are mentioned include cases of the
same or a different brand being mentioned again. Similarly, thumbnails and video frames (five equally
spaced frames in the first 30 sec) typically have only one brand logo, but they comprise a very small
percentage of the total videos in our sample. Overall, we find that our sample of influencers allows us to
capture sufficient advertising information in textual data.
 Furthermore, the US Federal Trade Commission (FTC) has three main guidelines for influencers.
First, influencers need to disclose information about brand sponsorship in the video itself and not just in
the description of the video. Second, they are advised to use words such as “ad,” “advertisement,”
“sponsored” or “thanks to ‘Acme’ brand for the free product” to indicate a brand partnership. Third, it is
recommended that they disclose brand partnerships at the beginning than at the end of a video (FTC,
2020). Hence, we check for presence of the words “ad/s,” “advertisement/s,” “sponsor/s” or “sponsored”
in the captions/transcript (first 30 sec). 21 We find that less than 1% of videos make such a disclosure in
the first 30 seconds.22

21We do not check for the presence of words such as “free” because they are often used in other contexts such as “feel free,” “gluten free,” etc.
22YouTube also has guidelines for influencers. It requires all channel owners to check a box in video settings that says ‘video contains paid
promotion’ if their video is sponsored (Google, 2020d). If this box is checked, a tag – “Includes Paid Promotion” is overlaid on a corner of the
video for the first few seconds when the video is played on YouTube. While information about the presence of this “tag” cannot be scraped or
downloaded with the video to the best of our knowledge, manually checking different videos on YouTube in our sample reveals that there is little
compliance to this requirement.

 15
Marketing Science Institute Working Paper Series
4. Model
Deep learning models are especially suited to analyze unstructured data (text, audio and images) as they
can efficiently capture complex non-linear relationships and perform well in prediction tasks (Dzyabura
& Yoganarasimhan, 2018). Figure 5a shows the traditional deep learning approach that uses unstructured
data (e.g., images from videos) to predict an outcome variable. Features self-generated by deep learning
models are known to have better predictive ability than ex-ante hand-crafted features passed to deep
learning models (Dzyabura et al., 2018; L. Liu et al., 2018; X. Liu et al., 2019). This is because ex-ante
feature engineering is unable to neither identify a comprehensive set of important features nor capture all
the underlying latent constructs. However, hand-crafted features allow interpretability of the captured
relationships which is not possible with self-generated features created by traditional deep learning
models.
 In Figure 5b, we show our “interpretable deep learning” approach that avoids ex-ante feature
engineering and instead uses ex-post interpretation to allow for both good predictive ability of outcomes
and interpretation of the captured relationships. To prevent the model from overfitting when analyzing a
moderate sized dataset, we use transfer learning approaches where a model that is pre-trained on a
separate task with large amounts of data (at a high cost) can be fine-tuned for our different but related
task. This not only helps prevent overfitting but also aids in interpretation of the captured relationships.
We use state-of-the-art model architectures with novel customizations that allow visualization of the
captured relationships. Next, we describe each of the deep (transfer) learning models in more detail.

 Figure 5a: Traditional Deep Learning Approach

 Figure 5b: Interpretable Deep Learning Approach

 16
Marketing Science Institute Working Paper Series
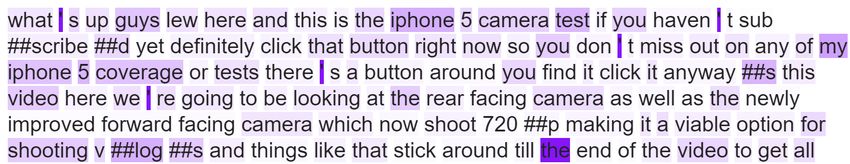
4.1 Text Model
Text data are analyzed using Bidirectional Encoder Representation from Transformers (BERT) (Devlin et
al., 2018), a state-of-the-art NLP model that borrows the Encoder representation from the Transformer
framework (Vaswani et al., 2017). The model is pre-trained using Book Corpus data (800M words) and
English Wikipedia (2,500M words) to predict masked words in text and the next sentence following a
sentence. Devlin et al. (2018) complete the pre-training procedure in four days using four cloud Tensor
Processing Units (TPUs). The BERT model is fine-tuned to capture the association with our five
outcomes using the framework shown in Figure 6.
 The model converts a sentence into word-piece tokens23 as done by state-of-the-art machine
translation models (Wu et al., 2016). Furthermore, the beginning of each sentence is appended by the
‘CLS’ (classification) token and the end of each sentence is appended by the ‘SEP’ (separation token).
For example, the sentence ‘Good Morning! I am a YouTuber.’ will be converted into the tokens [‘[CLS]’,
‘good’, ‘morning’, ‘!’, ‘i’, ‘am’, ’a’, ‘youtube’, ‘##r’, ‘.’, ‘[SEP]’]. A 768-dimensional initial embedding
learnt for each token during the pre-training phase is passed as input to the model, and is represented by
the vector in Figure 6, where m is the number of tokens in the longest sentence24. The token
embedding is combined with a positional encoder that codes the position of the token in the sentence
using sine and cosine functions (see Devlin et al. (2018) for details). This is passed through a set of 12
encoders arranged sequentially. The output of the ‘CLS’ token is passed through a feed forward layer that
is initialized with pre-trained weights from the next sentence prediction task, and has a tanh activation
 − −
function, i.e. tanh( ) = + − . This is followed by the output layer, which has a linear activation

function, i.e. ( ) = , for the four continuous outcomes and a sigmoid activation function, i.e.

 ( ) = 1+ , for the binary outcome sentiment.

23 We use the BERT-base-uncased model (that converts all words to lower case and removes accent markers) as compared to the cased model,
because the uncased model is known to typically perform better unless the goal is to study case specific contexts such as ‘named entity
recognition’ and ‘part-of-speech tagging’.
24 Rare characters including emojis are assigned an ‘UNK’ (unknown) token and sentences shorter than the longest sentence are padded to the

maximum length by a common vector.

 17
Marketing Science Institute Working Paper Series
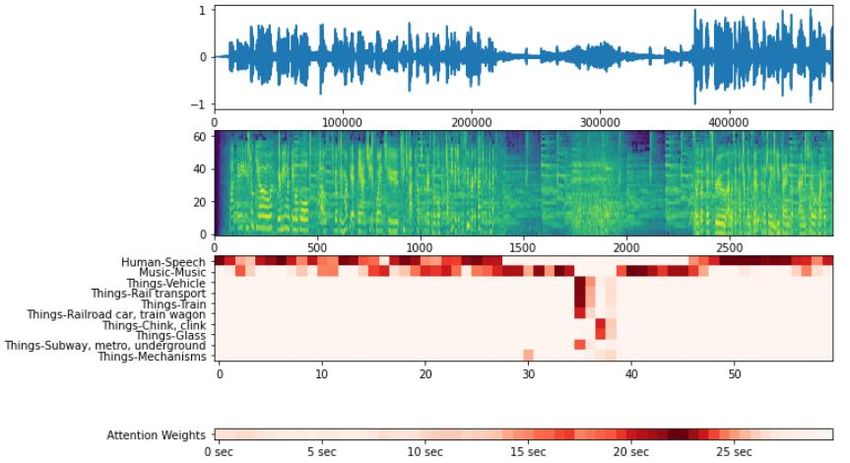
Figure 6: BERT Model Framework

 In Appendix A, we explain the architecture of the Encoders which also contain the self-attention
heads. The self-attention heads help the model capture the relative importance between word-pieces while
forming an association with the outcome of interest. The three main advantages of BERT over
conventional deep learning frameworks such as (Bidirectional) LSTM, CNN and CNN-LSTM that use
word embeddings such as Glove and word2vec are as follows: (1) BERT learns contextual token
embeddings (e.g., the embedding for the word ‘bark’ will change based on the context in which it used,
such that the model can understand whether the word is referring to a dog’s bark or a tree’s outer layer)
(2) The entire BERT model with hierarchical representations is pre-trained on masked words and a next
sentence prediction task, thus making it suitable for transfer learning; whereas the conventional models
only initialize the first layer with a word embedding (3) BERT uses a self-attention mechanism that
allows the model to simultaneously (non-directionally) focus on all words in a text instead of using a
sequential process that can lead to loss of information. These advantages are reflected in model
performance when we compare it with conventional models (combinations of CNN and LSTM) in
Section 5.1.

4.2 Audio Model
Audio data are analyzed using the state-of-the-art YAMNet model followed by a Bidirectional LSTM (Bi-
LSTM) model with an attention mechanism, as shown in Figure 7. YAMNet takes the Mel-frequency
spectrogram of the audio signal as input and passes it through a MobileNet v1 (version 1) model that is
pre-trained on the AudioSet data released by Google (Gemmeke et al., 2017; Pilakal & Ellis, 2020).

 18
Marketing Science Institute Working Paper Series
YAMNet predicts sound labels from 521 audio classes25 such as speech, music, animal, etc. corresponding
to each 960ms segment of the audio file. The features from the last layer of the model, corresponding to
the predicted audio classes, are passed through a Bi-LSTM layer with an attention mechanism to capture
the sequential structure of sound. The model is then fine-tuned to capture associations with our five
outcomes.

 Figure 7: Audio Model

 Next, we explain the model framework in more detail. As mentioned earlier in Section 2, we
analyze the first 30 seconds of audio in each video file. Each 30 second audio clip is resampled at 16,000
Hz and mono sound, which results in 480,000 data points for each clip. To summarize the large number
of data points, we generate a spectrogram that spans the frequency range of 125 to 7500Hz (note that the
2000-5000 Hz range is most sensitive to human hearing (Widex, 2016)) over which the YAMNet model
has been pre-trained. This frequency range is then divided into 64 equally spaced Mel bins on the log
scale, such that the sounds of equal distance on the scale also sound equally spaced to the human ear.26
Each segment of 960ms from the spectrogram output, i.e., 96 frames of 10ms each with overlapping
patches (that have a hop size of 490ms) to avoid losing information at the edges of each patch is passed as
input to the MobileNet v1 architecture. The MobileNet v1 (explained in more detail in Appendix B)
processes the spectrogram through multiple mobile convolutions which results in 521 audio class
predictions across 60 moments (time steps) in the clip. The dimensional vector is then passed
as input to the Bi-Directional LSTM layer with an attention mechanism (explained in more detail in
Appendix B). This layer is made Bidirectional to allow it to capture the interdependence between

25 The AudioSet data has more than 2 million human-labelled 10 sec YouTube video soundtracks (Gemmeke et al., 2017). Pilakal and Ellis (2020)
remove 6 audio classes (viz. gendered versions of speech and singing; battle cry; and funny music) from the original set of 527 audio classes to
avoid potentially offensive mislabeling. YAMNet has a mean average precision of 0.306.
26 The spectrogram uses the pre-trained Short-Term Fourier Transform window length of 25ms with a hop size of 10ms that results in a 2998 x 64

(time steps x frequency) vector corresponding to 30 seconds of each audio clip.

 19
Marketing Science Institute Working Paper Series
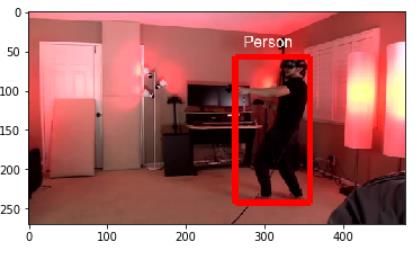
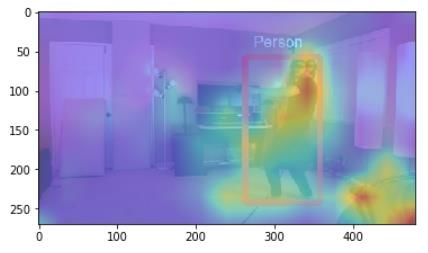
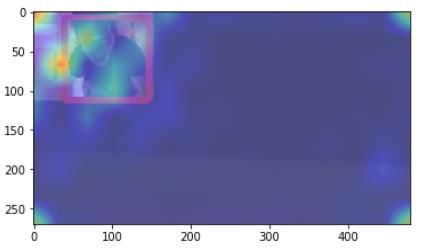
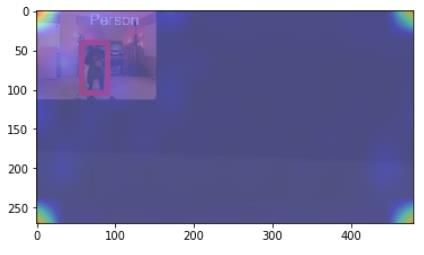
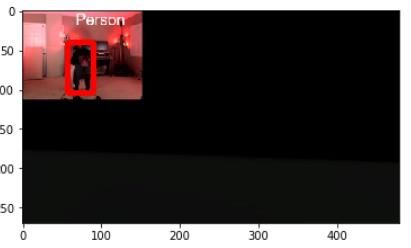
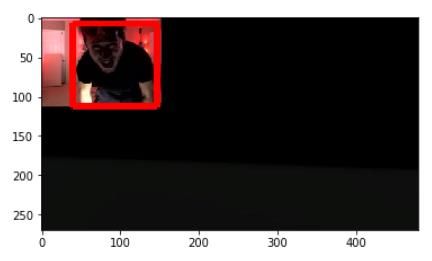
sequential audio segments from both directions. For example, the interdependence between the sound of a
musical instrument at 5 seconds and the beginning of human speech at 15 seconds can be captured by the
model bidirectionally. We adopt the attention mechanism used for neural machine translation by
Bahdanau et al. (2014) to help the Bi-LSTM model capture the relative importance between sound
moments in order to form an association with an outcome of interest. The output of the Bi-LSTM with
attention mechanism is passed through an output layer which has linear activations for the continuous
outcome and sigmoid activation for the binary outcome. We compare the performance of this model
framework (Model 3) with a model devoid of the attention mechanism (Model 2) and a model devoid of
both the attention mechanism and MobileNet v1 (Model 1), in Section 5.1.

4.3 Image Model
Individual images are analyzed using the state-of-the-art image model – EfficientNet-B7 (Tan & Le,
2019) that has been pre-trained with “noisy student weights”27 (Xie et al., 2019). This model not only has
a high Top-5 accuracy on ImageNet (98.1%) but is also known to better capture salient regions of images
as it uses compound scaling. It is also a relatively efficient model that uses only 66M parameters (and
hence the name EfficientNet) as compared to other high performing models that use 8x times the number
of parameters (Atlas ML, 2020). All our images (frames) are at a high resolution of 270 by 480 pixels
which is the largest common resolution size available across all thumbnails and video frames in the
dataset. Thumbnail images are passed as input to one EfficientNet-B7, and its final layers are fine-tuned
to capture relationships with an outcome. The architecture of the EfficientNet-B7, whose main building
block is the Mobile Inverted Bottleneck Convolution, is explained in detail in Appendix C. We compare
the performance of the (pre-trained) EfficientNet-B7 with a 4-layer CNN model in Section 5.1.
 As mentioned in Section 3, we analyze a maximum of five video frames in the first 30 seconds of
each video, i.e., frames at 0s (first frame), 7.5s, 15s, 22.5s and 30s. Each image frame = 1 to , where
 has a maximum value of 5, is passed through an EfficientNet-B7 model, and then the outputs from all
the models are combined before passing it through an output layer. This is illustrated using the diagram in
Figure 8.

27 Xie et al. (2019) learn these weights by first pre-training the model on more than 1.2M labelled images from the ImageNet dataset
(Russakovsky et al., 2015), and then use this trained model as a teacher to predict labels for a student model with 300M unlabeled images from
the JFT Dataset (Xie et al., 2019). The two models are then combined to train a larger student model which is injected with noise (e.g., dropout,
stochastic depth and data augmentation), and is then used as a teacher to predict labels for the original student model. This process is then iterated
a few times to produce the EfficientNet-B7 model with pre-trained weights.

 20
Marketing Science Institute Working Paper Series
Figure 8: Image Model (Video Frames)

 We compare the performance of four different ‘combination architectures’ that combine the
outputs from each EfficientNet-B7. Two of the architectures are the best performing ones in Yue-Hei Ng
et al. (2015), namely Bi-LSTM28 and Max Pooling followed by Global Average Pooling (Max-GAP). The
remaining two architectures are variants not tested by Yue-Hei Ng et al. (2015), namely Global Average
Pooling followed by Max Pooling (GAP-Max) and Concatenation of Global Average Pooling (C-GAP).
The Bi-LSTM architecture captures sequential information across the video frames, while the remaining
three architectures preserve the spatial information across the video frames. The output of the
combination architecture is passed through an output layer which has linear activations for the continuous
outcome and softmax activation for the binary outcome. We explain the combination architectures in
more detail in Appendix C.

4.4 Combined Model
We use the framework shown in Figure 9 to combine information from each of the unstructured models
with the structured features, , listed earlier in Table 3. The predicted outcome values, ̂ for video by
influencer , from the best performing model for each unstructured feature, are fed into the combined
model in addition to the structured features, . This can also be represented by the following equation:

 = ( , ̂ , ̂ , ̂ / , ̂ , ̂ ℎ , ̂ ) + (1)

where is the observed outcome for video by influencer , is the combined model used and is the
error term. We test the performance of seven different combined models in Section 5.1. The combined

28 While Yue-Hei Ng et al. (2015) use the LSTM approach, we use the Bidirectional LSTM (Bi-LSTM) as it can only perform better than LSTM.

 21
Marketing Science Institute Working Paper Series
models comprise four commonly used linear models – OLS29, Ridge Regression, LASSO and Elastic Net,
and three non-linear models – Deep Neural Net, Random Forests and Extreme Gradient Boosting
(XGBoost) – that are known to capture non-linear relationships well.

 Figure 9: Combined Model

5. Results
In this section, we first detail the results on prediction and then on interpretation. We then dig deeper to
see if we find patterns consistent with influencers “learning” about what makes their videos more
engaging. We also carry out a robustness check where we estimate our model on video slices from the
middle and end of videos as opposed to the beginning.

5.1 Prediction Results
We divide our random sample of 1620 videos into a 60% training sample (972 videos), 20% validation
sample (324 videos) and 20% holdout sample (324 videos). We train the model on the training sample,
tune the number of steps of Adam gradient descent on the validation sample, and then compute model

29We drop the multicollinear category fixed effects in OLS. We retain these fixed effects in the other models so that we can capture their relative
importance with influencer fixed effects.

 22
Marketing Science Institute Working Paper Series
performance on the holdout sample.30 First, we compare the predictive performance of each model with
benchmarks models for the continuous outcome (views) and binary outcome (sentiment), and then apply
the best performing model on the other three continuous outcomes (interaction rates).31 In Appendix D,
we compare our models with various benchmarks used in marketing literature. The Text model (BERT)
performs better than benchmarks such as LSTM, CNN (X. Liu et al., 2019), CNN-LSTM (Chakraborty et
al., 2019) and CNN-Bi-LSTM. The Audio model (YAMNet+Bi-LSTM+Attention) performs better than
benchmark models devoid of the attention mechanism, thus demonstrating the benefit of capturing
relative attention weights. The Image model (EfficientNet-B7) performs better than a conventional 4-
layer CNN. Furthermore, the Bi-LSTM architecture which captures the sequential information from video
frames performs better than other models that capture only spatial information.32 Overall, we demonstrate
that our models perform better than benchmark predictive models in the marketing literature and thus we
do not compromise on predictive ability.
 Table 4 summarizes the results from the best performing models for each component of
unstructured data, which are now applied to all five outcomes. The Text model (BERT) predicts all the
continuous outcomes with a low RMSE, (e.g., Title can be used to predict views within an average RMSE
range of ± 1.66 = ± 5.26 views) and the binary outcome with moderately high accuracy (e.g., Title can
predict sentiment with an accuracy of 72%). The Audio model can make predictions at a slightly poorer
level of performance than the Text model. The Thumbnail model is unable to predict the continuous
outcomes as well as the Text and Audio Model but performs better than the Audio model in predicting
sentiment. The Video Frames model performs better than the Thumbnail model but poorer than Audio
and Text models in predicting the continuous outcomes but performs comparably with the Thumbnail
model in predicting sentiment. Overall, the prediction results show low RMSE that ranges from 0.71 to
3.09 when predicting the (log transformed) continuous outcomes (views, engagement, popularity and
likeability) and moderately high accuracies ranging from 65% to 72% when predicting sentiment.

30 We carry out our analysis using one NVIDIA Tesla P100 GPU (with 16GB RAM) from Google.
31 We do not use a Multi-Task Learning (MTL) approach to simultaneously predict all five outcomes for two reasons. First, our final goal is to
interpret the relationship between each individual outcome and video data (detailed in Section 5.2), which will not be possible with a MTL approach.
Second, there is low to moderate correlation between all five outcomes as shown earlier in Table 2, which suggests that each outcome is capturing
different underlying constructs.
32 We also find that using five frames results in slightly improved performance than a model that uses only three or two frames.

 23
Marketing Science Institute Working Paper Series
You can also read