Vision 2025 The Rhineland Ecosystem: A study by Startup Genome On behalf of the Ministry of Economic Affairs, Innovation, Digitalization and ...
←
→
Page content transcription
If your browser does not render page correctly, please read the page content below
The Rhineland Ecosystem:
           Vision 2025

A study by Startup Genome
On behalf of the Ministry of Economic
Affairs, Innovation, Digitalization and
Energy of the State of North Rhine-
Westphalia
Table of Contents

Table of Exhibits........................................................................................................................................................ 2
1. Executive Summary ............................................................................................................................................. 4

2. Methodology - Presentation and Overview................................................................................................... 5

3. Vision 2025 - Scenarios to accelerate Rhineland....................................................................................... 12

4. Scaling ................................................................................................................................................................... 19

    4.1 Need for an Elite Scaling Program .......................................................................................................... 30
        4.1.1 Mentorship - Building Bench Strength ........................................................................................... 36

        4.1.2 Soft Landing .......................................................................................................................................... 38

    4.2 Attracting Late Stage Capital .................................................................................................................... 39
        4.2.1 The Value of an Elite Brand ............................................................................................................... 39

        4.2.2 Creative Financial instruments - a Hypothetical Scenario ......................................................... 45
5. Deep Tech Clusters to improve on Startup Output .................................................................................. 47

        5.1 Accelerating University Spin-Offs ........................................................................................................ 49

        5.2 Need for a Keystone team to accelerate Deep Tech Clusters ..................................................... 61
        5.3 Generating Demand ............................................................................................................................... 63

6. Startup Output - Activating the Grass Roots............................................................................................... 67

        6.1 Activating Graduates .............................................................................................................................. 67

        6.2 Activating Experienced Workforce ...................................................................................................... 70

        6.3 Female Entrepreneurship ..................................................................................................................... 72
7. Seed Funding - Addressing the Gap ............................................................................................................. 76

    7.1 Scenario Planning: Capital needed to close the Seed Funding Gap .............................................. 80

    7.2 Need for Business Angels ......................................................................................................................... 82
8. Roadmap .............................................................................................................................................................. 88

9. Budget Outline ................................................................................................................................................... 89

10. Methodology..................................................................................................................................................... 90

    10.1 Data Sources .............................................................................................................................................. 90

    10.2 Key Concepts and Definitions ................................................................................................................ 91
        10.2.1 Key Concepts ...................................................................................................................................... 91

        10.2.2 Glossary ............................................................................................................................................... 93

                                                                                                                                                                              1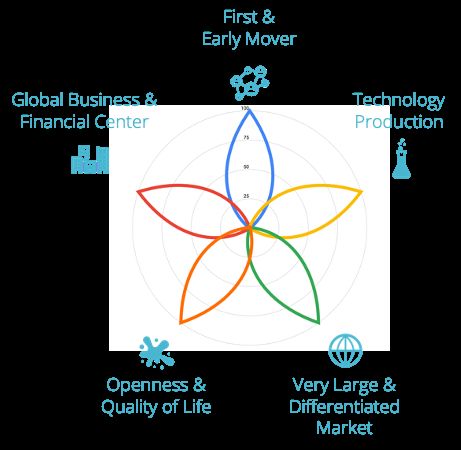
Table of Exhibits
Exhibit 1: Ecosystem Lifecycle Model .................................................................................................................. 7
Exhibit 2: Startup Density ....................................................................................................................................... 8
Exhibit 3: Rate of Startup Output Growth is higher than peers ................................................................... 9
Exhibit 4: Total Ecosystem Exit Value accelerates with ecosystem size.................................................... 10
Exhibit 5: Startup Output Potential in Rhineland ........................................................................................... 14
Exhibit 6: Potential Ecosystem Value ................................................................................................................. 15
Exhibit 7: Startup Output Trajectory .................................................................................................................. 16
Exhibit 8: Scaleup Creation - Globalization Phase + Integration Phase Benchmarks ........................... 20
Exhibit 9: Cumulative number of unicorns per country ............................................................................... 21
Exhibit 10: Causal relationship between large funding rounds and scaleup production .................... 22
Exhibit 11: Funding round funnel with peer and aspirational benchmarks ............................................ 23
Exhibit 12: Correlation between ecosystem size and scaleup creation ................................................... 24
Exhibit 13: Scaleup Success is a system of factors ........................................................................................ 25
Exhibit 14: Founders claiming globally leading products ............................................................................. 26
Exhibit 15: Startups Attacking global market immediately........................................................................... 26
Exhibit 16: Founders with high ambition .......................................................................................................... 27
Exhibit 17: Global connectedness ...................................................................................................................... 28
Exhibit 18: Global market reach ......................................................................................................................... 28
Exhibit 19: Availability of experienced growth talent ..................................................................................... 29
Exhibit 20: Employee Stock Option Plans are almost inexistent ................................................................ 30
Exhibit 21: Elite program sizing and funding requirements under scenario conditions ...................... 32
Exhibit 22: Late stage vs mid stage funding .................................................................................................... 33
Exhibit 23: Late stage funding per startup ....................................................................................................... 40
Exhibit 24: Total late stage capital required & late stage funding gap for Rhineland (2020 - 2025) . 41
Exhibit 25: Knowledge Scores for Rhineland ................................................................................................... 50
Exhibit 26: Lab-to-Startup Performance Scores ............................................................................................. 51
Exhibit 27: Lab-to Startup Performance Scores Life Sciences .................................................................... 51
Exhibit 28: Lab-to-Startup Performance Scores AgTech .............................................................................. 52
Exhibit 29: Lab-to-Startup Performance Scores Cleantech ......................................................................... 52
Exhibit 30: Startup Sub-Sector Life Cycle 2019............................................................................................... 53
Exhibit 31: SG Startup Resilience by Sector, May 2020 ................................................................................ 54

                                                                                                                                                                  2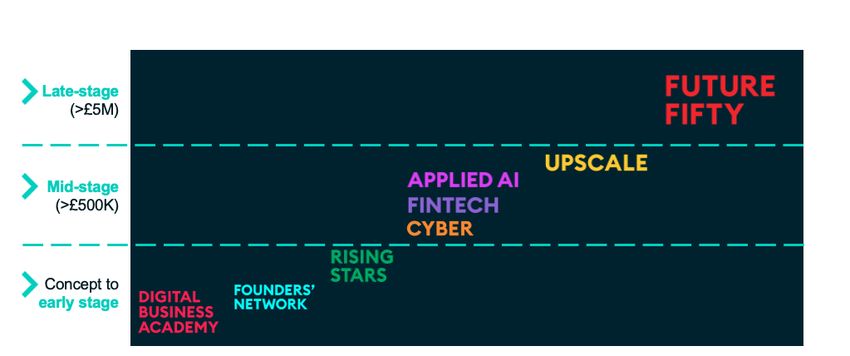
Exhibit 32: Ranking of Ecosystems led by Keystone Teams......................................................................... 61
Exhibit 33: Rhineland’s founders relatively younger compared to the Global average ........................ 71
Exhibit 34: Proportion of founders who are aged 30 and over .................................................................. 71
Exhibit 35: Rhineland below average level for female founders ................................................................ 73
Exhibit 36: Early stage funding Rhineland close to Globalization phase average .................................. 76
Exhibit 37: Seed round size in Rhineland is small than Globalization average ....................................... 77
Exhibit 38: Software engineer salaries relatively low, compensate for smaller seed rounds ............. 78
Exhibit 39: In tandem with cost of talent, seed round sizes in Rhineland are relatively smaller........ 78
Exhibit 40: Not enough startups in Rhineland receive seed rounds ......................................................... 79
Exhibit 41: Investor Relationships ...................................................................................................................... 83

                                                                                                                                                          3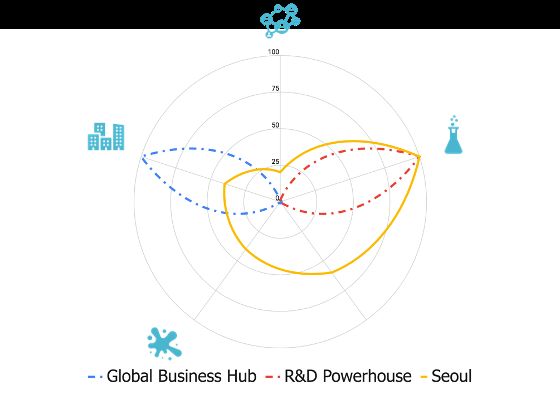
1. Executive Summary

The ecosystem assessment and the current stage of development of Rhineland in the ecosystem
Lifecycle Maturity model strongly suggests three key areas to focus on, starting now and with a time
horizon of 3 – 4 years. These are as follows:

   Scaleup: Accelerate top startups to large scale exits to create a pull effect across the entire
   ecosystem
   Deep Tech: Improve the rate of university spinoffs in Deep Tech
   Startup Output: Significantly increase the number of startups overall to widen the startup funnel

These priorities should be underpinned with supporting measures improving on:
   Mentorship and Global Connectedness
   Late Stage Funding
   University activation and Lab-to-Startup Performance
   Activation of graduates, experienced workforce and Female Entrepreneurship
   Entrepreneurial Skills Development
   Seed Stage Funding and Angel Investment

Following the recommendations of Vision 2025 would position Rhineland as a Top 30 Ecosystem
globally by 2025.

                                                                                                  4
2. Methodology - Presentation and Overview
The following chapter contains a brief summary of project phase I, its results and most important
recommendations for action that follow. The focus is on Rhineland, defined as the metropolitan area
around Aachen, Bonn, Cologne and Düsseldorf1.
In order to further develop and establish Rhineland as a start-up hub, the state ministry
commissioned a comprehensive study consisting of two project phases. The aim of phase I was a
comprehensive evaluation of the local startup ecosystem. For this purpose, data from local startup
founders was collected in an online survey, which 130 founders completed. 43% of the respondents
come from Düsseldorf, 28% from Aachen, 22% from Cologne and 7% from Bonn (percentages
rounded).
Founders answered over 200 questions on the topics of market reach and ambition, connectedness,
startup funding, founder demographics, team and finally sales. The analysis was complemented with
external data sets from Pitchbook, Crunchbase and Dealroom. These provide deeper insights and
historical data through standardized information on financing rounds and exits in the entire
ecosystem.
The study compares results with the average of the respective Peer Group2, a composite of startup
ecosystems in the same phase. In addition to the aggregated average, the specific values for
Copenhagen, Barcelona, Montreal and Melbourne are shown in graphs: these are ecosystems in the
same phase as Rhineland. In addition, the values of Boston and Berlin are displayed, both cities that
are in a further developed phase – and considered aspirational for Rhineland. The direct comparison
reveals the main strengths that can be built on, as well as weaknesses in a region.
In order to complement the analysis from phase I, qualitative interviews were conducted with a
variety of stakeholders within the Rhineland ecosystem. While only founders were interviewed in
Phase I, qualitative discussions covered a range of stakeholders such as investors, policy makers,
academia and what we call Startup Support Organizations: accelerators, coworking spaces and
incubators.
1
At times, the state of North Rhine-Westphalia as a whole is considered for completeness.
2
The associated peer group, i.e. cities in the same development phase for which data is available, are the following: Paris,
Toronto-Waterloo, Sidney, Montreal, Atlanta, Barcelona, Houston, Helsinki, Miami, Jerusalem, Vancouver, Copenhagen and
Melbourne.
5Due to the outbreak of the pandemic covid-19 and the resulting travel restrictions, qualitative
interviews had to be conducted digitally. In March 2020, individual discussions were held with 15
actors.
The discussions yielded the following priorities:
• There is no comprehensive exchange between the cities of the Rhineland, "church tower
thinking" is widespread, which all participants in the conversation regretted
• Startups are often relatively underfunded, mainly due to too small seed rounds for too few
startups
• Government initiatives such as the start-up grant are important and good, but there are no
funding and support programs to take companies to the next level and particularly to assist
them with expanding to international markets
• Companies are locally successful, but struggle in the scaling phase - skills such as "growth
hacking" or the lack of first-class, international mentors were addressed
• Lack of diversity with regard to female founders and female talent in startups
Short Snapshot of the Context of Rhineland
▪ Strongly populated and densely populated: 8.7 million inhabitants in the Rhineland metropolitan
area, around 18 million in North Rhine-Westphalia (NRW)
▪ Polycentric structure with major cities Cologne, Düsseldorf, Bonn, Aachen
▪ Industrial agglomeration: 6 DAX companies3 (and a total of 9 within the State of NRW) and 20 of
the 50 largest private companies in Germany are located in the Rhineland, in addition to 750,000
small and medium-sized companies
▪ Extremely high concentration of science and research: 71 universities in NRW, including 2 elite
universities and 10 clusters of excellence in Rhineland
Lifecycle Analysis: Rhineland in early-Globalization phase
The development of startup ecosystems is a complex and diverse process. Like their analogies from
ecology, they go through different stages, each with different characteristics. The “Ecosystem
Lifecycle” model makes it clear how an ecosystem compares with others and which measures can
be taken most effectively and effectively.
3
Deutsche Telekom, Deutsche Post, Bayer, Metro, Uniper, Ceconomy
6As shown in exhibit 1 below, Startup Genome divides ecosystems into four development phases:
Activation, Globalization, Attraction and Integration. Each phase has very different characteristics
and impulses that enable the ecosystem to develop from one level to the next. The more startups
and resources are in an ecosystem (y-axis) and the more experience (x-axis), the more advanced the
ecosystem is in its development. At the same time, more mature ecosystems have a much higher
rate of exits, as well as coveted unicorns: startups with value / evaluation of over $ 1 billion.
Exhibit 1: Ecosystem Lifecycle Model4
With 900 registered startups, a startup density of 103.45, which describes the number of software
startups per 1 million population, and six 50M$ + exits in the past 10 years, Rhineland is in the early
Globalization phase. This phase is characterized by a still relatively small number of active start-ups.
Relative to its large population, the region underperforms compared with other peers in the
Globalization phase, as the next graph shows.
4
Unless otherwise indicated, all graphs in this report result from Startup Genome research and are proprietary
to Startup Genome.
7Exhibit 2: Startup Density
1000
900
Number of startups per million population
800
700
600
500
400
300
200
Rhineland
100
0
Activation Globalization Attraction Integration
Rhineland is below the curve - there are not enough active start-ups, given the population and
compared to the average of peers (shown in blue in the graphic) in the same phase.
This may partially be explained with a “drain-effect” that occurs when teams leave the region to move
to the capital or abroad to further drive the growth of their companies. The Startup Monitor NRW
2019 describes that almost three quarters of Berlin’s founders completed their studies in another
state, which means that they moved there in order to start a business. In contrast, only 34% of
founders with a degree in NRW completed their studies in another federal state. In this phase, the
main goal of the political decision-makers must not only be to keep local founders in the region, but
also to convince founders from elsewhere of the attractiveness of the Rhineland region.
At the same time, the number of start-ups in Rhineland is growing relatively faster than that of the
comparison group (e.g. Copenhagen and Montreal), which could be an indication that particular
political initiatives at universities and support for young “Would be” founders are bearing fruit.
8Exhibit 3: Rate of Startup Output Growth is higher than peers
10
9
8
Startup Output Growth Index
Globalization Average
7
6
5
4
3
2
1
0
Berlin Barcelona Copenhagen Rhineland Montreal Melbourne Boston
Value creation is an exponential process
In 2008, one out of the top ten largest companies in the world was in tech. Today, it is seven out of
ten. The sector went from a small part of the global value chain to the major economic powerhouse
of the world. Similarly, the global startup economy continues to grow, generating $2.8 trillion in value
from 2016-2018 and growing over 20% when compared to the previous period.5
Despite all of the value being created globally, Rhineland is not capturing its fair share of the world’s
fastest growing value creation engine, neither internationally nor in direct comparison with the best
of other German States. In the following, we shortly outline the theoretic concept of value creation
in startup ecosystems. Then, we show 2 scenarios within a 5-year vision for Rhineland, dubbed Vision
2025, and quantify the enormous untapped opportunities of a larger ecosystem with more
successful startups and scaleups.
Startup ecosystems create direct value by means of high value job creation and tax revenue. They
also drive innovation, competitiveness and efficiency of the industries they operate in, thus are
having much larger effects on the whole economy. In terms of job creation, for example, our data
show that one job created in a startup triggers the creation of an additional four jobs in the wider
economy6.
5
2019 Global Startup Ecosystem Report, Startup Genome
6
The Multiplier Effect of Innovation Jobs,” MIT Sloan Management Review, Kauffman Foundation, Startup Genome analysis
9Exhibit 4: Total Ecosystem Exit Value accelerates with ecosystem size
$120
$100
Exit Value ($B)
$80
$60
$40
$20
$0
70 700 7,000
Startup Output
As exemplified in the graph, growth as a function is exponential: The economic value created by a
startup ecosystem accelerates as the ecosystem grows. Startup Output refers to the number of
startups within an ecosystem.
The role of larger scale-up companies and economic value is evident as they create many more jobs
and value (using valuations and exit values as an indicator of economic value). In addition, high profile
exits, and valuations are proven in their function as role models and lighthouses. They inspire entire
ecosystems, e.g. with Gentech company Illumina triggering the extraordinary rise of San Diego to
rank no three in the global Life Sciences environment, Research in Motion (RIM) providing the spark
for the Toronto Waterloo innovation triangle and in Berlin Rocket Internet and Zalando being at the
roots of the city’s success story.
At the same time, ecosystems and their startup funnels show a very high rate of failure as many
ideas are contemplated and tried by founders only to fail when exposed to clients and competitors.
This is not necessarily a negative, as ideas and talent typically get recycled within the ecosystem,
ultimately resulting in new and better ventures.
101. Growing the funnel: We need to increase the number of startups that are being founded,
thus significantly increasing the chances of success in later stages (a function of sheer
numbers). More startups directly translate into more chances of success.
2. Widening the shape of the funnel: We need to improve the conditions for young startups to
successfully grow and to successfully master the initial phases of their scaling journey (a
function of startup quality).
3. Creating economic impact: The actions mentioned here result in a powerful ecosystem with
thriving scaleups. Visible valuations and exits that can serve as role models for local
ecosystem participants put the Rhineland ecosystem on the international talent and investor
map and directly and indirectly trigger positive economic impact for the economy.
113. Vision 2025 - Scenarios to accelerate Rhineland
Following the theory above, our first imperative must be to further increase the number of startups
(Startup Output) in Rhineland as well as tackling the low number of scaleups companies. Based on
Rhineland’s current phase and geographical positioning, we strongly believe there is further
potential to grow Startup Output and drive scaleup creation to more significantly grow economic
impact.
In order to illustrate this, we run 2 scenarios which illustrate startup output growth, effects on
increasing the scaleup segment as well as additional employment and economic value created.
§ Scenario 1: Rhineland increasing its startup output growth rate from current 6.29% to 10%
§ Scenario 2: Rhineland increasing its startup output growth rate from current 6.29% to 15%
2020 Scaleup
# of Average
Employment Employment Direct
Indirect
Output Scaleups jobs per Employment
Rate Scaleups Startups Employment
+ Exits scaleup Generated
Current
situation
900 1.11% 10 105 1,050 6230 7,280 29,120
The table above shows the status quo in Rhineland and will be discussed item by item: For a
population of 8.7M, 900 startups are active in the ecosystem. With 10 scale-ups, the scale up rate is
1.11%7, which means that 1.11% of startups eventually succeed in achieving a valuation of $100M
or more.
On average, each of the scaleups in Rhineland employs 105 people, which means that the 10
scaleups in the region provide direct employment to 1,050 people. Data from our founders’ survey
in Rhineland yields that on average, a startup in the region has 6 staff on payroll, which means that
6,230 people are employed by Startups in Rhineland. Adding these numbers, we see that a total of
7,280 people is directly employed by the startup segment in Rhineland.
Using the earlier presented Kauffman Foundation’s factor 4 for indirect jobs created, these startups
are responsible for a total of 29,120 jobs created in the local economy.
7
Scaleups are defined as companies valued at 100M$+ for the time period between 2015-19. This is calculated using 1)
exit value: companies that exit at 100M$+ or greater, 2) disclosed valuations: Startups with disclosed valuations of 100M$+
after a funding round and 3) Estimated valuations: Valuations calculated based on the size of Series A, B, C+ rounds. The
Dilutions assumed are based on global medians: Series A = 25% Dilution, Series B= 18% Dilution, Venture C onwards =
10% Dilution
122020 Ecosystem Value per Startup ($M) Total Ecosystem Value ($M)
Current situation $3.04 $1,433.18
Startup Genome calculates an ecosystem value for Rhineland of 1.43B$. This reflects standardized
calculations that are part of our methodology based on
1) exit value: companies that exit at $100m+ or greater
2) disclosed valuations: Startups with disclosed valuations of $100m+ after a funding round and
3) estimated valuations: Valuations calculated based on the size of Series A, B, C+ rounds. The
dilutions assumed are based on global medians: Series A = 25% Dilution, Series B= 18% Dilution,
Venture C onwards = 10% Dilution
While these numbers seem impressive at first sight, they are not yet sufficient for Rhineland to reach
the position warranted by the strengths of its local economy and size of its metropolitan area
population of 8.7 million.8 Hence, we outline a five-year vision for Rhineland, Vision 2025, which
shows where Rhineland could be in five years if its current growth trajectory was accelerated.
2025 Output Scaleup Rate # of Scaleups
Output in 2020 Growth Rate
in 2025 by 20259 + Exits
Growth at current
900 6.3% 1,221 1.3% 16
trajectory
Scenario 1: 10%
900 10.0% 1,449 1.7% 25
Growth
Scenario 2: 15%
900 15.0% 1,810 2.8% 51
Growth
In the first row, we calculate the number of startups and scaleups in Rhineland in 2025, applying its
current growth rate of 6.29%. Without any additional policy action, Rhineland will see its startups
increase from 900 in 2020 to 1,221 in 2025. Currently, there are 10 scaleups, which will increase to
16 in 2025 when continuing on the current growth trajectory.
Scenario 1 and 2 in the table show how many startups as well as scaleups Rhineland could have in
2025, when targeted interventions lead to higher growth rates such as a startup output growth rate
of 10% and a proportional scaleup rate of 1.73%. If Rhineland were to adopt these rates, it would
8
Statistisches Bundesamt / Own calculations
9
Please note that scaleup rates increase in line with the exponential growth function of ecosystem value. Rhineland
growing at its current trajectory of 6.29% will result in the ecosystem reaching an improved rate of scaleup success without
additional intervention. The same mechanisms apply to startup value and average job creation numbers
13have 1,449 startups instead of 1,221 in 2025 and 25 scaleups instead of 16. In Scenario 2, this climbs
to 1,810 startups by 2025 and 51 scaleups as compared to 1,221 startups and 16 scaleups.
Exhibit 5: Startup Output Potential in Rhineland
2000
1810
1800
1600 1449
1400 1221
Startup Output
1200
1000 900
800
600
400
200
0
Current Growth at current Scenario 1: 10% Scenario 2: 15%
trajectory Growth Growth
Applying these increased numbers to employment created, while accounting for a higher average
number of jobs per scaleup (in scenario 2, we use 245 average jobs per scaleup, which is the average
of scaleups in the Globalization phase, or the phase average), we see that a total of 14,346 direct
employment positions, with 57,385 indirect employment. In scenario 2 this grows to the startup
ecosystem directly employing 24,810 people, with indirect employment of 99,238.
2025 Average jobs Employment Employment Direct
Indirect
Employment
per scaleup10 Scaleups Startups Employment
Generated
Growth at current
105 1,680 8435 10,115 40,459
trajectory
Scenario 1: 10%
175 4,375 9971 14,346 57,385
Growth
Scenario 2: 15%
24511 12,495 12315 24,810 99,238
Growth
10
Please note that the number of startup job creation grows in line with the exponential growth function of ecosystem
value. Rhineland growing at its current trajectory of 6.29% will result in the ecosystem achieving higher numbers of average
startup employment even without additional intervention. The same mechanisms apply to startup value and average job
creation numbers.
14Once again checking for ecosystem value, we see that scenario 1 would yield an addition of 1.85B$
in ecosystem value, while scenario 2 would trigger an additional 5.18 B$ in ecosystem value.
2025 Ecosystem Value per Total Ecosystem Value Gain in Ecosystem
Startup ($M)12 ($M) Value ($M)
Growth at current
$5.51 $6,725.1
trajectory
Scenario 1: 10%
$5.92 $8,580.8 $1,855.7
Growth
Scenario 2: 15%
$6.58 $11,911.3 $5,186.2
Growth
We believe these scenarios to be ambitious but also realistic. In the preparation of this report we
have run this model for all clusters globally, performing on Globalization Phase averages, as well as
for Berlin to compare with a more aspirational (Integration Phase) ecosystem. The growth numbers
are significantly higher and not realistically achievable within a five-year time horizon.
Exhibit 6: Potential Ecosystem Value
14,000
Potential Ecosystem Value ($M)
12,000
10,000
8,000
6,000
4,000
2,000
0
Current Scenario Growth at Current Scenario 1: 10% Scenario 2: 15%
Trajectory Growth Growth
12
Ecosystem Value per Startup = [1819.54 * (Startup Output)2 + (3.29E+06) * (Startup Output) + (5.88E+08)]
/ Startup Output
15If we were to succeed with the outlined – and conservative – scenario of 10% annual growth,
Rhineland would approach the TOP30 ecosystems globally, measured in total ecosystem value.
With conservative growth of 10% Rhineland would be a TOP30
Ecosystem globally by 2025.
How to get there?
When thinking through this strategy, two questions are top of mind. “Is it realistic to propose that
we can accelerate the growth of a startup ecosystem to the level outlined in the scenario?” and “If
yes, how do we get there?”
With the ecosystem counting 900 tech startups currently, it is growing at a rate of 6.29%, which
means it will reach about 1,221 startups in 2025 if this growth rate remains unchanged. In order
grow by 10%, 15% or grow as fast as peers in the Globalization phase or even Berlin, the growth
trajectory needs to be accelerated, which is shown in the graph below.
Exhibit 7: Startup Output Trajectory
Current Trajectory Globalization Density Scenario
Berlin Density Scenario 10% Growth Rate
15% Growth Rate
3,500
3,000
2,500
Startup Output
2,000
1,500
1,000
500
0
2020 2021 2022 2023 2024 2025
The difference between 6.29% (current growth) and 10% (projected) growth rate is a net gain of
around 50 startups yearly in the first four years in order to reach the target of 1,441. This number is
feasible and requires targeted actions which will be described in further detail in the remainder of
this report, such as:
16Growing the Number of Startups (Startup Output) by reducing unnecessary startup death by
means of better funding and by more intense university engagement: Rhineland has four large
universities and a significant number of smaller universities and technical colleges. (NRW in total
has 71 universities and colleges). If we were to succeed in increasing the rate of university related
startup creation with these educational institutions and universities in Bonn, Cologne, Aachen
and Düsseldorf each creating a net extra 10 startups per year, that would lead to an additional
40 startups p.a. And a total of 160 in the 5-year period until 2025.
Similarly, Rhineland has 10 Excellence Clusters that are intended to spearhead Research and
Innovation in select High Tech sectors. If we could create on average 1 new startups p.a. at each
of these select Excellence Clusters, we would be adding 40 startups in the next five years. We
believe that a focus on select institutions - or select industrial subsectors and technologies -
should be a key priority for Rhineland.
Increasing the Scaleup success rate and creating larger exits by greater activation of the local
economy. Famous scale-ups and unicorns can inspire entrepreneurially minded people to make
the jump to entrepreneurship. Famous scaleups can also increase the rate of serial
entrepreneurship by re-engaging those who have succeeded or failed before. Visible scaleup
success and a few high profile exits provide role models and motivation across the entire
ecosystem, thus creating a “pull effect” across the entire startup ecosystem funnel.
The theoretical argument might be made for Rhineland to catch up with its peers or even with Berlin,
which is in the Integration Phase. This would require increasing the startup population to more than
2,500 and 3,000 startups respectively when taking into account the large size of Rhineland. We do
not believe such modelling to be realistic and indeed have not witnessed any ecosystem in our
member network to show such dramatic growth rates.
Economic Spillover Effects
Scenario 1 and 2 both bring in an additional technology-based economic multiplier, not counted in
our estimates presented here. Positive spillover effects results from the fact that tech companies to
a significant degree export their products and services globally (selling mostly outside of their
national markets) and significant proportions of venture funding from international investors
(foreign direct investments).
Moreover, the existence of a significant and performing startup ecosystem elevates the performance
of the whole economy. It does so by driving innovation and factor productivity and by attracting
global knowledge and global talent and capital. The opposite also holds. A lack of access to a high
performing startup ecosystem can be very damaging, even if a region produces top-level technology
and patents. The universities in the Raleigh-Durham (USA) “Research Triangle,” for instance, have
high levels of technology creation and are highly ranked, but they do not produce successful startup
17entrepreneurs like UCLA, UCSD in San Diego, Cambridge, UK, and the University of Waterloo,
Canada, despite being a world-leading technology center. Our recent engagement with the
Municipality of Seoul further underpins this - whilst still being the leader in tech R&D and patents
globally, the system is struggling in converting research in viable businesses and economic impact.
The presence of a very well-resourced startup ecosystem (with VCs, knowledge and talent) is a key
asset for a region to thrive.
184. Scaling
One of the main acceleration factors for the growth of an ecosystem are impressive $100M + exits,
which shine like a lighthouse far beyond the region and thus attract resources such as capital and
talent. They also represent a high motivation for potential newcomers, providing for inspirational
“Heroes” to follow.
Hence, the political “exit” goal at this stage should be to produce a series of valuations and exits over
$ 100 million that position the ecosystem nationally or regionally as an outstanding place to start
and scale a business, and thus start a cycle of positive reinforcement and the attraction of outside
capital and knowledge.
Key Objective: By means of accelerating top startups to $100 M exits,
we seek to create the top of the ecosystem pyramid and to create a
pull - or activation - effect along the entire ecosystem funnel.
Road map:
§ Establish an elite scaling program
Learn from:
§ Tech Nation, UK: Future Fifty
§ The Lazaridis Institute, Toronto-Waterloo, Canada
§ Scaleup Nation, Amsterdam, The Netherlands
Road Map:
§ Build bench strength through global mentorship network
Learn From:
§ GEN Accelerate
Road Map:
§ Build a broader softlanding network
learn from:
§ GIA Singapore
19Status Quo Rhineland - Underperformance in Scaleup Creation
The Rhineland region with 1.11% Scaleup Creation significantly underperforms in regard to creating
larger companies when compared to its peers in the same ecosystem lifecycle phase, e.g. to
Copenhagen (2.25%), Melbourne (1.77%) and Montreal (1.59%) showing significantly higher values.
When looking at the more aspirational Integration Phase ecosystems such as Berlin or Boston, the
distance to frontier is even more pronounced, with companies in Berlin standing a chance of 3.83%
of and the highly mature environment in Boston delivering a staggering 5.67%.
Exhibit 8: Scaleup Creation - Globalization Phase + Integration Phase Benchmarks
6.00% 5.67%
5.00% 4.50%
Startup Output
3.83%
4.00% 3.55%
3.32%
3.07%
3.00% 2.69%
2.25% 2.13% 2.05%
2.00% 1.57% 1.58% 1.77% 1.77% 1.59%
1.11%
1.00% 0.27%
0.00%
M mi
bo r
en
on
n
on
Ba nta
Bo r
nh a
Lu m
ne
d
l
l
ou i
nc o
at y
Rh rea
ou
k
pu
ve
ne
p e on
rli
Va rlo
an
sin
e
ia
ag
ur
st
st
Se
Be
ou
al
la
m
yd
Co cel
t
el
e
M
el
on
At
Ku us
in
S
H
r
H
W
r
el
Je
a
M
o-
al
nt
ro
To
The following table provides an overview of exits in the Rhineland in the tech and life science sector
in the past 10 years, i.e. since 2010.13
Origin City
Company Amount (USD) Year Type Sector
(HQ)
Trivago $1,000,000,000 2012 Acquisition Cologne AdTech
Rigontec $550,389,068 2017 Acquisition Bonn Biotech
Boxine $336,000,000 2019 Acquisition Düsseldorf Education
13
Data retrieved from Dealroom, PitchBook, Crunchbase, as well as the Ministry of Economic Affairs, NRW.
20ESL Gaming $116,015,818 2015 Acquisition Cologne E-Sports
Cardionovum $103,870,000 2015 Acquisition Bonn Healthcare
Sividon $57,283,217 2016 Acquisition Cologne Life Sciences
Since 2010, there were seven local startup exits of 50M+ which were classified as tech (software) or
life sciences. It’s important to note that companies with exit rounds which have been formed as spin
off companies are not captured, since this invalidates their startup status.
Forming a scaleup segment is difficult for almost all ecosystems outside the few globally leading
cities such as SF, NYC and London.
As shown in exhibit 9, even today’s number three ecosystem - London - struggled for many years to
counteract the then trend of great early stage businesses to experience significant issues in their
scaling journey. Many businesses then either defaulted or prematurely sold to large tech
competitors, thus not realizing their full value and economic impact on the local economy. Note the
strong pick up in unicorn growth, coinciding with the launch of the UK’s elite growth program Future
Fifty in 2014/15:
Exhibit 9: Cumulative number of unicorns per country14
14
Dealroom.co. - Includes companies founded since 1990 and reached $1B valuation up to May 2019
21A Matter of Capital? Larger Funding Rounds seem to correlate with Scaling success
A scaleup segment may be a direct function of capital and indeed on the surface, our data in regard
to large scaling rounds - that is funding above 10M US$ per round - seems to correlate strongly with
100M$ exits and the aspirational unicorn club.
Exhibit 10: Causal relationship between large funding rounds and scaleup production
40%
35%
30%
% of rounds > $10 Mn
25%
20%
15%
10%
5%
0%
Billion-Dollar Club* $100M+ Exits All Series A Rounds
At a high-level comparison, in Rhineland, about 2.5% of all Series A rounds are large (>10M US$) in
the above-mentioned context, positioning the region amongst the phase average of Globalization
ecosystems.
However, when dissecting the funding data into their individual stages, it becomes evident that
Rhineland’s scaleups do not attract the significant follow-on funding rounds that fuel scaleup growth
in other peer ecosystems. The distance to frontier here is between 1.5 - 2x in regard to Series B
funding and 8-10x in regard to Series C; the latter of which is almost non-existent in the region. Our
data are supported by the qualitative interviews we have conducted, with both founders as well as
VC investors being critical as to the availability of later stage capital and more significant funding
rounds.
22Exhibit 11: Funding round funnel with peer and aspirational benchmarks
2015-2017 2016-2018 2017-2019 2018-2019
Seed Series A Series B Series C
100.0%
25.0%
Startup Output
6.3%
1.6%
0.4%
0.1%
Rhineland Copenhagen Barcelona Montreal
Melbourne Boston Berlin
Can we address the scaling issue in Rhineland by ramping up late stage capital?
The data on funding as well as inputs from qualitative interviews suggest that addressing the late
stage funding gaps might be the silver lining solution for the ecosystem. And indeed, the famous
Yozma program in Israel is an example for a public private partnership that sought to address
funding issues and to this day is seen as a key enabler of the Israeli success story. Yozma not only
made seed and scaling capital available, it also triggered the massive influx of private foreign VC
capital, lifting the entire ecosystem dramatically.
When looking at more recent examples though, the direct correlation may not hold. Public sector
interventions into the late stage VC funnel in the last decade, both in Hong Kong and in Melbourne,
resulted in distorted ecosystem funnels and a generally inefficient capital allocation rather than in
overall scaling success. And even in a world leading ecosystem such as Singapore with its abundance
of late stage capital, unicorns remain a rare species to this day.
Furthermore, late stage capital in our experience is much less local as opposed to earlier funding
rounds with late stage international VCs investing wherever a company meets its expectations for
quality and investment thesis and where legal framework conditions are sound.
Hypothesis: If it is not the lack of capital only, Rhineland must be missing other
success factors. And we have to ask the question if startups are competitive
enough, deserving the larger scale investments. We believe at this stage they
likely - at least in their majority - are not.
23Scaling is the result of a system of success factors
Whilst we do not negate the necessity and impact of the availability of capital for a scaleup segment,
data shows that larger ecosystems that combine more resources and startup experience create
scaleups at significantly higher rates.
Exhibit 12: Correlation between ecosystem size and scaleup creation
1.8%
1.6%
1.4%
1.2%
Scaleup Rate
1.0%
0.8%
0.6%
0.4%
0.2%
0.0%
London
Vancouver
Barcelona
New York
Silicon
Berlin
Tel Aviv
Valley
Toronto
Amsterdam
City
Globalization Attraction Integration
# of $50m Exits/Startup Output $B Club/Startup Output
When dissecting the individual success factors, it becomes clear that scaleup success is a system of
factors rather than a function of capital alone, with attributes such as Global Market Reach, Access
to Talent and Startup / Growth Experience being equally important factors as funding.
24Exhibit 13: Scaleup Success is a system of factors
10
9
Sucess Factor Score (Index)
8
7
6
5
4
3
2
1
0
Singapore
London
Toronto
Vancouver
Amsterdam
Paris
New York City
Berlin
Silicon Valley
Tel Aviv
Globalization Attraction Integration
Market Reach Funding Talent Startup Experience Average
Key Success Factors outside of Funding
Founder DNA, Growth Experience, Global Connectedness and Global Market Reach are key success
factors for scaling a business, e.g. with globally well-connected startups growing on average at a
factor of 2.1x faster than their local peers15.
The data analysis shows that Rhineland founders are lacking in most of these scaling factors, e.g.:
they are less likely to consider an international market perspective when ideating and building their
products and in executing a Global Market strategy right from the start. This is somewhat
understandable, given the availability of a large domestic economy locally; however, it significantly
slows international expansion in later stages of the company.
The diagram below illustrates the above hypotheses with low values for founders claiming a globally
competitive product and with extremely low values for addressing global markets from day one.
During our qualitative interviews we were able to confirm the data insight with many founders stating
that they find their first customers locally, develop to their requirements and neither see the need
nor have the resource to develop with an international horizon at their earlier stage of development.
15
Startup Genome, GSER 2019
25Exhibit 14: Founders claiming globally leading products
50%
45%
40% Globalization Average
Globally Leading Product
35%
30%
25%
20%
15%
10%
5%
0%
d
l
n
on
n
a
ne
ea
on
rli
ge
an
ur
st
tr
Be
ha
el
el
Bo
on
bo
in
rc
en
M
Rh
el
Ba
p
M
Co
Exhibit 15: Startups Attacking global market immediately
100%
90%
Targeting Global Market First
80%
70%
60%
Globalization Average
50%
40%
30%
20%
10%
0%
a
d
ne
l
n
on
n
ea
on
rli
ge
an
ur
st
tr
Be
ha
el
el
Bo
on
bo
rc
in
en
M
el
Rh
Ba
p
M
Co
26Exhibit 16: Founders with high ambition
30%
25%
Globalization Average
20%
15%
10%
5%
0%
Berlin Barcelona Copenhagen Rhineland Montreal Melbourne Boston
The founders ambition and mindset - their DNA - then is reflected in the way they connect, market
and sell their products on an international stage with our data again showing low values for the
Global Connectedness of founders and their Global Market Reach, the latter indicating in far they
are successful in addressing markets outside their domestic environment. Both factors are
surprisingly low among local founders: The data shows that the strategy of founders aims to build
mostly solid, down-to-earth companies. The aggressive “Unicorn mentality” from San Francisco,
Berlin or even Copenhagen is missing. To mention the exception from the norm: Beijing based
companies show similar characteristics; however, they scale and show exceptional valuations
leveraging the gigantic size of their domestic market; something that is unique to the Chinese market
and not replicable, neither in Rhineland nor in other German ecosystems.
27Exhibit 17: Global connectedness
10
9
Connections to Top Ecosystems
8
7 Globalization Average
6
5
4
3
2
1
0
Berlin Barcelona Copenhagen Rhineland Montreal Melbourne Boston
Exhibit 18: Global market reach
45%
40%
35%
European Top Tier Average
30%
Foreign Customer
25%
20%
15%
10%
5%
0%
Berlin Barcelona Paris Rhineland Frankfurt Munich London
28Hypergrowth Experience and Talent
A lack of experienced growth talent likely is contributing to the above-mentioned factors. This could
stem from the fact that Rhineland is tech powered by technical innovators and is amplified by a
talent gap of experienced management talent that already has gone through the phases of start-
and scaleup growth, one or multiple times. Founder mindset and a key talent gap combine in
Rhineland, likely significantly impacting its ability to produce more successful scaleup companies.
Exhibit 19: Availability of experienced growth talent
80%
Experienced Growth Employees
70%
60%
Globalization Average
50%
40%
30%
20%
10%
0%
d
n
on
n
a
ne
l
ea
on
rli
ge
an
ur
st
tr
Be
ha
el
el
Bo
on
bo
in
rc
en
M
Rh
el
Ba
p
M
Co
Rhineland has a strong presence of small and medium sized companies and industry. As solid and
well-paying employers, they compete with startups for talent. This can be seen in the following graph,
which shows that startups in Rhineland score below average in the “Access to Engineering Talent”
category. Given the strong presence of universities in the respective field, we assume that this fact
is due to corporates positioning themselves as more attractive employers than startups.
Startups in top ecosystems such as Silicon Valley have been able to attract top talent by using stock
options as cheap “wage replacement”. Hereby, they compensate potentially lower salaries with the
promise of a massive upside should the company succeed.
However, as we can see below, offering a slice of the pie in form of Employee Stock Option Plans or
short ESOPS is almost non-existent in the region.
29Exhibit 20: Employee Stock Option Plans are almost inexistent
1.2
Globalization Average
1.0
Startup Experience Index
0.8
0.6
0.4
0.2
0.0
Exits ≥ USD 50m in Founder Team Advisors with Equity Stock Options to All
the last 10 years Hypergrowth Employees
Experience
This is due to regulatory hurdles in Germany, which make ESOPS an unattractive tool for highly
mobile and sought-after talent. The Federal Association of German Startups is currently working on
a large-scale study to illustrate the advantages of ESOPs. They plan to submit the study to German
Minister for Economic Affairs and Energy Peter Altmaier before summer 2020 to change regulatory
conditions, with the objective of creating an internationally competitive startup environment in
Germany- an initiative we support.
4.1 Need for an Elite Scaling Program
Summarizing the above we believe that Rhineland entrepreneurs need assistance in addressing
success factors gaps outside of funding if they are to significantly improve on their scaling outcomes.
The following slide summarizes the key success factor gaps along the Startup Genome ecosystem
success factor model that we believe need addressing.
30Global Market Potential Global
Reach Connectedness
Founder Founder Immigrant
Networking
Ambition Strategy Founders
Globally Leading Targeting Global
Local Meetings
Product Market First
International
Travel
Rhineland should invest in a scaling program first, with a laser focus on few and highly select startup
companies that show true scaling potential. Such a program would seek to create a steadier and
more predictable stream of larger valuations and exits. It would address the success factors gaps
outside of funding as follows:
Knowledge: Addressing very specific scaling needs and knowledge gaps, for founders and their
management teams. These differ considerably from the broader but more basic learning needs
in earlier stage companies as founders are confronted with the specific challenges of high growth
and of transitioning to a larger company with the need for structure, processes and governance.
Culture: Amplifying the ambition and the desire of founders to stretch ambition and mindset.
Investment: Creating a visible brand that signals high growth potential and high-quality
investment opportunities to international investors (and top growth and technical talent as well).
Beyond silos: Sourcing qualified candidates from all cities in Rhineland (or NRW) to achieve
quantity and to allow for selection quality and doing so by collaborating closely with existing
SSOPs in the cities.
Peers: Small cohorts and their alumni create close and highly connected groups of peer learning
and scaling community, amplifying each other's experiences, relationships and success factors.
Focus areas: Ideally the elite program would be differentiated to other international scaling
programs, providing a stronger proposition for both mentors and investors. The strong B2B and
Deep Tech focus of Rhineland should be reflected in the program selection.
Soft-Landing: Utilization of existing or new soft-landing arrangements with a select number of
international markets.
31How large should an elite program be?
Our data suggests that in Rhineland 1.11% of all startups transition to scaleups in a five-year time
frame, resulting in 10 scaleups or on average two per year. Scenarios 1 and 2 in this study showed
that Rhineland might record 16 or even 25 scale ups as part of Vision 2025.
We suggest an elite program cohort size between 5 and 13 companies depending on the scenario
chosen (assumption that companies remain with the program for a duration of two years). The below
table illustrates program sizing under the 2 scenarios:
Exhibit 21: Elite program sizing and funding requirements under scenario conditions
Number Scaleup
of productio Cohort
Output in Scaleup
scaleups n p.a. Size per 2
2025 rate
after 5 (4 years years
years till 2025)
Rhineland at current
900 1.11% 10 2 5
growth rate of 6.29%
Scenario 1:
Rhineland at 10% 1221 1.30% 16 4 8
growth rate
Scenario 2:
Rhineland at 15% 1449 1.73% 25 6 13
growth rate
In the following we introduce a number of programs that have proven to be effective in addressing
the scaling gap in their respective ecosystems.
UK: Tech Nation Scaling programs
The United Kingdom has been hugely successful when it comes to creating scale-ups, driving the
country’s tech advantage. To date, 35% of Europe’s tech unicorns (1B$ valued businesses) have been
created in the UK.
Tech Nation is a government backed UK network for entrepreneurs that operates nationwide and
seeks to backfill gaps in the ecosystem where private market solutions have failed to emerge.
Since 2015, the organization operates two major scaling programs, Upscale (Mid-Stage) and Future
Fifty (late stage), cultivating a steady pipeline of next generation leaders and unicorns.
32Prestigious alumni include heavyweights Monzo, Starling Bank, Darktrace, Deliveroo, and
Skyscanner. Particularly interesting is the fact that companies regularly return to mentor new
cohorts, sharing unique knowledge and world class mentorship, since they likely have undergone
similar struggles. The success of the program’s alumni attests to the effectiveness of the UK in
championing leading tech companies. For example, Upscale alumni challenger bank Monzo has
graduated from the program and is now a Future Fifty company, giving back by mentoring others in
the cohort. Its success story is phenomenal - it has seen a 2,301% increase in total funding and a
2,122% increase in staff.
Exhibit 22: Late stage vs mid stage funding
Both programs have been conceived as sector agnostic, reflective of the small numbers of
companies that reach the ambitious growth criteria. Only recently and on the back of the
extraordinary growth of the UK tech ecosystem were extensions introduced for very select sub
sectors and somewhat earlier stage companies that today show critical mass, namely FinTech, Cyber
and AI.
33Example: Tech Nation's Future Fifty
Objective: To accelerate the growth of a highly select group of growth stage digital UK startups,
aiming for an exit within a 24 months period (IPO or M&A).
Short description: Future Fifty is a mid to late stage growth program, which unites the UK’s most
successful tech companies in building a powerful network of highly experienced entrepreneurs.
Its key characteristics include:
Knowledge Transfer: Cohort based groups of founders interact with serial entrepreneurs that
have successfully built one or more businesses, transferring unique insights and knowledge.
This mentorship component forms the backbone of the program's success. Additional
technical topics complement the curriculum, e.g. in regard to specific legal or regulatory
challenges.
Specific topics: International Expansion, Finance and Public Markets, Regulatory, HR
Peer2Peer learning: The program convenes founders on a regular basis for them to share
their challenges and experiences amongst their own peer group. This mechanism is replicated
for key management functions, e.g. with CTO, CFO, HR Directors and CMO groups.
Length: The program spans 24 months, reflective of the time most high growth companies
require to get IPO or M&A ready.
Alumni: Tech Nation facilitates a vibrant Alumni network, again providing the connection
between current cohort participants and those “who have done it before”.
Promotion and Brand: Program participants receive significant media opportunities. The
program itself has been positioned as a brand that speaks for unique quality to late stage
investors all over the globe.
Talent: The program connects directly with Tech Nation Visa, a scheme that allows the
organization to recommend and fast-track foreign talent for TIER-1 VISA.
Selection criteria: Tech Nation facilitates an annual selection process and respective selection
jury. The jury consists of serial entrepreneurs and VC partners only. Applicants need to have
raised Series B+, generating £5m+, and be growing at a rate of approx. 50% year-on-year.
KPIs:
Size: 25 companies annually, cohort size 50
Mentorship: Access to approx. 100 mentors (serial entrepreneurs)
Population: 127 companies since its launch in 2014
Funding: 8B GBP in combined funding received
Exits: 9 IPOs, 30 M&A exits
34You can also read