VISIT FLORIDA Return on Investment for - Submitted: January 2021 - Office of Economic ...
←
→
Page content transcription
If your browser does not render page correctly, please read the page content below
Return on Investment for
     VISIT FLORIDA

      Submitted: January 2021
Table of Contents

EXECUTIVE SUMMARY AND COMPARATIVE ANALYSIS ................................................................................. 1
TOURISM AND FLORIDA ................................................................................................................................ 4
THE DETERMINANTS OF TOURISM DEMAND ............................................................................................... 8
STATE‐SPONSORED ADVERTISING AND TOURISM ...................................................................................... 14
STATE DMOs ADAPT TO THE COVID‐19 PANDEMIC.................................................................................... 18
METHODOLOGY .......................................................................................................................................... 21
THE STATEWIDE MODEL ............................................................................................................................. 26
KEY ASSUMPTIONS IN THE MODEL ............................................................................................................. 28
KEY TERMS IN THE MODEL.......................................................................................................................... 29
PROGRAM FINDINGS................................................................................................................................... 30
EXECUTIVE SUMMARY AND COMPARATIVE ANALYSIS
Background and Purpose
Legislation enacted in 2013 and revised in 2014 directs the Office of Economic and Demographic
Research (EDR) and the Office of Program Policy Analysis and Government Accountability (OPPAGA) to
analyze and evaluate state economic development incentive programs on a recurring three‐year
schedule.1 EDR is required to evaluate the economic benefits of each program, using project data from
the most recent three‐year period, and to provide an explanation of the model used in its analysis and
the model’s key assumptions. Economic Benefit is defined as “the direct, indirect, and induced gains in
state revenues as a percentage of the state’s investment” – which includes “state grants, tax
exemptions, tax refunds, tax credits, and other state incentives.”2 EDR’s evaluation also requires
identification of jobs created, the increase or decrease in personal income, and the impact on state
Gross Domestic Product (GDP) for each program.
In this report, the program VISIT FLORIDA is under review. The analysis addresses activity occurring in
Fiscal Years 2016‐17, 2017‐18, and 2018‐19. This is EDR’s third evaluation of this program.3
Explanation of Return‐on‐Investment
In this report, the term Return‐on‐Investment (ROI) is synonymous with economic benefit, and is used in
lieu of the statutory term. This measure does not address issues of overall effectiveness or societal
benefit; instead, it focuses on tangible financial gains or losses to state revenues, and is ultimately
conditioned by the state’s tax policy.
The ROI is developed by summing state revenues generated by a program less state expenditures
invested in the program, and dividing that calculation by the state’s investment. It is most often used
when a project is to be evaluated strictly on a monetary basis, and externalities and social costs and
benefits—to the extent they exist—are excluded from the evaluation. The basic formula is:
(Increase in State Revenue – State Investment)
State Investment
Since EDR’s Statewide Model4 is used to develop these computations and to model the induced and
indirect effects, EDR is able to simultaneously generate State Revenue and State Investment from the
model so all feedback effects mirror reality. The result (a net number) is used in the final ROI
calculation.
As used by EDR for this analysis, the returns can be categorized as follows:
Greater Than One (>1.0)…the program more than breaks even; the return to the state produces
more revenues than the total cost of the incentives.
1 Section 288.0001, F.S. As of 2020, twenty programs are specified.
2 Section 288.005(1), F.S.
3 The previous reports can be found at EDR’s website: http://edr.state.fl.us/Content/returnoninvestment/
4 See the section on the Statewide Model for more details.
1 Equal To One (=1.0)…the program breaks even; the return to the state in additional revenues
equals the total cost of the incentives.
Less Than One, But Positive (+,were significantly lower than Florida’s rate during the current review period.5 Even though Hawaii’s
tourism growth rate came closer to Florida’s rates in 2017, 2018 and 2019, the rate was markedly lower
in 2016.6
Total Number of Out‐of‐State Visitors to Florida
2013‐14 2014‐15 2015‐16 2016‐17 2017‐18 2018‐19
Domestic Visitors 80,338,000 86,891,000 95,524,000 101,201,000 108,414,000 114,513,000
International Visitors 15,305,000 15,493,000 14,422,000 14,541,000 14,507,000 14,515,000
Total Number of Visitors 95,643,000 102,384,000 109,946,000 115,742,000 122,921,000 129,028,000
CY2001‐12 Historical Growth Rate: 1.99% FY2013‐16 Average Growth Rate: 5.20% FY2016‐19 Average Growth Rate: 5.19%
Source: Florida Economic Estimating Conference database maintained by EDR
In addition, the percentage of tourists influenced by marketing rose yet again. The analysis indicated
that an average of 59.9 percent of all out‐of‐state tourists were influenced by tourism marketing during
this period of review.7 In the prior analyses, marketing influenced about 57.3 percent and 54.5 percent,
respectively. This increase is significant, changing the total number of visitors influenced by marketing,
as well as the number that is attributed to VISIT FLORIDA.
VISIT FLORIDA’s overall positive ROI is driven by adding dollars from elsewhere to Florida’s natural
economy. In this regard, spending by tourists operates in the same general manner as the export of a
product produced in Florida. The more tourists there are, the more “exported” goods and services there
are. While the services purchased by tourists add only broadly to the economy, the goods they
purchase have the additional ROI‐value of being taxable in Florida. These purchases include lodgings at
hotels, meals at restaurants, gifts at souvenir shops, tickets to amusement parks and Florida attractions,
and car rentals. All these goods are subject to state taxes, most to sales taxes. In addition, car rentals
and gasoline purchases are subject to the state’s rental car surcharge and fuel taxes.
The continued strong growth in total visitors and marketing‐influenced tourists suggest that VISIT
FLORIDA’s marketing is working; however, VISIT FLORIDA’s marketing efforts are just one of the many
factors that can contribute to a tourist’s decision to visit Florida.8 The other determinants also impact
the total tourism level and suggest that VISIT FLORIDA’s role is ultimately limited in its impact. This
analysis attempted to allocate credible shares of tourists to VISIT FLORIDA and to each the other factors
of tourism demand deemed important to Florida tourism. As a result, the VISIT FLORIDA findings in this
report should provide a reasonable estimate of the marketing program’s impact on the Florida
economy.
5 “California Travel & Tourism, Overview of Key Drivers and Outlook.” Tourism Economics, An Oxford Economics Company,
October 22, 2019: 9, 13 & 20. https://industry.visitcalifornia.com/research/report/california‐travel‐tourism‐forecast‐state‐
2019‐october
https://www.governor.ny.gov/news/governor‐cuomo‐announces‐record‐breaking‐numbers‐great‐new‐york‐state‐fair‐
attendance‐and
Empire State Development Annual Reports: https://esd.ny.gov/sites/default/files/ESD‐Annual‐Report‐2019.pdf
https://esd.ny.gov/sites/default/files/news‐articles/Tourism_Required%20Reporting%202018‐19_REV_3_22_0.pdf
https://www.scpartnership.com/wp‐content/uploads/2018/04/ESD‐2017‐Annual‐Report.pdf
6 https://www.hawaiitourismauthority.org/research/annual‐visitor‐research‐reports/
7 See VISIT FLORIDA Direct Influencer Study Results Table on page 21.
8 See “Determinants of Tourism Demand” for an overview of the influential factors on tourism demand.
3TOURISM AND FLORIDA
Tourism is one of Florida’s oldest and most successful industries, with the industry itself beginning
almost immediately after Florida’s admission into the Union. Part of Florida’s tourism identity has not
changed in the intervening 150 years, with mild winters and coastal beaches forming the core of the
state’s attraction over the years. However, there have been significant transformations. New
inventions like air conditioning, better transportation systems, and a larger, wealthier world population
have all altered Florida’s tourism landscape.
The first visitors to Florida were medical tourists.9 Doctors’ often prescribed warm weather and clean
air to combat consumptive diseases, and a few Florida coastal cities began to advertise themselves as
ideal locations to combat illness. St. Augustine and Key West were the epicenters of Florida’s medical
tourism industry. Yet, the industry was never large due to the hazardous and costly transportation
methods that provided the only means of reaching Florida. Further, the perception of Florida as a
backcountry wilderness kept many people away.
This all changed in the late 1800s due to two billionaires: Henry Flagler and Henry Plant. Both men
invested heavily in railroad construction along Florida’s coasts and built resorts along their new coastal
rail routes.10 Henry Flagler’s construction of an Atlantic rail route opened up south Florida to sizable
numbers of tourists for the first time. Two notable hotels built by them are the Tampa Bay Hotel in
Tampa Bay (now University of Tampa) and the Ponce De Leon Hotel in St. Augustine (now Flagler
University).11 The resorts tended to attract wealthy Northeasterners who vacationed in Florida during
the winter months. The lasting legacies of the two billionaires were the railroad network that opened
up Florida’s coastal communities to tourism and the shift in perception of Florida to being a tourist
mecca.12
Florida’s modern era of tourism came about in the mid‐1900s as a result of multiple developments.
First, the rise in household incomes and the decline in working hours led to the expansion of tourism
across the United States. The average middle‐class family could afford an annual vacation, and Florida
became a popular destination.13 Second, the construction of the U.S. Highway System and the
expansion of the commercial airline industry dramatically lowered transportation costs and made travel
to Florida much faster.14 Finally, the invention and deployment of air conditioning into residential and
commercial areas was key as well. It made Florida a year‐around tourist destination. In periods prior,
the hot temperatures made Florida unappealing during the summer months.15
The opening of Walt Disney World in 1967 was the defining moment for modern tourism in Florida.
Overnight, it changed Orlando’s identity from a rural agricultural area to a tourism town. In 1969, the
City of Orlando estimated 3.5 million tourists visited the area (most of whom were only passing through
9 Revels, T, (2011). Sunshine Paradise: A History of Florida Tourism. University of Florida Press: 5, 7.
10 Clark, J. (2014) A Concise History of Florida. The History Press: 25.
11 Ibid: 77, 86.
12 Revels, T, (2011). Sunshine Paradise: A History of Florida Tourism. University of Florida Press: 56.
13 Thomas Weiss, “Tourism in America Before World War II.” The Journal of Economic History, (June 2004).
14 Ibid.
15 Revels, T, (2011). Sunshine Paradise: A History of Florida Tourism. University of Florida Press: 102.
4on their way to Miami).16 In 2018, Orlando attracted over 75 million tourists, with tourism being the
largest industry in the Central Florida area.17
The Tourism Industry
Tourism, while often described as an industry, is not an industry as defined by the U.S. Census Bureau’s
North American Industry Classification System (NAICS). NAICS defines an industry as a group of
businesses that produce a like product or provide a service, classifying them in accordance with the
goods and services they produce. In contrast, tourists purchase goods and services across all industries
rather than within one specific industry. For example, an average tourist might purchase a plane ticket
(air transportation industry), rent a car upon arrival (ground transportation industry), purchase food and
clothing (food and retail industries), and stay at a hotel (lodging industry). Therefore, the economic
activity called tourism is separately defined by each consumer, based on his or her unique experience
preferences rather than on a particular final good or service being sold.
While it is not possible to examine the industry as a whole, evaluations can look at the various industries
most commonly linked to tourism. A majority of these industries are in the leisure and hospitality sector
of the Florida economy. The leisure and hospitality industry is a service‐providing sector that consists of
two subsectors: the arts, entertainment, and recreation industry group (NAICS 71) and the
accommodation and food services industry group (NAICS 72).18
The leisure and hospitality industry has a significant impact on Florida’s Gross Domestic Product (GDP)
and total employment within the state. A breakdown of the industry can be found in the table below.
In total, the leisure and hospitality industry is responsible for about 7 percent of Florida’s GDP.19 The
Bureau of Labor Statistics (BLS) estimates that Florida’s leisure and hospitality industry employed
approximately 1.4 million people in Florida in 2018. This represents about 13 percent of all jobs in
Florida.20
Gross Domestic Product and Employment in Florida's Leisure and Hospitality Industry 2018
GDP (In
Employment
Millions of GDP Employment
Florida (In
Current (Percentage) (Percentage)
Thousands)
Dollars)
Total Private industries 935,080 100.0% 11,274 100.0%
Leisure and Hospitality Industry 63,838 7.0% 1,447 12.8%
Subsector
Performing arts and Sport Industry 7,007 0.8% 164 1.5%
Amusement and Recreation Industries 10,032 1.1% 207 1.8%
Accommodation 16,264 1.8% 206 1.8%
Food services and Drinking places 30,534 3.4% 870 7.7%
Source: U.S. Bureau of Economic Analysis
16 Ibid: 122.
17 Visit Orlando (May 10, 2019) “Orlando Announces Record 75 Million Visitors, Solidifies Ranking as No. 1 U.S. Travel
Destination.” https://www.globenewswire.com/news‐release/2019/05/10/1821626/0/en/Orlando‐Announces‐Record‐75‐
Million‐Visitors‐Solidifies‐Ranking‐as‐No‐1‐U‐S‐Travel‐Destination.html
18 U.S. Bureau of Economic Analysis, “Industries at a Glance: Leisure and Hospitality.” www.bls.gov.
19 U.S. Bureau of Economic Analysis, “Gross Domestic Product (GDP) by State and Industry (millions of current dollars).”
(November 23, 2020). www.bea.gov.
20 U.S. Bureau of Labor Statistics, “State and Area Employment, Hours, and Earnings.” (November 23, 2020). www.bls.gov.
5The leisure and hospitality industry also proved to be a resilient part of Florida’s economy, recovering
more quickly from the Great Recession than other parts of the economy. In particular, tourism‐related
jobs grew the fastest among all jobs in Florida. For example, the Accommodation & Food Services
employment sector is large, and until the coronavirus pandemic, had been growing faster than overall
employment in the state. This industry sector is closely related to the health of Florida’s tourism
industry that reached almost 130 million visitors in FY 2018‐19, an increase of 5 percent over FY 2017‐
18.
However, the discussion above provides only a rough approximation of the benefits of the tourism
industry to Florida’s economy. It is unrealistic to attribute all of Florida’s leisure and hospitality industry
to out‐of‐state tourists, because Florida residents are consumers of these services as well. Even if
Florida received zero out‐of‐state tourists, the state would still have a leisure and hospitality industry
(although on a much smaller scale).
This proxy for all impacted industries also fails to account for the indirect and induced effects of out‐of‐
state tourism. An indirect effect is defined as the changes in employment, income and output by
industries that provide goods and services to tourism‐related industries. One example is a food
manufacturing plant that hires additional employees to fulfill a food order placed by Walt Disney World.
An induced benefit is defined as the increase in sales due to household spending from income earned in
a tourism‐related industry. An example is a homebuilder selling houses to employees of a Miami Beach
hotel. Both of these examples demonstrate how out‐of‐state tourism impacts industries outside the
leisure and hospitality industry.
Tourism Impact Studies
A wide array of studies have measured the economic impact of tourism on Florida. Most of them were
limited to the impact of tourism on a specific Florida county or region of Florida, and they were typically
performed or commissioned by a local destination marketing organization (DMO).21 This class of studies
generally follows a similar methodology. First, the studies estimate the total number of tourists who
visited the area. Second, the studies determine how much each tourist spent and where the money was
spent. Some of the more advanced studies will then estimate the indirect and induced effects of the
spending. Even more detailed studies will estimate the amount of jobs created and taxes generated by
the spending.
As a class, these studies have produced vastly different results. Some of the notable and more recent
examples include a Greater Miami Convention & Visitors Bureau estimate that the Miami area attracted
16.3 million overnight tourists in 2019, adding approximately $16.3 billion to the local economy.22 A
Hillsborough County study found that 9.7 overnight visitors in 2019 added about $3.3 billion to the local
economy.23 A 2015 Jacksonville study estimated that visitors spent about $2 billion dollars and
21 The Florida Statutes [s. 288.923(2)(c), F.S.] define a county destination marketing organization as “public or private agency
that is funded by local option tourist development tax revenues under s. 125.0104, or local option convention development tax
revenues under s. 212.0305, and is officially designated by a county commission to market and promote the area for tourism or
convention business or, in any county that has not levied such taxes, a public or private agency that is officially designated by
the county commission to market and promote the area for tourism or convention business.”
22 Greater Miami Convention & Visitors Bureau, “2019 Visitor Industry Overview”, (2020): 3, 8‐9. Seventy‐five percent were
international and domestic out of state visitors. https://www.miamiandbeaches.com/Miami/media/GMCVB‐
Corporate/Research%20Statistics/2019_Visitor_Industry_Overview_051320.pdf
23 Tourism Economics, “Economic Impact of Tourism in Hillsborough County, 2019”: 17.
https://static1.squarespace.com/static/5a26e699a9db09544e1cb940/t/5f07314669f7521d85f16d4b/1594306889423/Hillsboro
ugh+County+2019+Economic+Impact+Report.pdf
6sustained more than 30,400 area jobs.24 A 2012 study of Palm Beach County estimated that 1.7 million
people visited the county’s beaches and spent $81.9 million dollars during their visit.25
A recent report commissioned by VISIT FLORIDA looked at the economic impact of out‐of‐state visitors
to Florida in 2018.26 The study estimated that out‐of‐state tourists spent nearly $94 billion dollars and
supported more than 1.5 million jobs in Florida.27 The study also estimated that out‐of‐state tourist
spending increased by a total of 18 percent over the past 5 years.28 The major industries impacted by
the spending were: food and beverage, recreation, lodging, and transportation‐related services. The
report estimated that tourism spending generated over $12 billion dollars in state and local taxes.29
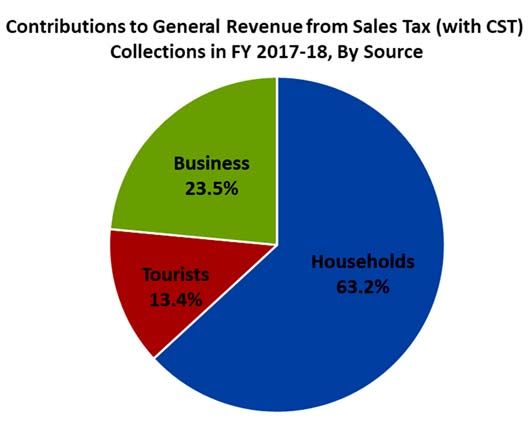
In an independent study, the Office of Economic and Demographic Research performed an empirical
analysis to identify the sources of the state’s sales tax collections. In Fiscal Year 2017‐18, sales tax
collections provided $24.14 billion dollars to Florida’s total General Revenue collections. Of this
amount, 13.4 percent ($3.2 billion) is attributable to purchases made by tourists.30 [See Table and
Graph below.]
FY 2017‐18: Contributions to General
Revenue From Sales Tax Collections
(with CST) By Source ($ Billions)
Category Total Amount Percentage
Households $15,244.16 63.2%
Tourists $ 3,223.96 13.4%
Business $ 5,670.58 23.5%
Total $ 24,138.70 100.0%
24 Tourism Economics, “The Economic Impact of Tourism in Jacksonville, FL”, (June 2016): 2, 11. The report also stated that
nearly 70% of all visitor spending came from overnight visitors, and domestic visitors comprise 93% of all visitor spending.
https://s3.amazonaws.com/visitjax‐2018/craft‐images/files/2015_economic_impact_report.pdf
25 William Stronge, “Economic Impact of Beach Tourism: Florida and Palm Beach County.” (2013).
https://www.fsbpa.com/13AnnualConfPresentations/StrongeW.pdf
26 “Picking up the Pace: Florida’s Tourism Performance Jumps into a Higher Gear: The 2018 Contribution of Travel & Tourism to
the Florida Economy,” Rockport Analytics, https://www.visitflorida.org/media/30679/florida‐visitor‐economic‐large‐impact‐
study.pdf The study did not estimate VISIT FLORIDA’s marketing impact; but rather, the general economic impact of out‐of‐
state tourism in Florida.
27 Ibid: 4.
28 Ibid: 11.
29 Ibid: 15.
30 State of Florida Long‐Range Financial Outlook, fiscal years 2021‐22 through 2023‐24, September 10, 2020: 5.
http://edr.state.fl.us/Content/presentations/long‐range‐financial‐outlook/3YearPlanLBCPresentationFall2020_9‐10‐20.pdf
7THE DETERMINANTS OF TOURISM DEMAND
The previous section discusses the economic impact of tourism, but it does not give the reasons why
out‐of‐state tourists visit Florida. In this section, the analysis explores the determinants of out‐of‐state
tourism demand. Tourism demand is defined as the aggregate total of persons who travel to a tourist
destination. Determinants of tourism demand are the significant factors that induce the individuals to
travel to a particular destination. Each decision to visit Florida can be attributed to one or several
factors. For example, a Pennsylvania family decides to visit Tampa Bay because the wife recently
received a raise at work, the children want to vacation near a beach, the father is an avid baseball fan,
and a VISIT FLORIDA web advertisement highlighted great hotel deals in the Clearwater area. In this
scenario, personal economic health, Florida’s beaches, Spring Training and VISIT FLORIDA were all
factors that led to this family’s decision to visit Florida.
The first part of this section focuses on broad determinants of tourism demand. These issues affect
tourism demand across the world, including Florida. The second part focuses on unique drivers of
tourism demand in Florida.
The Broad Determinants of Tourism Demand
Income
Income is the greatest universal determinant of tourism demand. Rising incomes were the primary
reason for the expansion of the tourism industry after World War II and are still a factor today.31 Most
recently, rising incomes in China led to an explosion in Chinese tourists coming to the United States
before worsening trade relations and the onset of the pandemic.32
The relationship between income and tourism is straightforward. Rising incomes lead individuals to
spend more on discretionary goods and services. Tourism is a discretionary good. As incomes rise,
tourism demand increases. When incomes fall, tourism demand drops.
For this reason, income is the most widely‐used explanatory variable in the academic studies of tourism
demand.33 Almost all studies find a significant, positive relationship between income and total tourist
visitors. It is such a strong factor that the literature review failed to find a single study which did not
include some proxy for income in the analysis. Further, a meta‐analysis study found tourism demand to
be highly responsive to changes in income.34 The study estimated that every increase in incomes of one
percent leads to a 1.74 percent increase in North American travel abroad. The analysis also found that
different cultures react differently, but always positively, to higher incomes. For example, Asian
countries, on average, increased international travel by 4.45 percent for every one percent increase in
income. On the other hand, South American countries are less responsive to income. For every one
percent increase in South American income, international travel increased by only 0.28 percent.35
31 Thomas Weiss, “Tourism in America Before World War II.” The Journal of Economic History, June 2004.
32 Kelly Craighead, “U.S.‐China Tourism Year 2016.” International Trade Administration Tradeology, (December 1, 2016).
https://blog.trade.gov/2016/12/01/u‐s‐china‐tourism‐year‐2016/. Notably, the volume of Chinese tourist peaked in 2017, and
has dipped significantly in 2020. https://www.statista.com/statistics/214813/number‐of‐visitors‐to‐the‐us‐from‐china/
33 Jana Vencovska, “The Determinants of International Tourism Demand.” Charles University in Prague, Bachelor Thesis,
(2013/2014): 15.
34 Geoffrey I. Crouch, “A Meta‐Analysis of Tourism Demand.” Annals of Tourism Research. Vol.22. 1995.
35 Ibid: 10.
8The most common proxy for income is Gross Domestic Product (GDP). Gross Domestic Product has
historically been highly correlated with income. The graph below demonstrates the relationship
between tourism and GDP.36 During periods of a global GDP economic recession (2002, 2009)
international tourism fell. During periods of consistent positive GDP growth (2004‐2007, 2010‐2018),
international tourism grew.
Year to Year Percentage Change in International Tourism Arrivals
15.00%
10.00%
5.00%
0.00%
2001 2002 2003 2004 2005 2006 2007 2008 2009 2010 2011 2012 2013 2014 2015 2016 2017 2018
‐5.00%
‐10.00%
WLD USA GBR AUS
‐15.00%
Price Level
The tourism industry is a competitive marketplace. In this regard, Florida competes with other states
and foreign countries for tourists. For example, a tourist in Canada wants to vacation at a beach.
Florida has many options (Miami, Tampa Bay, Key West), but other attractive options exist outside of
Florida, like Jamaica or Hawaii. One way a tourist can select among options is through price. Will the
Florida vacation be cheaper, similar or more expensive than the alternative vacation? If the price
difference is substantial, then it might become the determining factor.
The academic research generally includes a price variable whenever tourism demand is modeled. The
most‐widely used variable is the Consumer Price Index (CPI). CPI is a price‐level measurement of a
market basket of consumer goods. CPI’s are widely‐available (at both the state and country‐level) and
can be cross compared. Several studies using CPI as a proxy for price have found that it is a factor in
tourism demand.37
Another proxy for price is transportation costs. Transportation costs, like airplane fares, can be the most
costly vacation‐related purchase and—because of that—play an outsized role in the decision of where
to travel. A 1994 meta‐analysis study found that every one percent increase in transportation costs led
36 Compiled from data from The World Bank, International Tourism, Number of Arrivals, 2000‐2018.
https://data.worldbank.org/indicator/ST.INT.ARVL?end=2018&name_desc=false&start=1995&view=chart
37 C.L Morley, “The Use of CPI for Tourism Prices in Demand Modelling.” Tourism Management.Vol.15. 1994. & Jeffrey A.
Rosensweig, “Elasticities of Substitution in Caribbean Tourism.” Journal of Development Economics. Vol 29. July 1988.
9to international travel decreasing by 0.85 percent.38 One study of U.S. tourism and gasoline prices found
a negative relationship between the two. As oil prices go up, tourism demand goes down.39 Since
Florida attracts a large number of international tourists and domestic tourists from the Northeast who
spend a considerable amount on either airline tickets or gasoline to travel here, transportation costs can
disproportionately impact Florida relative to other destinations. In particular, Florida’s out‐of‐state
tourism is likely more sensitive to transportation costs than other states where tourism demand is more
regionally‐based.40
Exchange Rate
Exchange rates are a component of price level. However, exchange rates are so important to tourism
demand that many researchers include a separate variable for them when modeling tourism demand.41
One study argued that tourists are more aware of exchange rates than any other price factors.42 In
addition, the relative volatility of exchange rates is a necessary consideration whenever an international
tourist is planning a trip. Most studies have found a strong and significant relationship between
exchange rate fluctuations and tourism demand.43
International tourists represented about 11 percent of all the out‐of‐state tourists in Florida during the
review period. A majority of these tourists are impacted by the exchange rates. If the U.S. dollar
appreciates in value, the price of a Florida vacation increases. If the U.S. dollar depreciates in value, the
price of a Florida vacation decreases. The top 4 origin markets for international visitors to Florida and
their exchange rate fluctuations relative to the U.S. dollar during the review period are identified in the
table below.44 The table clearly shows the high volatility in costs facing international tourists wanting to
travel to Florida. For example, in 2019, it cost an Argentinian tourist 42 percent more to purchase one
U.S. dollar than in 2018. This massive depreciation of their currency impacts any Argentinian’s decision
to travel to Florida.
Currency Exchange Fluctuation: The Annual Percent Change in the Cost of One
U.S. Dollar
Country Currency 2015 2016 2017 2018 2019
Canadian
Canada Dollar 14% 4% ‐2% ‐4% 2%
United Kingdom Pound 7% 12% 5% ‐8% 4%
Brazil Real 29% 5% ‐9% 9% 7%
Argentina Peso 12% 37% 11% 39% 42%
Source: Annual Exchange Rates, Internal Revenue Service
38 Geoffrey I. Crouch, “A Meta‐Analysis of Tourism Demand.” Annals of Tourism Research. Vol.22. 1994:10.
39 Kate Walsh and Cathy A. Enz, “The Impact of Gasoline Price Fluctuations on Lodging Demand for US Brand Hotels.” Cornell
University School of Hotel Administration Collection. Vol.12. 2004.
40 For example, Iowa’s annual tourism report does not even report international tourism numbers. Instead, the annual report
focuses entirely on domestic visitor rates and spending. Similarly, North Dakota’s annual report focuses heavily on visitors who
originate from bordering states.
41 Christine Lim, “A Meta‐Analytic Review of International Tourism Demand.” Journal of Travel Research. Vol.37. 1999.
42 J. Artus, “An Econometric Analysis of International Travel.” International Monetary Fund Staff Papers. 1972.
43 Geoffrey I. Crouch, “A Meta‐Analysis of Tourism Demand.” Annals of Tourism Research. Vol.22. 1994:10.
44 International Revenue Service, “Yearly Average Exchange Rates for Converting Foreign Currencies into U.S. Dollars.”
www.irs.gov.
10Friends and Relatives
Studies have estimated that visiting friends and relatives (VFR) accounts for a large share of all tourism
across the world.45 A United Nations report estimated that 27 percent of international tourists travelled
to visit friends and relatives, for religious reasons and pilgrimages, and health treatment.46 For some
specific countries, these rates are even higher. Australia has VFR rates of over 45 percent for certain
states within that country.47 VISIT FLORIDA’s Direct Influencer Study lists “Visiting Family & Friends” as
the second highest ranking reason for visiting Florida.48
In terms of the economy, researchers typically do not value VFR tourism as strongly as other forms of
tourist demand. This occurs for several reasons.49 First, VFR‐related tourists tend, on average, to spend
less than non‐VFR tourists. Many goods and services traditionally purchased by tourists will be provided
instead by their friends or relatives (i.e. lodging, food). Second, VFR tourists are already influenced and,
therefore, not as responsive to tourism marketing or other policy actions. However, this is not to say
that VFR tourists are completely unaffected by the other tourism determinants. On average, VFR
tourists stay longer and spend more in attractive destination markets than regular markets. For
example, a VFR tourist will stay longer and spend more in Orlando than in a non‐tourist city like Akron,
Ohio.
The Unique Determinants of Tourism Demand in Florida
Florida Beaches, a Natural Brand
Beaches have always been Florida’s iconic brand. One of the original selling points 150 years ago, they
continue to attract out‐of‐state visitors to Florida today. A 2017 survey of local DMOs conducted by EDR
asked: “What makes Florida attractive to tourists?” The most popular response was beaches. While
total beach visitation rates do not exist, hotel and motel data provide us a reasonable proxy for the
popularity of beaches and their impact on Florida’s tourism economy. In 2020, 71 percent of all
registered lodgings in Florida were located in coastal Florida counties.50 Furthermore, removing the
theme park‐laden Central Florida region (Osceola and Orange Counties) increases that percentage to
84.2 percent of all lodgings. This percentage is a significant indicator of the relationship between
beaches and Florida tourism.
Academic research into the topic of beaches and tourism demand finds an overwhelmingly positive
relationship. One study found that beaches underpin many coastal economies around the world.51
Over the past 30 years, the study found a shift in U.S. coastal economies from traditional maritime
45 Richard Gitelson and Deborah Kerstetter, “The Influence of Friends and Relatives in Travel Decision‐Making.” Journal of
Travel & Tourism Marketing. Vol.3. 1994.
46 United Nations World Tourism Organization, “UNWTO Tourism Highlights: 2015 Edition.” United Nations, 2015: 4.
https://www.e‐unwto.org/doi/epdf/10.18111/9789284416899
47 Dr. Sarah Gardiner and Dr. Noel Scott, “Australian Tourism Demand for Domestic Travel Experiences: Insights for the Gold
Coast.” Griffith Institute for Tourism Research Report Series, Report No.7. August 2015.
48 “VISIT Florida Direct Influencer Study, 2017‐18,” VISIT FLORIDA, 2019.
49 Elisa Backer, “VFR Travelers – Visiting the Destination or Visiting the Hosts?” Asian Journal of Tourism and Hospitality
Research, Vol. 2(1). April 2008.
50 Thirty‐four of Florida’s 67 counties are coastal counties. Registered lodgings include hotels, motels, apartments, bed and
breakfasts, vacation rentals and timeshares. Retrieved from the Public Records Center, Florida Department of Business and
Professional Regulation, November 3, 2020.
51 Y.L. Kein, J.P. Osleeb and M.R. Viola, “Tourism‐Generated Earnings in the Coastal Zone.” Journal of Coastal Research, Vol.20.
2004.
11activities to beach tourism. Another study found that “sandy beaches” are a strong determinant of both
international and domestic tourists.52 A 2010 study of Florida beaches found that beach quality has a
dramatic, positive impact on the local tourism economic sector.53
Theme Parks
Central Florida has four of the 10 busiest theme parks in the world.54 The Magic Kingdom at Walt Disney
World is number one worldwide, attracting over 20.96 million visitors in 2019.55 The Themed
Entertainment Association (TEA) estimates that the eight major theme parks in Florida recorded almost
89 million admissions in 2019.56 [See Table below.] The identification of Florida with theme parks began
in 1967 with the opening of Disney World. The subsequent expansion of Disney and the opening of
competitor parks established the Central Florida region as a theme park destination. Today, Florida’s
theme parks and resorts gross over $15.4 billion in revenue annually.57 The 2019 Visit Florida report
estimated that 33 percent of all domestic out‐of‐state tourists visit the Central Florida region.58
Theme Park Attendance in Florida
Amusement Park 2015 2016 2017 2018 2019
Disney World Magic Kingdom 20,492,000 20,395,000 20,450,000 20,859,000 20,963,000
Epcot 11,798,000 11,712,000 12,200,000 12,444,000 12,444,000
Animal Kingdom 10,922,000 10,844,000 12,500,000 13,750,000 13,888,000
Hollywood Studios 10,828,000 10,776,000 10,772,000 11,258,000 11,483,000
Islands of Adventure 8,792,000 9,362,000 9,549,000 9,788,000 10,375,000
Universal Studios 9,585,000 9,998,000 10,198,000 10,708,000 10,922,000
Sea World ‐ Orlando 4,777,000 4,402,000 3,962,000 4,594,000 4,640,000
Busch Gardans ‐ Tampa 4,252,000 4,169,000 3,961,000 4,139,000 4,180,000
Total Attendance 81,446,000 81,658,000 83,592,000 87,540,000 88,895,000
Source: 2015‐2019 AECOM Global Attractions Attendance Report
Theme parks are strong determinants of tourism demand because they offer goods and services that
have limited substitutability. Even though there are competing theme parks across the United States
and the world, some theme park rides or services are only available in Orlando. The companies
controlling these theme parks have a great interest in promoting their Florida locations. The major
theme parks advertise heavily across the world to attract tourists.
52 Laura Onofri and Paulo Nunes, “Beach ‘lovers’ and ‘greens’: A Worldwide Empirical Analysis of Coastal Tourism.” Ecological
Economics, Vol.88. 2013.
53 Yehuda Klein and Jeffrey Osleeb, “Determinants of Coastal Tourism: A Case Study of Florida Beach Counties.” Journal of
Coastal Research, 2010.
54 “TEA/AECOM 2019 Theme Index and Museum Index: The Global Attractions Attendance Report 2019.” Themed
Entertainment Association (TEA), 2019: 12.
https://aecom.com/wp‐content/uploads/documents/reports/AECOM‐Theme‐Index‐2019.pdf
55 Ibid.
56 Ibid: 35.
57 The revenue estimate was based on a review of the annual reports of Disney, Comcast Universal (corporate owner of
Universal Studios), and the Sea World Corporation.
58 Share of Visitors by Destination Region, 2018‐2019 Visitor Study, VISIT FLORIDA.
12The Cruise Line Industry
Florida has the largest domestic cruise industry in the United States.59 In 2019, over 18 million
passengers embarked from one of Florida’s seaports on a cruise.60 [See Table below.] It is likely that the
majority of these passengers were out‐of‐state visitors.61 While much of the visitor’s spending occurs
onboard the ship or at port‐of‐calls, most out‐of‐state tourists will spend additional days in Florida either
before or after the cruise.62
Total Cruise Passengers at Florida Seaports (2012‐2019)
Port 2012 2013 2014 2015 2016 2017 2018 2019
Port Miami 3,774,452 4,078,529 4,939,062 4,915,576 4,980,284 5,340,559 5,552,075 6,823,816
Port Canaveral 4,004,283 3,986,994 4,193,005 4,168,666 4,248,296 4,526,626 4,841,003 4,885,314
Port Everglades 3,757,320 3,600,636 4,001,354 3,773,386 3,826,415 3,863,662 3,870,342 3,892,215
Port Tampa Bay 974,259 854,260 888,343 867,114 813,800 960,901 1,043,329 1,149,289
Port of Key West 906,068 832,887 800,752 804,624 696,224 818,866 865,909 913,323
JAXPORT 390,852 371,263 363,994 366,021 392,822 177,417 199,899 194,665
Palm Beach 341,004 345,827 364,829 350,932 502,876 432,585 462,674 449,457
Total 14,148,238 14,070,396 15,551,339 15,246,319 15,460,717 16,120,616 16,835,231 18,308,079
Source: Florida Ports Council
59 “Contribution of the International Cruise Industry to the U.S Economy in 2018,” Cruise Lines International Association, August
2019, p. 45. https://cruising.org/‐/media/research‐updates/research/contribution‐of‐the‐international‐cruise‐industry‐to‐the‐
us‐economy‐2018.ashx
60 Florida Ports Council, “Florida’s Seaports: High Performance 2017/2021”, Florida Seaport Transportation and Economic
Development Council, April 10, 2017, pp. 47‐48. https://s3.amazonaws.com/fla‐ports‐resources/2017‐2021‐Seaport‐Mission‐
Plan.pdf
Florida Ports Council, “Pathway to Prosperity 2019/2023.” Florida Seaport Transportation and Economic Development Council,
May 2, 2019, pp. 38‐39. https://smhttp‐ssl‐63157.nexcesscdn.net//wp‐content/uploads/2019‐2023‐FLPorts_Ports_SMP‐
web.pdf
Florida Ports Council, “Focused on the Future 2020/2024.” Florida Seaport Transportation and Economic Development Council,
June 23, 2020, pp. 40‐41. https://fla‐ports‐resources.s3.amazonaws.com/2020‐08‐27_FLPorts_Ports_SMP_spreads‐v6.pdf
61 This is based on the concentration of U.S. cruise ports in Florida and research on the volume of cruise passengers arriving to
the ports via air. See “Contribution of the International Cruise Industry to the U.S Economy in 2018,” Cruise Lines International
Association, August 2019: 45. https://cruising.org/‐/media/research‐updates/research/contribution‐of‐the‐international‐cruise‐
industry‐to‐the‐us‐economy‐2018.ashx;
Martin Associates, “The 2016 Economic Impact of Port Canaveral”, Canaveral Port Authority, March 20, 2013: 26.
https://www.portcanaveral.com/PortCanaveral/media/Publications/canaveral_impact_report_2016_FINAL.pdf; and
Martin Associates, “The 2012 Economic Impact of Port Canaveral”, Canaveral Port Authority, March 20, 2013: 27.
https://www.portcanaveral.com/PortCanaveral/media/Publications/2012‐Impact‐Study_1.pdf
62 Ibid.
13STATE‐SPONSORED ADVERTISING AND TOURISM
The previous section identified the many of the significant determinants of tourism demand. Another
determinant is tourism marketing by local, state and national Destination Marketing Organizations
(DMOs).
VISIT FLORIDA is Florida’s official Destination Marketing Organization.63 VISIT FLORIDA’s mission is to
promote and drive visitation to and within the state of Florida. It strives to establish Florida as the
number one travel destination in the world.64 It promotes tourism through industry relations,
marketing, branding, new product development, promotions, public relations, sales, and visitor services,
both domestically and internationally. Among its activities, VISIT FLORIDA:
Conducts domestic and international marketing activities;
Administers domestic and international advertising campaigns;
Conducts research on tourism and travel trends;
Manages the state's welcome centers; and
Administers several reimbursement grant programs. 65
VISIT FLORIDA also partners with businesses, destinations, and local DMOs throughout the state.66
Altogether, VISIT FLORIDA serves more than 13,000 tourism industry businesses.67
State funding for VISIT Florida was $76 million per year during the three year review period. For the
three‐year periods, the increase in state payments was 8.3 percent from FYs 2013‐14 through 2015‐16,
and 97.4 percent from FYs 2010‐11 through 2012‐13.68 The U.S Travel Association reports the average
amount of state tourism funding was $21 million in FY 2018‐19.69 The states with more heavily
concentrated tourism industries tend to have larger amounts of state tourism funding. For example, the
marketing budgets in FY 2017‐18 for California, Hawaii and New York were $120 million, $82 million, and
$70 million, respectively.70
63 The Florida Tourism Industry Marketing Corporation, which operates under the name VISIT FLORIDA, is a statutorily created
Direct‐Support Organization (DSO) of Enterprise Florida, Inc. (EFI). See s. 288.1226, F.S. Pursuant to s. 288.923, F.S., the
Division of Tourism Marketing within EFI contracts with VISIT FLORIDA to execute tourism promotion and marketing services for
the state. EFI appoints thirty‐one tourism‐industry‐related members representing all geographic areas of the state to the DSO’s
Board of Directors. Functioning as division staff, VISIT FLORIDA must develop a four‐year marketing plan, which is annually
reviewed and approved by the EFI board of directors.
64 https://www.visitflorida.org/about‐us/what‐we‐do/
65 https://oppaga.fl.gov/ProgramSummary/BackPageDetail?programNumber=6112&backPageNumber=05
66For a directory of Florida’s 55 DMOs, see https://dos.myflorida.com/cultural/info‐and‐opportunities/resources‐by‐
topic/cultural‐tourism‐toolkit/directory‐of‐florida‐direct‐marketing‐organizations‐dmos/ &
https://www.fadmo.org/index.php?option=com_mcsearchresults&view=search&uuid=db960a2c‐c501‐4bf6‐91d9‐
a299122b16e8#/
67 As reported in VISIT Florida’s Annual Report, Fiscal Year 18‐19: 5.
https://www.visitflorida.org/media/84139/yearinreview2019.pdf
68 VISIT Florida is also required to match the state appropriation with private funding in the form of cash contributions, fees for
services, cooperative advertising and in‐kind contributions. See s. 288.1226(6), F.S.
69 Funding may be exclusively from public sources, or a combination of public and private sources.
https://www.ustravel.org/sites/default/files/media_root/document/Research_Fact‐Sheet_STO‐Infographic.pdf
70 As reported in VISIT FLORIDA’s 2019‐20 Marketing Plan Overview, 2019: 27.
https://www.visitflorida.org/media/84139/yearinreview2019.pdf
14In general, the academic research has been positive regarding the effectiveness of state‐sponsored
tourism advertising. A majority of the studies have concluded that state‐sponsored tourism advertising
can be a determining factor in a tourist’s decision to visit. The academic research has measured
advertising effectiveness through two separate methodological approaches. The first approach is
through conversion studies. Conversion studies measure the percentage or probability that tourists will
visit a destination after being exposed to DMO advertising of that destination. The second approach
measures the statistical relationship between total visitor levels and state DMOs’ spending.
Of the two methods, conversion studies are more widely used. The earliest academic study looked at
the effectiveness of state DMO advertising in magazines.71 The study sampled individual households
that had requested state travel information from coupons clipped from magazine adverts. The
researchers calculated a benefit‐to‐cost ratio of $32.78 across 8 magazine advertisements. Later studies
have followed similar methodologies, while expanding the analysis to cover DMO advertising
effectiveness across different media channels, like television and radio. These studies have also
returned positive results, but the economic impact has varied significantly between the studies.72 This
could be due to empirical differences in the quality of the advertisement or the media channel itself—or
to methodological inadequacies involving the overall study.
The chief criticism of these studies has been the inadequacy of the conversion methodology.73 The
original 1974 study was criticized for upwardly biased results.74 Subsequent studies have improved the
methodology, but have not completely controlled for issues related to inadequate sample sizes, the
inclusion of individuals already planning on traveling to the destination, low survey response rates and
recall bias. Later studies in the 1980s and 1990s better controlled for these biases by introducing larger
sample sizes, factoring out individuals already planning on traveling to the destination and by increasing
the response rates of participants.75 Even with all of these improvements, one prominent academic
concluded that conversion rates fail to answer the fundamental question of whether DMO advertising
was the deciding factor in the individual’s visit to the state.76 The researcher insists that conversion
studies are only helpful in comparing the performance of different DMO advertisements.
Nevertheless, conversion studies are the primary tool used by state DMOs to measure marketing
effectiveness. These studies are usually performed by private consulting groups to determine the
effectiveness of specific DMO advertising campaigns. The reports generally do not measure the
effectiveness of the entire state DMO budget. Typically, the methodology requires analyzing advertising
awareness among targeted groups and extrapolating how the incremental increase in awareness
translates into additional trips to the DMO’s state. One such company, OmniTrak Marketing Group,
estimates the impact by taking the difference of trips to the state between the ad‐aware and ad‐
71 Arch Woodside and David Reid, “Tourism Profiles Versus Audience Profiles: Are Upscale Magazines Really Upscale?” Journal
of Travel Research¸Vol.12.1974.
72 These late studies include: Edward McWilliams and John. L Crompton, “An Expanded Framework for Measuring Effectiveness
of Destination Advertising.” Tourism Management. Vol.18. 1997. Also: Stephen Pratt, Scott McCabe, Isable Cortes‐Jimenez,
and Adam Blake, “Measuring the Effectiveness of Destination Marketing Campaigns: Comparative Analysis of Conversion
Studies.” Journal of Travel Research, Vol.49. 2010. See also: David Butterfield, Kenneth R. Deal, and Atif Kubursi, “Measuring
the Returns to Tourism Advertising.” Journal of Travel Research, Vol.37. August 1998.
73 Arch Woodside, “Measuring Advertising Effectiveness in Destination Marketing Strategies.” Journal of Travel Research, Fall
1990.
74 James Bueke and Richard Gitelson, “Conversion Studies: Assumptions, Applications, Accuracy and Abuse.” Journal of Travel
Research, Winter 1990.
75 Ibid.
76 Arch Woodside, “Tourism Advertising and Marketing Performance Metrics.” Tourism and Hospitality Research, Vol.4. 2010.
15unaware populations. This difference is then multiplied by tourist spending to determine the total
direct tax revenue to state and local governments. The OmniTrak metric for VISIT FLORIDA’s FY 2018‐19
integrated marketing campaign was 6:1 to 12:1.77
As an alternative to conversion studies, academics have examined the statistical relationship between
DMO tourism marketing budgets and the inflow of international tourists. In these analyses, the DMO is
just one of the many tourism determinants used in the study. The other determinants include the
variables discussed in the “The Determinants of Tourism Demand” section of the paper.
Most of these studies also found positive results. One study of DMOs in Australia found a positive
relationship between DMO expenditures and the number of international tourists visiting Australia.78 A
1995 meta‐analysis study of existing tourism demand studies also found marketing expenditures to be
positively associated with international tourism.79 However, the authors noted that the impact of
marketing expenditures was considerably lower than other determinants of tourism demand. In this
same vein, a study of tourism demand in the Canary Islands found marketing promotion to have a
positive, but small effect on total tourists.80
The studies also concluded that the impact of tourism marketing varies considerably among countries.
The 1995 meta‐analysis study found that Latin American and North American tourists were influenced
the most by DMO advertising.81 At the other end of the scale, Oceania and Southern European
countries appear to respond the least to tourism advertising. A study of Australia’s tourism advertising
efforts to different foreign countries found considerable differences in the advertising’s effectiveness.
For example, tourism advertising to the New Zealand market netted a 36:1 return, while the same
advertising to the United Kingdom market netted only a 3:1 return.82 Another review concluded that
the primary reasons why effectiveness is hard to quantify are: (a) “different nationalities and cultures
are likely to respond differently to marketing, and (b) different destinations vary in their ability to use
marketing effectively.”83
EDR’s literature review was unable to identify any academic research regarding the statistical
relationship between state tourism budgets and total tourism (including domestic and international
tourists). This is likely due to data issues. It is very difficult to accurately track domestic tourism travel,
and most countries do not bother to do so. In the United States, it is up to the individual states to
estimate and report tourism numbers. Due to the decentralized process, it is likely every state has its
own tourism methodology. This leads to questions concerning the quality and accuracy of the visitor
data.
The literature review did produce one policy paper that evaluated the economic impact of state‐funded
tourism promotion. The 2016 paper looked at whether certain leisure and hospitality industries
77 “VISIT FLORIDA Integrated Marketing Effectiveness Study, FY 2018‐19.” OmniTrak Group: 128.
78 Nada Kulendran and Larry Dwyer, “Measuring the Return from Australian Tourism Marketing Expenditure.” Journal of Travel
Research, Vol.47. 2009.
79 Geoffrey I. Crouch, “A Meta‐Analysis of Tourism Demand.” Annals of Tourism Research. Vol.22. 1995.
80 F. Ledsema‐Rodriquez, M. Navarro‐Ibanez, and J. Perez‐Rodriguez, “Panel Data and Tourism Demand. The Case of Tenerife.”
March 1, 2001.
81 Geoffrey I. Crouch, “A Meta‐Analysis of Tourism Demand.” Annals of Tourism Research. Vol.22. 1995.
82 Nada Kulendran and Larry Dwyer, “Measuring the Return from Australian Tourism Marketing Expenditure.” Journal of Travel
Research, Vol.47. 2009.
83 Larry Dwyer & P. Forsyth, International Handbook on the Economics of Tourism, Edward Elgar Pub: 71.
16benefited from state‐funded tourism promotion.84 The policy paper included promotional expenditures
from 48 states over 39 years. The study found a positive, but very weak, relationship between the
variables. The study concluded that for every $1 million increase in state tourism promotion spending,
there was only $20,000 in added revenue for the accommodations industry.
84Dr. Michael Hicks and Michael D. LaFaive, “An Analysis of State‐Funded Tourism Promotion.” Mackinac Center For Public
Policy. November 1, 2016.
17STATE DMOs ADAPT TO THE COVID‐19 PANDEMIC
While the on‐going COVID‐19 pandemic has affected many segments of the US economy, it has
impacted the tourism industry the most.85 In this regard, Florida’s tourism‐sensitive economy is
particularly vulnerable to the longer‐term effects of the pandemic. Previous economic studies of
disease outbreaks have shown that it can take as much as 12 to 15 months after the outbreak ends for
tourism to return to pre‐disease levels. The magnitude of this event is greater. The total number of
tourists declined ‐60.3 percent from the prior year in the second quarter of 2020. After that
breathtaking decline, tourism in the third quarter managed to recover to 35.4 percent of the prior year’s
level, buttressed by the stronger than anticipated number of domestic visitors travelling by car. Several
industry groups have already predicted that it will take at least two years to reach recovery from this
pandemic. Current expectations are that leisure driving vacations will recover first, and then—in
order—business travel, domestic air travel, and international travel.
VISIT FLORIDA, Florida’s official Destination Marketing Organization (DMO), and DMOs in other states
market to international and out‐of‐state domestic visitors, both business and leisure travelers. They
promote the destinations, amenities, events, natural resources and experiences unique to their
individual states. Some DMOs conduct extensive research to guide their marketing efforts. The mission
of these DMOs is to stimulate and capture the demand for travel, tailoring their marketing to existing
conditions. This is especially important in the current environment.
A recent report from Skift Research and McKinsey & Company on the status of the travel industry
offered insights and proposals, many of which are applicable to State DMOs.86 The report noted that
“travelers are keen to travel but are restrained in the leisure space by the inability to do anything
meaningful at the destination, due to necessary public health measures and safety precautions, such as
quarantines, closures, and other restrictions.” Business travelers may be further limited by corporate
85 In early September, the U.S. Travel Association reported that the World Travel and Tourism Council (WTTC) “estimates that
the U.S. economy will lose $155 billion in 2020 due to the falloff in international inbound travel—a staggering $425 million per
day. International visitor spending in the U.S. for the year could potentially drop 79%.” As a result, an estimated “nearly 12.1
million jobs in the U.S. supported by travel and tourism are at risk of being lost in a “worst case” scenario mapped out by WTTC
economic modelling.” Szyf, Aaron. “By the Numbers: World Travel and Tourism Council Releases 2020 Estimate of International
Inbound Travel Spending Losses for U.S. Economy.” U.S. Travel Association, September 2, 2020.
https://www.ustravel.org/news/numbers‐world‐travel‐and‐tourism‐council‐releases‐2020‐estimate‐international‐inbound‐
travel
The New York Times reported in November that “(t)he pandemic triggered a free‐fall in tourism to New York City, one of the
world’s most popular destinations. A new forecast predicts that the influx of tourists will not fully rebound for at least four
years, a somber assessment that reflects one of the biggest challenges to the city’s recovery.” The city’s tourism promotion
agency projects that in 2020, the city is likely to reach just one‐third of last year’s visitor totals. McGeehan, Patrick. “Tourism,
Engine for N.Y.C. Economy, May Not Fully Recover Until 2025.” November 16, 2020
https://www.nytimes.com/2020/11/16/nyregion/nyc‐tourism‐
covid.html?action=click&module=Top%20Stories&pgtype=Homepage
As for Florida, the Economic Estimating Conference expects a continued contraction in Fiscal Year 2020‐21, with a projected
overall decline of ‐16.4 percent from the already suppressed Fiscal Year 2019‐20 level. Conference Results, November 20, 2020:
http://edr.state.fl.us/Content/conferences/fleconomic/index.cfm
86 “The Travel Industry Turned Upside Down: Insights, Analysis and Actions for Travel Executives.” Skift Research and McKinsey
& Company, September 2020: 7, 58.
https://www.mckinsey.com/~/media/mckinsey/industries/travel%20transport%20and%20logistics/our%20insights/the%20trav
el%20industry%20turned%20upside%20down%20insights%20analysis%20and%20actions%20for%20travel%20executives/the‐
travel‐industry‐turned‐upside‐down‐insights‐analysis‐and‐actions‐for‐travel‐executives.pdf
18You can also read