VITAL SIGNS 2021 COMMUNIT Y REPORT - Educate. Discover. Serve.
←
→
Page content transcription
If your browser does not render page correctly, please read the page content below
2 0 21 COM MUNI T Y R E P OR T
VITAL SIGNS
Educate. Discover. Serve.
LEADERSHIP
ADMINISTRATIVE OFFICERS
Joshua Wynne, M.D., M.B.A., M.P.H.                    Scott E. Knutson, M.D.                                Stephen Tinguely, M.D.
Vice President for Health Affairs                     Assistant Dean, Northwest Campus, Minot               Assistant Dean for Medical Accreditation
Dean, University of North Dakota                                                                            Chief Medical Accreditation Officer
                                                      David Relling, P.T., Ph.D.
School of Medicine & Health Sciences
                                                      Associate Dean for Health Sciences                    Richard Van Eck, Ph.D.
Marc D. Basson, M.D., Ph.D., M.B.A., F.A.C.S.                                                               Associate Dean for Teaching and Learning
                                                      James Porter, Ph.D.
Senior Associate Dean for Medicine & Research
                                                      Associate Dean for Student Affairs & Admissions       Donald Warne, M.D., M.P.H.
Kimberly Becker, Ph.D.                                                                                      Associate Dean, Diversity, Equity & Inclusion
                                                      Luke Roller, M.D.
Designated Institutional Official (DIO)                                                                     Director, Indians Into Medicine (INMED)
                                                      Associate Dean, Southwest Campus, Bismarck
Director of Graduate Medical Education                                                                      Program Director, Public Health Program
                                                      Kenneth Ruit, Ph.D.
Patrick Carr, Ph.D.                                                                                         Susan Zelewski, M.D.
                                                      Associate Dean for Education and Faculty Affairs
Assistant Dean for Medical Curriculum                                                                       Assistant Dean, Northeast Campus, Grand Forks
                                                      Judy Solberg, Ph.D., M.P.A.
Scott Engum, M.D.
                                                      Chief of Staff, Office of the Dean
Associate Dean, Southeast Campus, Fargo

ADVISORY COUNCIL
David Molmen, M.P.H. (Chair)                          Brad Gibbens, M.P.A.                                  Tim Mathern, M.P.A.
Northeast Campus Representative                       Acting Director of the Center for Rural Health, UND   North Dakota Senate
                                                      School of Medicine & Health Sciences
Joshua Wynne M.D., M.B.A., M.P.H.                                                                           Jon O. Nelson
(Executive Secretary)                                 Dean Gross, Ph.D., F.N.P.-C                           North Dakota House of Representatives
Vice President for Health Affairs and Dean            North Dakota Center for Nursing
                                                                                                            Casey Ryan, M.D.
Misty Anderson, D.O.                                  Christopher D. Jones, M.B.A.                          North Dakota State Board of Higher Education
North Dakota Medical Association Representative       Department of Human Services Representative
                                                                                                            Stephen Tinguely, M.D.
Thomas F. Arnold, M.D.                                Courtney Koebele, J.D. (Ex officio)                   Southeast Campus Representative
Southwest Campus Representative                       North Dakota Medical Association
                                                                                                            Breton Weintraub, M.D., F.A.C.P.
Gretchen Dobervich                                    John M. Kutch, M.H.S.A.                               VA Medical Center and Affiliated Clinics
North Dakota House of Representatives                 Northwest Campus Representative                        Representative

Robert Erbele                                         Michael LeBeau, M.D.                                  Dirk Wilke, M.B.A., J.D.
North Dakota Senate                                   North Dakota Hospital Association                     North Dakota Department of Health

A CCO M P L I S H M E N T S
#UNDPROUD
            ESTIMATED                                        SCHOOL OF                                                  SPONSORED
             REVENUE                                     MEDICINE & HEALTH                                               PROJECT
            2019–2021                                     SCIENCES ALUMNI                                                 AWARDS
  $205,075,117                                                      11,629                                       $38,476,968
                                             page 6                                            page 11                                                 page 18

                                                                       2021 Community Report

                                                                             —2—
CONTENTS EDUCATE.
                                                    4       DISCOVER.
If you would like further details about the
information in this Community Report or the             PURPOSE
programs, departments, or research at the               STATEMENT

                                                            SERVE.
School, please contact Brian Schill, director,

                                                    6   FINANCE
Office of Alumni & Community Relations,
UND School of Medicine & Health Sciences,
701.777.4305, brian.schill@UND.edu.                     .BUDGET
Vital Signs 2021 represents the good-faith              .TUITION                 Keep your finger on the pulse of
effort of the UND School of Medicine & Health                                    the latest news and events from
                                                        .PHILANTHROPY
Sciences to provide current and accurate
                                                                                 the UND School of Medicine &

                                                    8
information about the School. Numerous
sources were used in gathering the information          EDUCATE                  Health Sciences
found in this community report. We welcome
                                                        .DEGREE PROGRAMS                  instagram.com/UNDSMHS
corrections, which we will incorporate in
subsequent issues of Vital Signs.                       .STUDENT ENROLLMENT               facebook.com/UNDSMHS
On the cover: First-year medical student                .PASS RATES                       twitter.com/UNDSMHS
Amanda Hansmann of Farmington, Minn.,
with a friend at the 2021 Teddy Bear Clinic,            RETENTION                         youtube.com/user/UNDSMHS
wherein elementary schoolers learn about
                                                        .COMPLETION RATES                 flickr.com/photos/UNDSMHS
clinical care via their favorite stuffed animal.
                                                        .MATCH DAY
Please note that photos in Vital Signs
showing groups of unrelated people                      .FAMILY MEDICINE
                                                                                 Read Dean Joshua Wynne’s weekly column in
indoors without masks were taken before                   RESIDENCY
                                                                                 For Your Health, the School’s digital newsletter
the COVID-19 pandemic reached the
United States.
                                                        .PATHWAY PROGRAMS        delivered to your inbox: blogs.UND.edu/for-your-

                                                   18
                                                                                 health

                                                        DISCOVER
                                                        .PROJECT AWARDS
                                                                                 Subscribe to North Dakota Medicine, the

                                                   21   SERVE                    School’s quarterly magazine available on the
                                                                                 SMHS website: med.UND.edu/nd-medicine or
                                                        .CENTER FOR              through a print subscription.

                                                          RURAL HEALTH           To subscribe to For Your Health or North Dakota
                                                                                 Medicine, please contact Kristen Peterson,
                                                        .FACULTY/STAFF/          kristen.peterson@UND.edu or 701.777.4305.
                                                           STUDENTS
                                                        .WORKFORCE
                                                        .JOGGIN’ WITH JOSH

                                                         2021 Community Report

                                                              —3—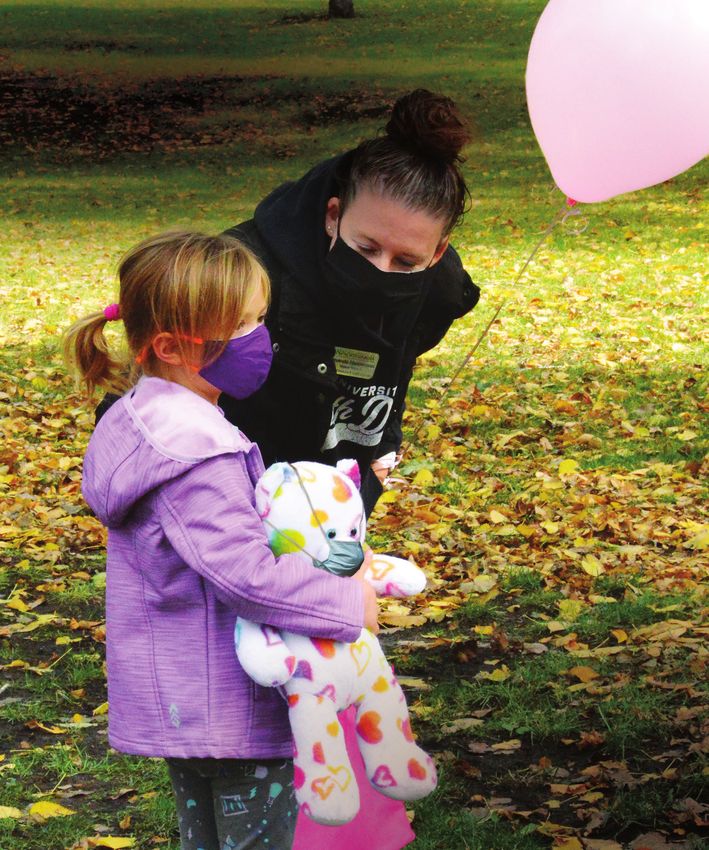
PURPOSE STATEMENT
EDUCATE
More than 1,300 part-time or volunteer clinical faculty in more than 30 communities throughout the state
help to educate medical students and residents:
l
There are four clinical campuses located in l
The School uses the latest in simulation
Bismarck, Fargo, Grand Forks, and Minot. technology for interprofessional teaching and
serves as a valuable resource for health care
l
Health sciences students receive training
professionals throughout North Dakota and
not only in North Dakota but also across the
the region.
country, including occupational therapy in
Casper, Wyo., and a medical laboratory science l
Interprofessional learning activities, including
program at Mayo Clinic in Rochester, Minn. an interprofessional health care course and
simulation activities, provide students with a
l
The School’s patient-centered-learning
strong practical understanding of the various
curriculum is nationally recognized for
health care professionals on their team.
producing caring, patient-centered, and
dedicated practitioners.
DISCOVER
Areas of research strength: for Disease Control and Prevention, and the
l
Aging Department of Health and Human Services.
l
Cancer
Among other awards given to the School and
l
Health disparities in rural and American
its faculty in 2021, Department of Biomedical
Indian communities
Sciences Associate Professor John Shabb was
l
Infectious diseases
given the UND Award for Excellence in Online
l
Neurodegenerative disorders
Course Development & Innovative Teaching
The School has facilities for the study of drug
Strategies, and Clinical Professor and Chair of
addiction and neurodegenerative diseases such
our Department of Psychiatry and Behavioral
as Parkinson’s, Alzheimer’s, multiple sclerosis,
Science, Andrew J. McLean, and Associate
and epilepsy. Faculty at the UND SMHS not
Professor in our Department of Indigenous
only publish their research in leading journals
Health, Shawnda Schroeder, won the UND Award
each year but apply for and are awarded tens of
for Interdisciplinary Collaboration in Research and
millions of dollars in grants from agencies such
Creative Activity.
as the National Institutes of Health, the Centers
SERVE
The School improves the health and health care of North Dakotans through research, community
engagement, and prevention programs:
l
Direct primary care is provided to North Policy Research Center, and TruServe, a
Dakotans through the School’s family web-based information tracking system that is
medicine clinics in Bismarck and Minot. now used by most state offices of rural health.
CRH works to develop capacity and skill at
l
The School leads the nation in rural health
the rural community level through education,
through the Center for Rural Health (CRH),
training, assessment, planning, program
which serves as the State Office of Rural
and workforce development, and evaluation.
Health for North Dakota. It is home to six
Primary focus areas include community
national programs: The National Resource
development, research, Indigenous health,
Center on Native American Aging, the National
behavioral and mental health, population
Indigenous Elder Justice Initiative, the Rural
health, quality improvement, evaluation, health
Health Information Hub, the Rural Health
policy, and education.
Research Gateway, the Rural Health Reform
2021 Community Report
—4—
The primary purpose of the University of North Dakota School of Medicine and Health Sciences is to
educate physicians and other health professionals for subsequent service in North Dakota and to enhance
the quality of life of its people. Other purposes include the discovery of knowledge that benefits the people
of this state and enhances the quality of their lives.
                                                                             —North Dakota Century Code (Section 15-52-01)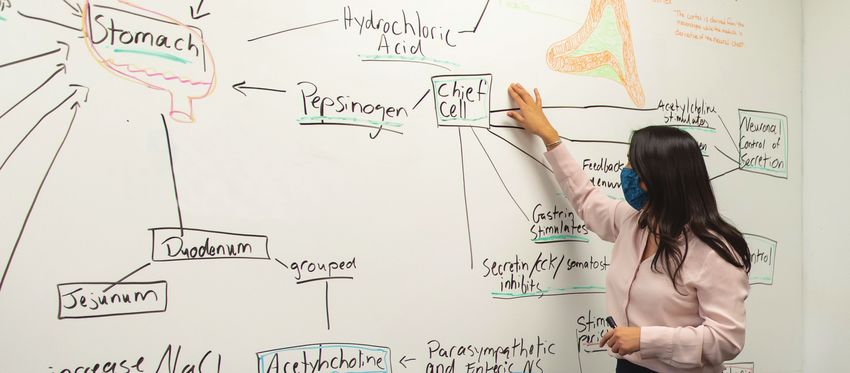
Salaries Operating and Fringe Benefits
Equipment
FINANCE BUDGET/TUITION
Our 2019–2021 biennial budget is $205,075,117. The majority comes from non-state sources such as
grants, contracts, patient revenue, and tuition.
ESTIMATED ESTIMATED REVENUE
2019–2021
$205,075,117
54% 32%
EXPENDITURES
For every $1 appropriated to the School by the
Legislature, the School generates about $2 in
25% grants, contracts, tuition, and service revenues.
29% AAMC Midwest Mean $38,260
2020–2021
Minnesota $41,328 19% 19%
Nebraska $40,745
South Dakota $36,204
2019–2020 TOTAL:
North Dakota $34,762
AAMC Midwest Mean $37,338
17% 5%
Minnesota $40,134
Nebraska $39,427
South Dakota $36,204
$110,126,018 $60,444,464 $34,504,635 $64,933,503 $51,637,580 $33,588
North Dakota
$39,338,986 $38,501,802 $10,663,246
Salaries Operating and Fringe Benefits State Grants and Patient Tuition Mill Levy
Equipment Contracts Education
AAMC Midwest Mean $36,403
2018–2019
Minnesota $39,455
1ST YEAR IN-STATE RESIDENT TUITION AND FEE RATES FOR REGIONAL MEDICAL Nebraska
South Dakota
$38,054
$35,054
SCHOOLS PER THE ASSOCIATION OF AMERICAN MEDICAL COLLEGES (AAMC) North Dakota $32,601
AAMC Midwest Mean $38,260 AAMC Midwest Mean $38,518
2017–2018
2020–2021
Minnesota $41,328 Minnesota $36,640
32%
Nebraska $40,745 Nebraska $34,302
South Dakota $36,204 South Dakota $33,946
North Dakota $34,762 North Dakota 0 $31,433 10000 20000
25%
AAMC Midwest Mean $37,338 AAMC Midwest Mean $38,537
2016–2017
19%
2019–2020
Minnesota $40,134
19% Minnesota $35,989
Nebraska $39,427 South Dakota $33,373
South Dakota $36,204 Nebraska $32,465
North Dakota $33,588 North Dakota 0 $30,239 10000 20000
AAMC Midwest Mean $36,403 AAMC Midwest Mean $38,601
5%
2015–2016
2018–2019
Minnesota $39,455 Minnesota $35.466
Nebraska $38,054 South Dakota $34.924
South Dakota $35,054 Nebraska $31,199
$64,933,503 $51,637,580 $39,338,986 $38,501,802 $10,663,246
North Dakota $32,601 North Dakota 0 $29.496 10000 20000
State Grants and Patient Tuition Mill Levy
Source: aamc.org/data-reports/reporting-tools/report/tuition-and-student-fees-reports
Contracts Education
AAMC Midwest Mean $38,518 AAMC Midwest Mean $36,800
014–2015
017–2018
Minnesota $36,640 2021 CommunityMinnesota
Report $34,386
Nebraska $34,302
—6—
South Dakota $33,554
South Dakota $33,946 Nebraska $31,145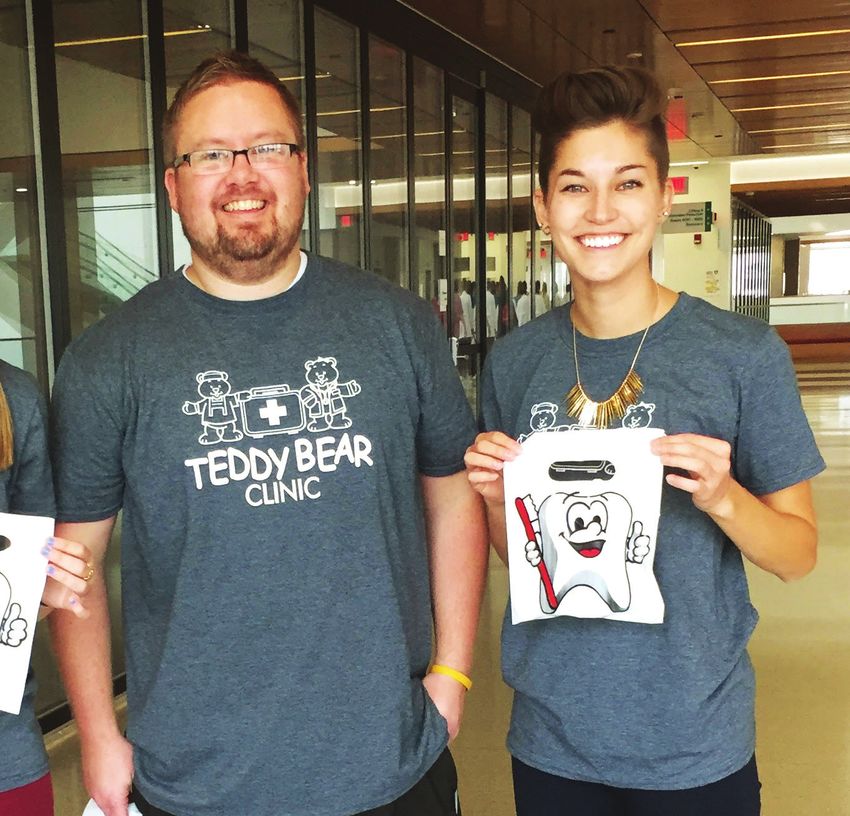
FINANCE PHILANTHROPY
FISCAL YEAR 2021
SOURCES OF DONATIONS USES OF FISCAL YEAR 2020
Retained Donors 392
TOTAL DONORS 489 DONATIONS Reengaged Donors
New Donors
121
49
TOTAL TOTAL DONORS
82% 562
$2,098,907 Alumni
$1,721,074
Students 461
Friends 75
82%
Other 13
82% $1,721,074
Corporations/foundations/
matchingStudents
gifts 13
65% 27.5% 7.5% $1,721,074
37 New Donors
Students TOTAL DONORS 562
317 Retained Donors 135 Reengaged Donors
TOTAL DONORS = 489 6%
65% 27.5% 7.5% Students $ 1,457,537
$132,889
Priority Needs 234,945
37 New Donors Priority Needs
27.5%
317 Retained Donors 7.5%Donors
135 Reengaged Programs 57,815
TOTAL 37
DONORS = 489 6%
Educators (faculty) 4,513
onors New Donors
135 Reengaged Donors
6% $132,889
TOTAL DONORS = 489 TOTAL $ 1,754,810
SOURCES OF DONATIONS
Priority Needs
$132,889
FISCAL YEAR 2019
Priority Needs
TOTAL DONORS 489 Retained Donors
12%
Reengaged Donors
442
176
New Donors
$242,940 66
Programs
TOTAL DONORS 684
12%
12% $242,940
Alumni 541
Programs
Friends 103
$242,940
Other 21
Programs
EDUCATE DEGREE PROGRAMS
GRADUATE MEDICAL DOCTOR INDIGENOUS AND HEALTH
PROGRAMS (MD) PROGRAM PUBLIC HEALTH SCIENCES
Doctor of Philosophy (Ph.D.) All medical students spend their first The UND SMHS Public Health program Athletic Training
and Master of Science degrees 20 months in Grand Forks. They learn is designed to prepare students to l
Four-year Bachelor of Science
in Biomedical Sciences, with through lectures, laboratories, patient respond to the growing demand for l
Master of Athletic Training coming in
specializations in: simulations, and in patient-centered- public health professionals who can 2022
l
Inflammation and Infectious Disease learning groups, where basic and promote health and wellness through
Medical Laboratory Science
l
Neuroscience and clinical sciences are taught in the population-based approaches. Our
l
Four-year Bachelor of Science or
Neurodegenerative Disease context of patient cases. They then program houses the world’s first
post-baccalaureate certificate
l
Epigenetics spend two years and four months doctoral program in Indigenous Health
l
Categorical Certificate
l
Molecular and Cellular Biology of clinical training in Bismarck, and our master program offers three
l
Master of Science
Fargo, Grand Forks, Minot, or a specializations – Health Management
Doctor of Philosophy and Master l
More than 60 clinical training sites in
rural community through the Rural & Policy, Indigenous Health, and
of Science degrees in Clinical 10 states with more than half in
Opportunities in Medical Education Population Health Research &
and Translational Science, with North Dakota and the surrounding
(ROME) Program. The School’s new Analytics. The Indigenous Health
specializations in: region
“Curriculum 2.0” is getting medical dissertation allows for either the
l
Molecular and Pathological Basis
students into the clinical setting faster academic or applied track. Occupational Therapy
of Human Disease
and giving them more elective options Three-year pre-occupational therapy
This year also marks the inauguration of
l
l
Bioinformatics and Human
sooner. program and three-year
Population Genetics the world’s first standalone Department
of Indigenous Health. To learn more Occupational Therapy Doctorate
about this first-ever department, see (OTD)
page 20.
Physical Therapy
l
Three-year pre-physical therapy
program and three-year Doctor of
Physical Therapy (DPT)
Physician Assistant Studies
l
Two-year Master of Physician
Assistant Studies (MPAS) leading
to the Certified Physician Assistant
credential (PA-C)
The UND School of Medicine
& Health Sciences is one of 35
medical schools in the country
that is community-based, meaning
we don’t own or operate our
own hospital. Rather, we partner
with health care providers in the
community to educate our students.
EDUCATE STUDENT ENROLLMENT                                                                                                                                         *

GRADUATE                                                        MEDICAL DOCTOR POST-MD DEGREE HEALTH
PROGRAMS                                                        (MD) PROGRAM (RESIDENCY)      SCIENCES
Biomedical Sciences                                             Year 1 Class of 2025		                        78    Training in family medicine, geriatric         Athletic Training
  (Graduate—Master and Doctoral) 33                                                                                 medicine, hospital medicine, internal           Pre–Athletic Training		           16
                                                                Year 2 Class of 2024		                        78
                                                                                                                    medicine, psychiatry, surgery,
Clinical and Translational Science                                                                                                                                  Bachelor of Science		             13
                                                                Year 3 Class of 2023		                        70    orthopedic surgery, transitional,
  (Graduate—Master and Doctoral)                        5                                                           neurology, and hematology/oncology             Medical Laboratory Science
                                                                Year 4 Class of 2022		                        75
                                                                                                                                                                    Pre–Medical Laboratory Science 111
		                                    TOTAL           38                                                            		                         TOTAL         158
                                                                		                                    TOTAL   301                                                   Certificate		                     65

                                                                                                                                                                    Bachelor of Science		            113

The School’s faculty also teach courses in biomedical sciences (anatomy, physiology, pharmacology, biochemistry,                                                    Master of Science		               58
microbiology, immunology) that enroll over 1,000 undergraduate students each year who will become physicians, therapists,
                                                                                                                                                                   Occupational Therapy
nurses, dietitians, exercise scientists, public health professionals, and forensic scientists.
                                                                                                                                                                    Pre–Occupational Therapy          94
Now that the School’s Healthcare Workforce Initiative (HWI) is fully implemented, 16 additional medical students, 30 health
                                                                                                                                                                    Occupational Therapy Doctorate 162
sciences students, and a variety of post-MD degree trainees are being educated through the UND SMHS each year,
relative to 2012. In addition to expanding SMHS class sizes, the HWI utilizes a number of strategies to maximize success in                                        Physical Therapy
increasing North Dakota’s health care workforce:                                                                                                                    Pre–Physical Therapy		           177
 • Acceptance of students to medical school weighted toward those from rural areas of North Dakota.                                                                 Doctoral		                       146
 • Tuition forgiveness for those who commit to practice in a rural community in the state.
                                                                                                                                                                   Physician Assistant
 • Increased longitudinal experiences in rural communities.                                                                                                         (Graduate—Master)		               69

 • Increased geriatrics, population health, and public health focus.
                                                                                                                                                                   Public Health
*Official fall 2021 enrollment figures per the University of North Dakota Office of Analytics & Planning.                                                           Master of Public Health		         66

                                                                                                                                                                    Indigenous Health Ph.D.           37

                                                                                                                                                                   		                       TOTAL   1,127

                                                                                                                                     A medical student in our historic Indians Into Medicine program
                                                                                                                                     works on a patient case with her colleagues (off camera) in one
                                                                                                                                     of the School’s small-group learning rooms.
EDUCATE PASS RATES/RETENTION
      RETENTION OF UND SMHS MEDICAL STUDENT
                                                                                             PROGRAM
      GRADUATES FOR PRACTICE IN-STATE
      Percentile rank (compared with other medical schools)
                                     20%             40%      60%   80%               100%
                                                                                             Athletic Training
        ’21
                                                                                             Medical Laboratory Science
        ’20
                                                                                             Occupational Therapy
        ’19                                                               NATIONAL
                                                                          PASS RATE          Physical Therapy
        ’18
                                                                                             Physician Assistant
        ’17
                                                                                             Medicine
        ’16                                                                                    Step 1

        ’15                                                                                    Step 2
                                                                                               Clinical Knowledge
        ’14
                                                                                               Step 3
        ’13
      Source: Missions Management Tool, 2021 AAMC                                            Sources: Data are from the most recent
                                                                                             examination in each respective area.

     ’21
     ’20
     ’19
     ’18
     ’17
     ’16
     ’15
     ’14
Our goal
      ’13 is for our students
in the health
         0 sciences 20  and                          40       60    80                100
medicine to meet or exceed the
accepted standard on nationally
recognized exams measuring
academic progress.
More than 700 practicing physicians now serving
North Dakota communities received their
education at UND.
UND SMHS NATIONAL PERCENTAGES OF PHYSICIANS PRACTICING IN NORTH DAKOTA WHO GRADUATED FROM THE UND
SCHOOL OF MEDICINE & HEALTH SCIENCES OR COMPLETED AN IN-STATE RESIDENCY
PASS RATE PASS RATE 2019 2021
All Specialties 46% 50%
78% 78%
Family Medicine 74% 78%
92% 73%
Internal Medicine 41% 44%
100% 98%
Obstetrics and Gynecology 66% 69%
94% 91%
Pediatrics 41% 45%
100% 93%
Psychiatry 41% 48%
Source: Medical Marketing Service. (2021). AMA Master File, 2021. [Data file]. Wood Dale, Ill. Medical Marketing Service
99% 97%
SCHOOL OF MEDICINE & HEALTH SCIENCES ALUMNI
100% 98%
Medical Laboratory Scientists 2,571
98% 98%
Athletic Trainers 284
Physicians 2,390
Physical Therapists 2,017
Occupational Therapists 2,118
Physician Assistants 1,930
Public Health Professionals 76
Biomedical Sciences 243 (since 1995)
TOTAL 11,629
PERCENTAGES OF OTHER HEALTH CARE PROVIDERS PRACTICING IN NORTH DAKOTA WHO ARE
GRADUATES OF THE UND SCHOOL OF MEDICINE & HEALTH SCIENCES
Athletic Trainers 30%
Occupational Therapists 52%
Medical Laboratory Scientists 47%
Physician Assistants 39%
Physical Therapists 48%
Data were collected from North Dakota state licensing boards and academic departments.
UND SMHS MEDICAL DOCTOR PROGRAM OUTCOMES
METRIC PERCENTILE RANK
Graduates entering primary care 97th
Graduates practicing in rural areas 100th
Graduates practicing in family medicine 99th
Fraction of class identifying as American Indian 100th
Source: Missions Management Tool, 2021 AAMCtudents Percentage ofPercentage
Students of Students Percentage ofPercentage
Students of Students
0
0
0
60
80
80
20
20
40
40
60
60
80
80
20
20
40
40
60
60
80
80
100
100
100
100
100
100
MASTER
66 Students Admitted in 2008 62 Students Admitted in 2010
60 Students Graduated in 2010 = 91% 54 Students Graduated in 2014 = 87%
’08 ’10
’08 ’10
1 Student Graduated in 2015 = 89%
’10 ’14 ’15 ’16
’10 ’14 ’15 ’16
3 Students Graduated in 2016 = 94%
class matriculating in 2013.
58 Students Admitted in 2010
55 Students Graduated in 2012 = 95%
’10 ’12
’10 ’12
62 Students Admitted in 2011
58 Students Admitted in 2012 54 Students Graduated in 2015 = 87%
6 Students Graduated in 2016 = 97%
55 Students Graduated in 2014 = 95%
’12 ’14
’12 ’14
0 Students Graduated in 2017 = 97%
’11 ’15 ’16 ’17
’11 ’15 ’16 ’17
DOCTOR OF MEDICINE (FOUR-YEAR PROGRAM)
28 Students Admitted in 2013
26 Students Graduated in 2015 = 93%
’13 ’15
’13 ’15
70 Students Admitted in 2012
64 Students Graduated in 2016 = 91%
0 OF PHYSICIAN ASSISTANT STUDIES (TWO-YEAR PROGRAM)
1 Student Graduated in 2017 = 93%
relative to the initial number of enrolled students (gray) in a given year.
34 Students Admitted in 2014
0 Students Graduated in 2018 = 93%
’12 ’16 ’17 ’18
’12 ’16 ’17 ’18
33 Students Graduated in 2016 = 97%
’14 ’16
’14 ’16
— 12 —
completion rate for medical students who graduate within seven years is 94 percent.
Years
Years
Years
36 Students Admitted in 2015
Beginning in 2006, the program accepted a new class every other year. It has returned
68 Students Admitted in 2013
2021 Community Report
33 Students Graduated in 2017 = 92%
’15 ’17
’15 ’17
62 Students Graduated in 2017 = 91%
1 Student Graduated in 2018 = 93%
0 Students Graduated in 2019 = 93%
’13 ’17 ’18 ’19
33 Students Admitted in 2016 ’13 ’17 ’18 ’19
29 Students Graduated in 2018 = 88%
’16 ’18
’16 ’18
78 Students Admitted in 2014
35 Students Admitted in 2017 67 Students Graduated in 2018 = 86%
’17 ’19
’17 ’19
32 Students Graduated in 2019 = 91% 1 Student Graduated in 2019 = 87%
EDUCATE COMPLETION RATES
2 Students Graduated in 2020 = 90%
’14 ’18 ’19 ’20
’14 ’18 ’19 ’20
31 Students Admitted in 2018
28 Students Graduated in 2020 = 90%
’18 ’20
’18 ’20
For Doctor of Medicine students at the School, the maximum time allowed to complete a four-year degree is six years. The national
78 Students Admitted in 2015
Completion rates* measure the percentage of students who enrolled in a professional degree program and completed their degree within
Years to an annual admission structure effective with the
68 Students Graduated in 2019 = 87%
the maximum allowable time, which varies based on the program. Colored bars represent the number and percentage of a class graduating
33 Students Admitted in 2019 3 Students Graduated in 2020 = 91%
2 Students Graduated in 2021 = 94%
’15 ’19 ’20 ’21
’15 ’19 ’20 ’21
29 Students Graduated in 2021 = 88%
’19 ’21
’19 ’21
M
M
P
PPercentage of Students
Percentage of Students Percentage of Students
Percentage of Students Percentage of Studen
Percentage of Students
0
0
0
0
0
0
20
40
60
80
20
40
60
80
20
40
60
20
40
60
80
20
40
60
80
20
40
60
80
100
100
100
100
41 Students Admitted in 2009 48 Students Admitted in 2009
’08 ’10
38 Students Graduated in 2012 = 93% 47 Students Graduated in 2012 = 98%
’08 ’10
’09 ’12
’09 ’12
’09 ’12
’09 ’12
49 Students Admitted in 2010 50 Students Admitted in 2010
45 Students Graduated in 2013 = 92% 47 Students Graduated in 2013 = 94%
’10 ’12
’10 ’12
’10 ’13
’10 ’13
’10 ’13
’10 ’13
48 Students Admitted in 2011 49 Students Admitted in 2011
46 Students Graduated in 2014 = 94%
’11 ’14
’11 ’14
45 Students Graduated in 2014 = 94%
’11 ’14
’11 ’14
’12 ’14
’12 ’14
53 Students Admitted in 2012 52 Students Admitted in 2012
DOCTOR OF PHYSICAL THERAPY (THREE-YEAR PROGRAM)
47 Students Graduated in 2015 = 89% 47 Students Graduated in 2015 = 90%
’13 ’15
’13 ’15
’12 ’15
’12 ’15
’12 ’15
’12 ’15
MASTER OF OCCUPATIONAL THERAPY (THREE-YEAR PROGRAM)
+
53 Students Admitted in 2013 51 Students Admitted in 2013
52 Students Graduated in 2016 = 98%
’13 ’16
’13 ’16
51 Students Graduated in 2016 = 100%
’13 ’16
’13 ’16
’14 ’16
’14 ’16
— 13 —
Years
Years
Years
Years
Years
52 Students Admitted in 2014
Years
61 Students Admitted in 2014
2021 Community Report
58 Students Graduated in 2017 = 95% 48 Students Graduated in 2017 = 92%
’15 ’17
’15 ’17
’14 ’17
’14 ’17
’14 ’17
’14 ’17
62 Students Admitted in 2015 52 Students Admitted in 2015
56 Students Graduated in 2018 = 90% 52 Students Graduated in 2018 = 100%
’16 ’18
’15 ’18
’15 ’18
’16 ’18
’15 ’18
’15 ’18
60 Students Admitted in 2016 52 Students Admitted in 2016
Our goal is to exceed the national benchmark for completion.
58 Students Graduated in 2019 = 97% 52 Students Graduated in 2019 = 100%
’17 ’19
’17 ’19
’16 ’19
’16 ’19
’16 ’19
’16 ’19
65 Students Admitted in 2017 54 Students Admitted in 2017
64 Students Graduated in 2020 = 98% 52 Students Graduated in 2020 = 96%
’17 ’20
’17 ’20
’18 ’20
’17 ’20
’17 ’20
’18 ’20
60 Students Admitted in 2018 52 Students Admitted in 2018
55 Students Graduated in 2021 = 91%
(OTD) program. The first OTD graduates will be in 2022.
49 Students Graduated in 2021 = 94%
’19 ’21
’19 ’21
’18 ’21
’18 ’21
’18 ’21
’18 ’21
* Number Graduated/Number Admitted = Completion Rate
transitioned to a three-year Occupational Therapy Doctorate
+ In 2019-2020 the UND Department of Occupational Therapy
P
P
P
P
O
OEDUCATE MATCH DAY
RESIDENCY TRAINING
After graduating from medical school, physicians must complete residency
training, a period of advanced intensive training in a chosen medical specialty,
before independent practice as a physician. Depending on the medical specialty,
medical school graduates complete anywhere from three to seven years of
residency training after medical school.
Residency training throughout North Dakota is provided in eight specialties:
l
Family Medicine (Bismarck, l
Orthopedic Surgery (Fargo)
Fargo, Grand Forks, Minot, Williston)* l
Psychiatry (Fargo)
l
Hospitalist (Bismarck) l
Surgery (Fargo, Grand Forks)
l
Internal Medicine (Fargo) l
Transitional (Fargo)**
l
Neurology (Fargo)
Residency training throughout North Dakota is provided in multiple regions:
l
UND Family Medicine in Bismarck
(Fort Yates), Fargo (Valley City, l
UND Psychiatry (Rural Outreach to
Detroit Lakes, and Wahpeton), Dickinson, Williston, Devils Lake,
Hettinger, Minot (Garrison), and Williston Jamestown, Valley City, and New Town,
l
UND Surgery Rural Track (Minot plus Telemedicine)
and Fargo, N.D., and Perham,
Minn.)
Post-graduate Fellowships:
l
Geriatrics (Bismarck, Fargo) l
Hematology-Oncology (Fargo)
In the fall semester of their final year of school, medical students apply to
programs through which they hope to complete a residency—the period of
advanced training in a medical specialty that medical school graduates complete
before engaging in independent practice as a physician. Residency interviews
are conducted anywhere between October and January of that academic year for
most residencies.
In their last semester, medical school seniors across the country find out where
they will complete their residencies on “Match Day,” a celebration of residency
placements coordinated by the National Resident Matching Program (NRMP).
The 2021 Main Residency Match was the largest in NRMP history. There were
38,106 total positions offered, the most ever, and 35,194 first-year (PGY-1)
positions offered, an increase of 928 (2.7%) over 2020.
This year, 75 UND School of Medicine & Health Sciences students successfully
matched with residency programs. In total, 61 percent of the MD Class of 2021
matched into primary care specialties of family medicine, internal medicine,
obstetrics & gynecology, and pediatrics. A full 17 percent (13 of 75) of the cohort
are set to enter family medicine, a figure nearly twice the national average of
students matching into family medicine.
* The Family Medicine Program in Grand Forks is sponsored by Altru Health System.
** Transitional residency is a yearlong program designed to introduce graduates to a wide range of medical and
surgical specialties. The goal is to build a broad foundation of clinical skills as a base for future training in a medical
subspecialty.
2021 Community Report
— 14 —“I matched into the Altru Health System Family
Medicine Residency in Grand Forks! ...I am
excited about my match in family medicine, and
especially at Altru’s program.”
—Sarah Schaeffer
West Fargo, N.D.
M.D. Class of 2021
2021 Community Report
— 15 —EDUCATE FAMILY MEDICINE RESIDENCY
Our goal is to exceed the national average of students
specializing in family medicine by 100 percent.
A study completed by the American Academy of Family Education (LCME)-accredited medical schools who enter
Physicians (AAFP) noted that the University of North Dakota Accreditation Council for Graduate Medical Education
School of Medicine & Health Sciences was again among (ACGME)-accredited family medicine residency programs
the top contributors to building the nation’s family physician as first-year residents.
workforce. The figure below represents various national
studies conducted by the AAFP, and appearing in Family
Medicine, that report retrospectively the percentage of
graduates from U.S. Liaison Committee on Medical
GRADUATES CHOOSING FAMILY MEDICINE 2012–2021*
30
25
20
Percentageof graduates
15
10
5
0
2012 2013 2014 2015 2016 2017 2018 2019 2020 2021
Year
Average 2011–2021 Sources: * U.S. MD seniors successfully matching
Medical Education Division, American in the NRMP.
Academy of Family Physicians
UND SMHS 19.2%
Family Medicine, STFM Journal
Department of Family & Community
NATIONAL MD-GRANTING 8.8% Medicine, University of North Dakota
School of Medicine & Health Sciences,
June 2021
UND SMHS Goal (double the national avg.)
2021 Community Report
— 16 —EDUCATE PATHWAY PROGRAMS
Growing our own: Innovative programs to produce
health care providers for North Dakota.
ROME RuralMed Minot Integrated Longitudinal Summer Undergraduate Research
Rural Opportunities in Medical RuralMed is a state-sponsored Experience (MILE) For 10 weeks each summer, more
Education (ROME) is a 24–28 week program designed to increase the A clerkship is a course of clinical than two dozen undergraduate
interdisciplinary experience in a number of health care providers who training that third-year medical students from UND, as well as from
rural primary care setting that is practice in North Dakota. Medical students undertake in specialty areas. rural and tribal colleges in Minnesota,
open to third-year students at the students can apply to this program In the summer of 2012 in Minot, North Dakota, and across the nation,
UND School of Medicine & Health focusing their training on any the first cohort of medical students conduct research and participate
Sciences. Students live and train medical specialty as long as they can undertook an integrated, longitudinal in a number of related educational
in nonmetropolitan communities establish a full-time practice in rural experience. Students work with activities at the UND School of
under the supervision of physician North Dakota. Students accepted preceptors in each of the specialties. Medicine & Health Sciences.
preceptors. ROME students for the RuralMed program will have An important feature of the new MILE Students work shoulder-to-shoulder
experience health care delivery in the cost of four-years’ tuition paid is that students develop a panel of with their mentor scientists from
rural areas throughout the state through a forgivable student loan, in patients whom they follow throughout the UND Department of Biology,
of North Dakota, where providing return for five years of medical service the year, accompanying them to SMHS scientists and clinicians,
access to health care is sometimes in a rural North Dakota setting. consultant visits and procedures and Cankdeska Cikana Community
challenging. Students learn about following them through hospitalizations. College, and the Center for Rural
problems commonly encountered Health. The research experience,
in primary care, from routine health under the direction of Professor Don
North Dakota Area Health
maintenance to medical emergencies Sens and the North Dakota IDeA
Education Center
and rare and unusual diagnoses. Network for Biomedical Research
Since 2009, the North Dakota Area
Excellence (INBRE), culminates in a
Health Education Center has utilized
Summer Undergraduate Research
R-COOL-Health Scrubs Academy federal, state, and private funding
Experience poster session in Grand
Since the annual Scrubs Academy started in 2011, 512 students have attended to support learning opportunities
Forks. One of the goals of the
from numerous communities throughout North Dakota (375 students from rural for more than 23,256 participants
summer research program is to
communities). Students participate in a dissection, explore the inside of a 32- reaching all 53 North Dakota
provide students with the opportunity
foot inflatable colon, and learn more about anatomy, medical laboratory science, counties. Of that total, more than
to work directly with an established
emergency medical services, mental health, occupational therapy, physical 13,750 students have participated in
research scientist. An additional goal
therapy, public health, nutrition, music therapy, physician assistant studies, health career awareness events and
is to recruit students from rural and
radiology, veterinary medicine, and other health careers. As part of the Academy, activities, and 144 students enrolled
tribal colleges for future enrollment
students receive Friends and Family CPR training and become certified in the in health profession programs have
in UND undergraduate and graduate
Health Insurance Portability and Accountability Act (HIPAA). Most health facilities completed rural clinical rotation
programs. The program has been
in North Dakota require that students be HIPAA-certified before allowing them to experiences.
successful in helping attract students
job shadow. Students are also given the opportunity to explore and learn more
to UND. In fact, 12 members of the
about the School of Medicine & Health Sciences, the UND campus, and the Grand
Frank Low Research Day MD Class of 2023 are INBRE summer
Forks community. The 2021 Scrubs Academy was unable to be held due to the
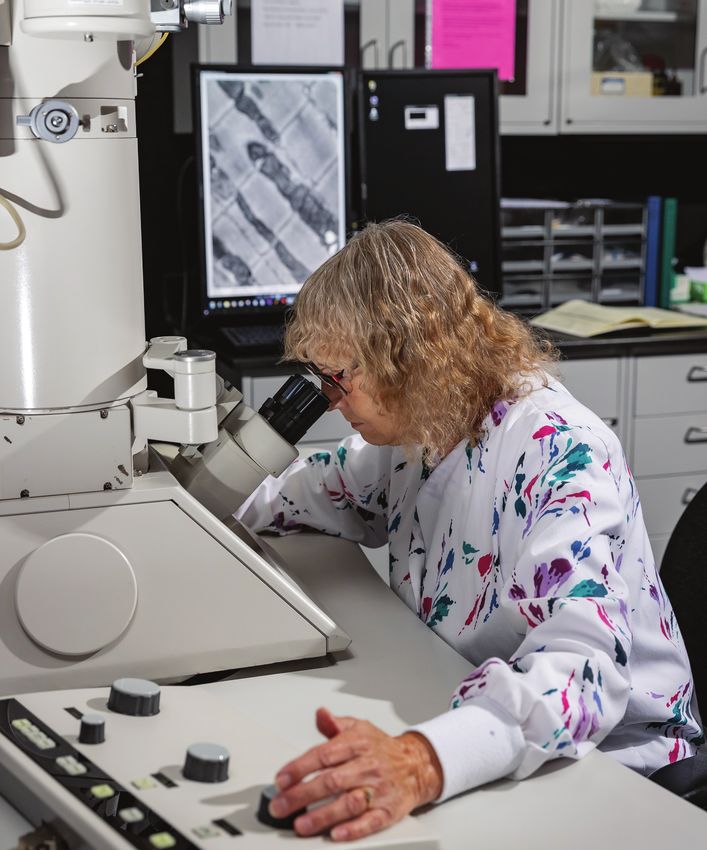
The School’s annual Frank Low research veterans!
COVID-19 pandemic.
Research Day, named in honor of
the former SMHS anatomy professor
R-COOL-Health Scrubs Camps who came to UND in the 1960s and INMED
Rural Collaborative Opportunities for Occupational Learning in Health (R-COOL- pioneered a series of new techniques The Indians into Medicine Program
Health) Scrubs Camps are one-day learning experiences where students are able for the electron microscope, is the (INMED), which was established in
to explore healthcare careers from their local healthcare providers through hands- culminating event of the academic 1973, is a comprehensive program
on, interactive activities. Since the program’s start in 2010, 9,050 students, 3,050 year for area researchers working in designed to assist American Indian
volunteers, and dozens of local communities have participated in 111 Scrubs the biomedical and health sciences. students who aspire to be health
Camps across the state. From 2019-2021, only seven Scrubs Camps have been In 2021, a virtual event saw faculty, professionals to meet the needs of
held due to the COVID-19 pandemic. postdoctoral fellows, and graduate, our Indian communities and to serve
medical, and health sciences reservation populations.
students presenting prerecorded
presentations.
2021 Community Report
— 17 —DISCOVER PROJECT AWARDS
For fiscal year 2021 (July 1, 2020–June 30, 2021), total research and
sponsored funding was $38,476,968. Over the past deacde, the School
has taken in nearly $300 million in external funding for sponsored
research and other projects.
2021 Community Report
— 18 —30000000
78%
30000000
25000000
78% FISCAL YEAR 2021
25000000
30000000
TOTAL FUNDING 20000000 2
20000000
25000000
BY SPONSOR TYPE 15000000
$38,476,968 15000000
20000000
10000000
10%
Total number of proposals
6% 6%
207 10000000
15000000
5000000
Total number of awards 126
10%
6% 6% 50000000
10000000
$29,921,538 $4,004,920 $2,356,000 $2,194,510
10%
Federal State Foundation Other (Private Nonprofit,
$29,921,538 $4,004,920 $2,356,000 6%$2,194,510 6%
International, Private For Profit,
0
5000000
Federal State Foundation Other
Other (Private Nonprofit,
Governmental, etc.)
$29,921,538 $4,004,920 $2,356,000 International, Private For Profit,
$2,194,510 0
Other Governmental, etc.)
Federal State Foundation Other (Private Nonprofit,
International, Private For Profit,
82% Other Governmental, etc.) 30000000
82% FISCAL YEAR 2020 30000000
25000000
82% TOTAL FUNDING 25000000
30000000
20000000 2020
BY SPONSOR TYPE 20000000
25000000
15000000 2020
$30,805,926 15000000
20000000
10000000 2020
Total number of proposals 155
11%
TotalW OR L D ’ S FIR S T
DEPARTMENT OF
INDIGENOUS HEALTH
Fresh off its creation in 2020 of the world’s first Ph.D. program in Indigenous “We’re
Health, the School of Medicine & Health Sciences announced in August 2021 that developing
it has founded the world’s first Department of Indigenous Health. that network
of practices
“What’s being built here is unprecedented,” said Don Warne, M.D., M.P.H.
and providers
“Nothing like this exists in the world.”
interested in
The director of the School’s public health and Indians into Medicine (INMED) creating a body
programs was speaking of a new department that will serve as a hub for each of research
of the Indigenous programs that have come online at the SMHS since 2019. and pursuing
These include not only the Ph.D. in Indigenous Health but the recently announced questions
Indigenous Trauma & Resilience Research Center, the result of a five-year, to benefit
$10 million award from the National Institutes of Health, and the School’s new Indigenous
Practice-based research network (PBRN) to be known as the American Indian population
Collaborative Research Network (AICoRN). health,” said Kelliher, a family medicine physician affiliated with the Koyukon
Athabascan tribe, who is also board certified in integrative and holistic medicine.
“We have a longstanding history of Indigenous programs at UND, beginning with “This will require partnership with as many tribal stakeholders as are interested:
INMED,” said Warne of a program that has been producing Indigenous health tribal, urban, and Indian Health Service settings across our four states, in addition
providers since 1973. “Adding this full department in a medical school, we now to collaborating internationally.”
have the opportunity to promote more synergy across our research, education,
service, and other training opportunities that focus on Indigenous health and As Kelliher put it, not only clinical but laboratory-based research often takes “a couple
health equity. It creates a unique platform to expand the innovative work we’re of decades,” historically speaking, to translate into real-time therapies for patients. But
already doing, and explore more innovative programs.” PBRNs like AICoRN – particularly if combined with the School’s new Department of
Indigenous Health – can help reduce that lag time.
Such innovations include AICoRN, which is a growing network of health providers
in the region looking to do clinical research in a focused, community-based way. “We need to build the evidence base of culturally relevant interventions to improve
health outcomes, which can lead to more resources for our communities to
According to AICoRN director Dr. Allison Kelliher, who found the prospect of implement effective health programs,” concluded Warne, an enrolled member of
conducting collaborative work in the context of a standalone Department of the Oglala Lakota Tribe in Pine Ridge, S.D. “The other focus of this program will
Indigenous Health too compelling to pass up, although PBRNs are not a new be to provide research mentorship to early career faculty and to establish them
concept nationally, there were zero such networks representing the Dakotas, as independent investigators. This will lead to ripple effects in terms of additional
Montana, and Wyoming. grants, studies, resources, and programs through UND.”
Until now.
2021 Community Report
— 20 —SERVE CENTER FOR RURAL HEALTH
The Center for Rural Health (CRH) at the School of Medicine & Health
Sciences serves North Dakota, the region, and the nation. The Center, 69%
which last year celebrated forty years, focuses the majority of its
resources on the state’s 53 counties and generally works with 100 or
more communities each year. CRH provides technical assistance to FISCAL YEAR 2021
all 38 rural North Dakota hospitals, 36 of which are Critical Access
Hospitals. CRH works closely with other groups too, such as public TOTAL $10,525,399
health, emergency medical services (EMS), rural primary care clinics
(such as Rural Health Clinics), behavioral and mental health, and tribal
health. Assistance is directed at improving access to quality healthcare
services, the viability of rural health systems, and community 24%
engagement. CRH administers a variety of funding sources used to
support and assist rural communities in North Dakota totaling:
• $10,525,399 for FY2021
6%
FISCAL YEAR 2021*
Federal Grants: $7,227,654 CRH supports 21 grants in this category,
including:
• Two national programs that focus on indigenous populations: the
National Indigenous Elder Justice Initiative (NIEJI) and the National $7,227,654 $635,245 $2,662,500
Resource Center on Native American Aging (NRCNAA). These Federal State Other
programs focus on improving health outcomes and the wellbeing
of American Indian, Alaska Native, and Native Hawaiian Elders. FISCAL YEAR 2020 FISCAL YEAR 2019
CRH Native programs have a predominantly Indigenous staff
Federal Grants $ 9,548,107 Federal Grants $ 6,611,248
with expertise in geriatrics, elder abuse, mental health, suicide
State Grants 690,494 State Grants 406,747
prevention, health disparities, community-based participatory
Other Grants 161,711 Other Grants 881,586
research, tribal participatory research, resiliency, and wellness.
CRH works with nearly half of the 574 federally recognized tribes. TOTAL $ 10,400,312 TOTAL: $ 7,899,581
NRCNAA has expanded to include a focus on urban-based Native
* In Spring 2021, UND’s Center for Rural Health received a substantial SHIP COVID-19 grant award ($3,035,412). This
Elders and administers an effort to expand Qualified Service one-time funding was provided by HRSA under the Coronavirus Air, Relief, and Economic Security (CARES) Act. The
funding was specifically designated to support COVID-19 activities in North Dakota’s 36 Critical Access Hospitals.
Providers into reservation communities. CRH facilitated the distribution of these federal funds.
• Nationally sponsored projects like the Rural Health Information Hub
and Rural Health Research Gateway provide resources, information,
and dissemination of information regarding the latest rural health
research and programs.
• CRH receives federal funding for other programs that support
healthcare, such as the Rural Hospital Flexibility Program, Small
Hospital Improvement Program, and the State Office of Rural
Health. This funding helps rural hospitals improve quality, finance
and operation; integrate EMS and innovative healthcare models;
and engage communities.
State Grants: $635,245 CRH has sponsored contracts with the state
of North Dakota for the Traumatic Brain Injury Network, and behavioral
health programs.
Other Grants: $2,662,500 CRH administers and supports other
sponsored contracts that serve and enhance rural health in the state
and region. Initiatives include Truserv; the Dakota Conference on Rural
Staffers at the UND Center for Rural Health pose for the Center’s
and Public Health; the Blue Cross Blue Shield Caring Foundation fortieth anniversary in 2020.
grant; the Native Urban Elder Needs Assessment Survey, funded by
AARP; the Native Aging in Place Program, funded by the Margaret A.
Cargill Philanthropies; and Community Health Needs Assessments.
2021 Community Report
— 21 —SERVE FACULTY/STAFF/STUDENTS
Each year UND School of Medicine & Health Sciences faculty, staff, and students engage in
many projects that seek to improve the communities in which they live and work. Here are a few
highlights from 2021:
UND awarded $10 Million NIH grant to study Indigenous resilience and health effects of trauma
In March, the School received a five-year histories, ceremonies, and foods, all of which and participants, but also in the development
award from the National Institutes of Health may be included in the broader American of relevant research questions that amplify
totaling more than $10 million to develop an Indian definition of “medicine.” community strengths while getting to the heart
Indigenous Trauma & Resilience Research of what matters most in communities,” added
The data suggest that the need for such a
Center. According to Dr. Don Warne, director Nicole Redvers, N.D., a member of the Deninu
center is great. American Indians in North
of the School’s Indians Into Medicine (INMED) Kué First Nation, who will direct the trial. “I
Dakota and the region suffer from significant
and public health programs, the goal of the am humbled and proud of the support we’ve
health disparities, relative to the non-Native
research center will be to address the impact seen from the School, our partners, and faculty
population, and much of this is related
of historical and unresolved trauma on health mentors at UND that have enabled me to lead
to historical trauma, adverse childhood
inequities within the American Indian and the first clinical trial hosted at the SMHS. I am
experiences, forced boarding school
Alaska Native population. even more proud that this clinical trial will be
participation, social marginalization, and toxic
investigating a traditional Indigenous food with
“We need to understand the impact of these stress. On the Pine Ridge Reservation in South
a long history of use for healing in Indigenous
issues, and, more importantly, we need to Dakota, for example, life expectancy is lower
communities.”
understand the best ways to overcome these than anywhere in the western hemisphere, with
challenges and to improve health outcomes,” the exception only of Haiti. The five-year grant may be renewed twice for a
Warne concluded. “The outcomes generated possible grant period of 15 years. Warne said
The project, which will be managed by Warne
from this research have the potential to be that immediate next steps for the team are
and his team, also includes resources to
applied in other marginalized populations. Over to establish the infrastructure to support the
begin the first-ever SMHS-based clinical trial
time, improved health status translates into research projects, including implementing its
in School history. The trial will be conducted
reduced healthcare costs and improved quality administrative core, and hiring several new staff
in partnership with the U.S. Department of
of life.” and faculty members to conduct community
Agriculture (UDSA) and the federally funded
engagement and outreach. Research priorities
For example, said Warne, the poor health Human Nutrition & Research Center (HNRC) in
for the center will be community-based and
outcomes that result from childhood trauma Grand Forks.
revolve around the UND team’s long history of
require a holistic approach to healing, which
“Indigenous communities deserve
community engagement.
can include greater exposure to Indigenous
representation not only in research as leaders
The SMHS annual Service Learning Day continued in 2021
Despite the pandemic, the third students produced posters on
annual School of Medicine their volunteer work with the
& Health Sciences Service immigrant integration group
Learning Day was held on Global Friends Coalition in
Wednesday, Jan. 27, 2021, via Grand Forks, their outreach to
Zoom. Service Learning Day is assisted living facilities in the
an event that gives students an region whose residents have
opportunity to reflect on how been even more isolated since
their volunteer work affects the the pandemic began, and efforts
communities in which they live to shed light on the importance
and work and shapes their view of suicide prevention and mental
of health and healthcare. Initiated health via the UND “Out of the
by medical students in 2019, the Darkness” walk.
poster event has expanded to
any SMHS student interested in
connecting their health training
to community needs. In 2021,
2021 Community Report
— 22 —SERVE WORKFORCE
THANK YOU UND SMHS EMPLOYEES FOR YOUR SERVICE AND DEDICATION
Although COVID-19 meant that UND was unable to hold its annual Employee Recognition Ceremony in May, the
University still honored employees’ work anniversaries. As usual, many of these honorees are based out of the SMHS,
including the following honorees:
45-YEAR HONOREES 20-YEAR HONOREES 10-YEAR HONOREES 5-YEAR HONOREES
Alyson White, Physical Therapy Valeria Becker, Education Resources Edward Bina, Pathology Megan Denis, SMHS Library
40-YEAR HONOREES Angeline Belbas, Physician Assistant Craig Bohn, Bismarck Center Resources
Julie Horn, Biomedical Sciences Studies for Family Medicine Susan Holden, Indians Into Medicine
35-YEAR HONOREES Angela Floden, Biomedical Sciences Jeanette Gratton, Dean’s Office Erika Johnson, SMHS Library
Faye Aker, Education Resources Danping Guo, Pathology Medicine Resources
Terrance Nelson, Dean’s Office Stacie Klegstad, NE Campus, Rachel Osowski, UND Simulation Allee Mead, Rural Health
Medicine Grand Forks Center Michelle Montgomery, Psychiatry
30-YEAR HONOREES Maren Niemeier, Rural Health Sarah Owens, Geriatrics & Behavioral Science
Jane Thorvilson, Student Affairs Susan Rundquist, Rural Health Mandi-Leigh Peterson, Rural Health Dorothea Nelson, Rural Health
& Admissions Victoria Thompson, Information Jodi Rathjen, SW Campus, Bismarck Joyce Rice, Biomedical Sciences
25-YEAR HONOREES Resources John Roberts, Information Resources Courtney Souvannasacd, Rural Health
Cherylyn Stoltman, Medical 15-YEAR HONOREES Tara Specht, Bismarck Center Zauna Synnott, Public Health
Laboratory Science Janice Flatin, Rural Health for Family Medicine Program
Brian Schill, Alumni & Community Michael Ullrich, Biomedical Jean Vedquam, Bismarck Center
Relations Sciences for Family Medicine
Dawn Seaver, Dean’s Office Medicine Marissa Wuori, Bismarck Center
for Family Medicine
+ +
FACULTY & STAFF TURNOVER 2020 2021
The faculty turnover rate (faculty who left their jobs) at the UND SMHS for Total Benefited Faculty* 185 205
FY 2021 was 7.8 percent. The turnover rate for all North Dakota University Full-time 174 192
System (NDUS) faculty for that same year was 13 percent. Part-time 11 13
Turnover Count 10 16
Likewise, the staff turnover rate at the UND SMHS for FY 2021 was 11.1
VSIP 1 1
percent while the rate for all NDUS staff was 13.5 percent.
In FYs 16, 17, 19, 20 and 21, the University of North Dakota offered a Total Benefited Staff* 250 270
voluntary separation program (VSIP) for both faculty and staff. Six SMHS Full-time 237 260
employees accepted voluntary separation in FY21. Part-time 13 10
Turnover Count 29 30
VSIP 5 5
* Benefited appointment is 20 hours/week or more.
+ Fiscal Year
2021 Community Report
— 23 —2 0 21 JOGGIN’ WITH JOSH After holding a “virtual” event in 2020, the 12th annual Joggin’ with Josh 5K/10K walk/run was held in person again, outdoors of course, on Thursday, Sept. 23, 2021. That sunny fall afternoon, more than 70 faculty, staff, students, and community members made it out to celebrate and promote wellness and an active lifestyle.
You can also read