Viva Industrial Trust - 2Q2018 Results Presentation 13 August 2018
←
→
Page content transcription
If your browser does not render page correctly, please read the page content below
Viva Industrial Trust
       2Q2018
Results Presentation

  13 August 2018

                        1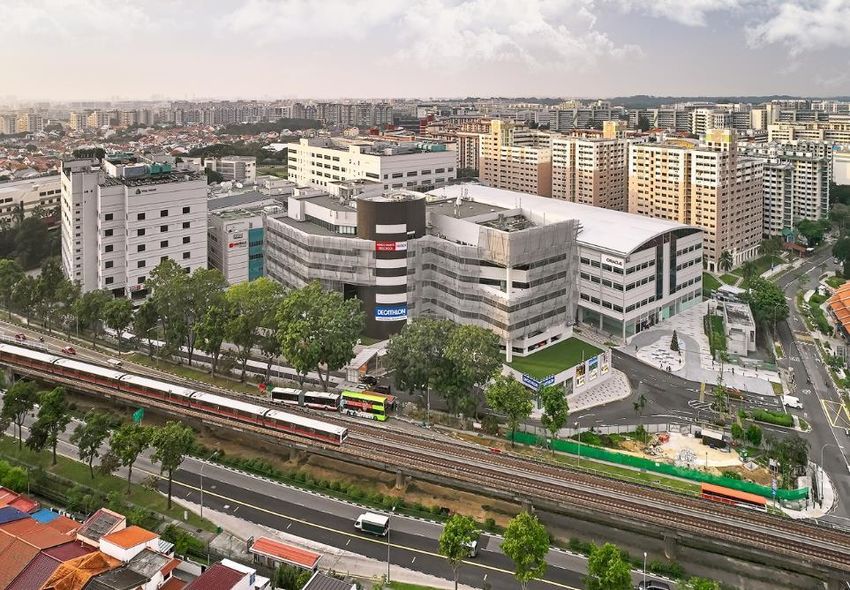
Important Notice

This presentation is for information purposes only and does not constitute or form part of an offer, invitation or solicitation of any
offer to purchase or subscribe for any Stapled Securities of Viva Industrial Trust (“VIT”) in Singapore or any other jurisdiction nor
should it or any part of it form the basis of, or be relied upon in connection with, any contract or commitment whatsoever.

The value of the Stapled Securities and the income derived from them may fall as well as rise. The Stapled Securities are not
obligations of, deposits in, or guaranteed by, Viva Industrial Trust Management Pte. Ltd., in its capacity as manager of Viva
Industrial Real Estate Investment Trust (“VI-REIT”, and the manager of VI-REIT, the “REIT Manager”), Viva Asset Management
Pte. Ltd., in its capacity as trustee-manager of Viva Industrial Business Trust (“VI-BT”, and the trustee-manager of VI-BT, the
“Trustee-Manager”, and collectively with the REIT Manager, the “Managers”), Perpetual (Asia) Limited, as trustee of VI-REIT, or
any of their respective affiliates.

An investment in the Stapled Securities is subject to investment risks, including the possible loss of the principal amount invested.
Stapled Securityholders have no right to request that the Managers redeem or purchase their Stapled Securities while the Stapled
Securities are listed. It is intended that Stapled Securityholders may only deal in their Stapled Securities through trading on
Singapore Exchange Securities Trading Limited (“SGX-ST”). Listing of the Stapled Securities on the SGX-ST does not guarantee a
liquid market for the Stapled Securities.

This presentation may contain forward-looking statements that involve assumptions, risks and uncertainties. Actual future
performance, outcomes and results may differ materially from those expressed in forward-looking statements as a result of a
number of risks, uncertainties and assumptions. Predictions, projections or forecasts of the economy or economic trends of the
markets are not necessarily indicative of the future or likely performance of VIT. The forecast financial performance of VIT is not
guaranteed. A potential investor is cautioned not to place undue reliance on these forward-looking statements, which are based on
the Managers’ current view of future events.

                                                                                                                          VIVA ITRUST    2
Contents

  Key Highlights

  Financial Performance

  Portfolio Update

  Outlook & Strategic Focus

                              VIVA ITRUST   3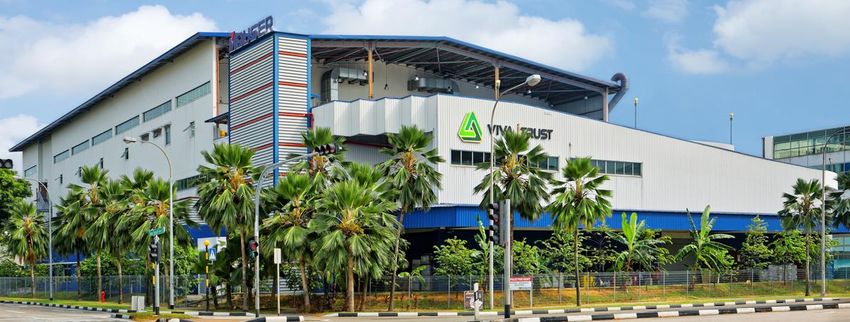
Key Highlights
        VIVA ITRUST   4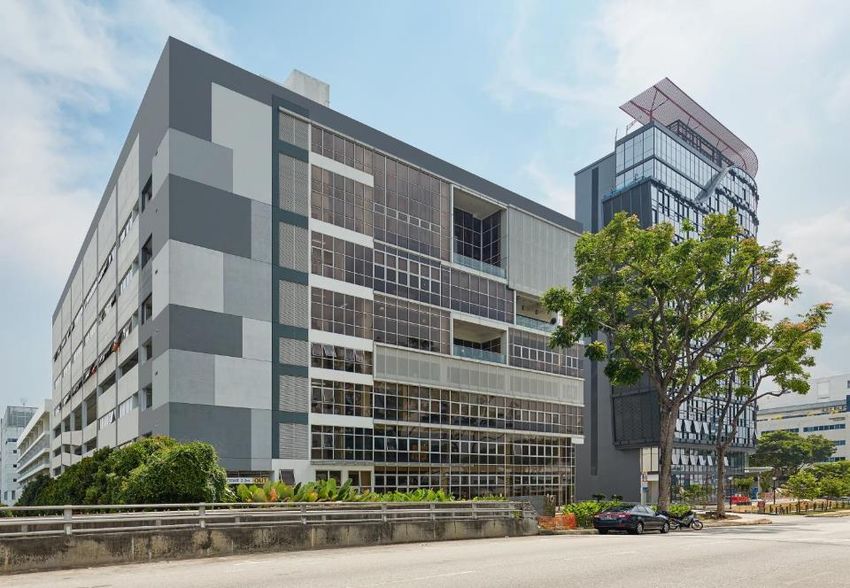
Robust Y-o-Y Performance in 2Q2018

              Distribution                                                          3.9%                       3.3%
                 Yield¹                                                                                    Net Property
                                                                        Gross Revenue                        Income

                   8.7%                                                 S$28.7m                            S$20.9m
                                                                                                    2.2%
                                                                                                                      Total Assets³
                                                   Distributable                                    DPS²
                                                     Income                                                           S$1.32b
                                                                                                                      NAV per Unit³
                                                 S$20.8m                                           1.902c
                                                              2.1%
                                                              0.9%
                                                                                                                        76.2c
1 Based on annualised 2Q2018 DPS of 7.629 cents and closing price of S$0.875 as at 29 June 2018.
2 All management fees payable to the REIT manager and the Property Manager were paid in cash.
3 As at 30 June 2018.

                                                                                                                             VIVA ITRUST   5
Tax Transparency Update

•   IRAS has accorded tax transparency treatment to the rental support
    received/receivable by VI-REIT under the UE BizHub East rental arrangement and
    the Jackson Square rental support arrangement retrospectively with effect from 1
    January 2014.
•   VI-REIT recognized a net income tax credit of S$4.96 million in 2Q2018, which in
    turn gave rise to S$4.46 million of distributable income.

          Distributable income of S$4.46 million attributable to the
                            net income tax credit:

                              50% has been included
                          in the distribution for 2Q2018

                         50% has been retained and will
                            be included in the next
                                  distribution

                                                                                VIVA ITRUST   6
Financial Performance
VIVA ITRUST 7Financial Performance
Year-On-Year Quarter-On-Quarter
Comparison Comparison
2Q2018 2Q2017 Variance 1Q2018 Variance
Gross Revenue (S$’000) 28,681 27,606 3.9% 28,692 0.0%
NPI (S$’000) 20,878 20,211 3.3% 21,051 0.8%
Distributable Income1
20,790 20,971 0.9% 16,170 28.6%
(S$’000)
Distribution Declared
18,559² 18,005³ 3.1% 17,949⁴ 3.4%
(S$’000)
Number of stapled securities
975,759 967,473 0.9% 975,759 ▬ 0.0%
for calculation of DPS (’000)
DPS (SG cents) 1.902 1.861 2.2% 1.838 3.5%
Annualised Distribution
8.7%⁵ 8.0%⁶ -- 8.4%⁷ --
Yield
1. As VI-BT is inactive, only the distribution of VI-REIT Group has been included for the purpose of calculating the DPS.
2. The distribution declared for 2Q2018 included 50% of the distributable income attributable to the net income tax credit of S$4.96 million in 2Q2018.
3. The distribution declared for 2Q2017 was made on the basis as if the JS rental support arrangement was still in place notwithstanding the JS Rental Support
Settlement as announced on 21 May 2017.
4. The distribution declared for 1Q2018 included the release of all the previously retained distributable income of S$1.78 million attributable to the JS Rental Support
Settlement.
5. Based on closing price of S$0.875 on 29 June 2018.
6. Based on actual FY2017 DPS and closing price of S$0.935 on 29 December 2017.
7. Based on closing price of S$0.885 on 29 March 2018.
VIVA ITRUST 8Financial Performance
Year-On-Year Comparison
1H2018 1H2017 Variance
Gross Revenue (S$’000) 57,373 54,985 4.3%
NPI (S$’000) 41,929 40,551 3.4%
Distributable Income1 (S$’000) 36,960 38,778 4.7%
Distribution Declared (S$’000) 36,508² 35,812³ 1.9%
Number of stapled securities for
975,759 963,975 1.2%
calculation of DPS (’000)
DPS (SG cents) 3.740 3.715 0.7%
1. As VI-BT is inactive, only the distribution of VI-REIT Group has been included for the purpose of calculating the DPS.
2. The distribution declared for 1H2018 included the release of all the previously retained distributable income of S$1.78 million attributable to the JS Rental Support
Settlement and 50% of the distributable income attributable to the net income tax credit of S$4.96 million in 2Q2018
3. The distribution declared for 1H2017 was made on the basis as if the JS rental support arrangement was still in place notwithstanding the JS Rental Support
Settlement as announced on 21 May 2017.
VIVA ITRUST 9Financial Position
30 Jun 2018 31 Dec 2017
S$ mil S$ mil
Investment Properties 1,284.9 1,284.7
Other Assets 31.5 33.7
Total Assets 1,316.4 1,318.4
Borrowings (net of transaction costs) 536.5 520.5
Other Liabilities 36.3 51.3
Total Liabilities 572.8 571.8
Net Assets 743.5 746.6
No. of Stapled Securities issued and issuable
975.8 975.8
(in mil)
Net Asset Value per Stapled Security
76.2 76.5
(SG cents)
VIVA ITRUST 10Proactive Capital Management
As at 30 June 2018
Gross Borrowings S$540 million
Gearing Ratio (Gross Borrowings over Total Assets) 41.0%
All-in Borrowing Cost 4.0%
Weighted Average Debt Maturity1 2.0 years
Interest Rate Exposure Fixed2 82.0%
Interest Cover 4.38 times
Debt Maturity Profile¹
250
200
S$ million
150
100 213
140
50 100
57
0
2018 2019 2020 2021 2022
Secured Term Loans Medium Term Notes
1. Excludes the revolving credit facility of S$50 million.
2. Based on outstanding borrowings as at 30 June 2018.
VIVA ITRUST 11Distribution Details
2Q2018 Distribution Details
Distribution Period 1 April 2018 – 30 June 2018
Distribution per Stapled Security Taxable income of 1.902 cents
Ex-Date 20 Aug 2018
Books Closure Date 23 Aug 2018
Distribution Payment Date 14 Sep 2018
VIVA ITRUST 12Portfolio Update
VIVA ITRUST 13Well-Spread, Strategically Located Assets in Singapore
9 3.9m S$1.28b Singapore Focused
Property Assets Sq ft GFA Total Portfolio Valuation Portfolio
Jackson Square Jackson Design Hub
GFA: 418,586 sq ft GFA: 85,070 sq ft
Valuation: S$73.2 m Valuation: S$33.4 m
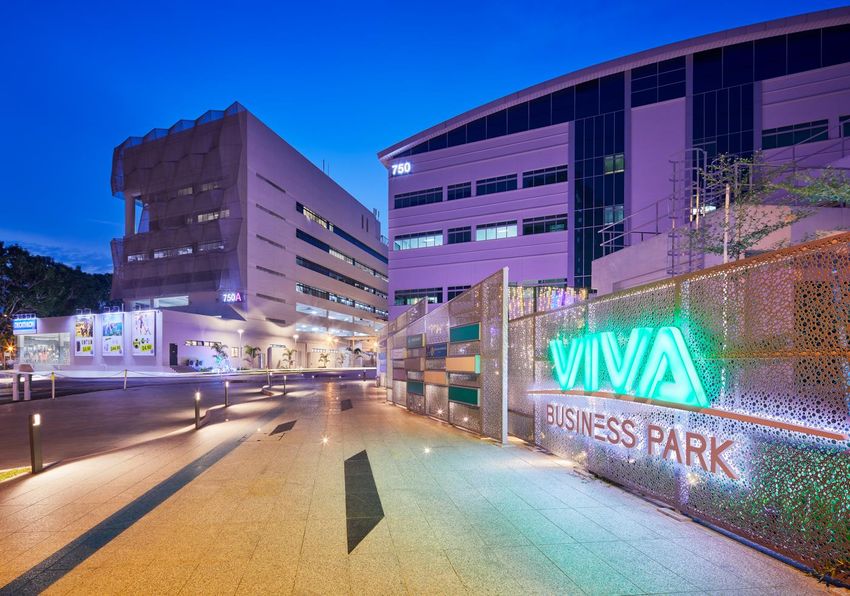
Viva Business Park
WOODLANDS
6 Chin Bee Avenue CHECKPOINT
GFA: 1,526,762 sq ft
WOODLANDS
GFA: 324,166 sq ft / KRANJI Valuation: S$350.0 m
Valuation: S$94.3 m
UE BizHub EAST
LOYANG (Hotel & Business Park)
/ CHANGI
TUAS ANG MO KIO /
CHECKPOINT SERANGOON PAYA
NORTH LEBAR / UBI GFA: 783,415 sq ft
/ KAKI CHANGI Valuation: S$518.0 m
BUKIT BUSINESS CHANGI
INTERNATIONAL TOA PAYOH
BUSINESS PARK PARK AIRPORT
ONE-
NORTH
Mauser Singapore
GFA: 107,566 sq ft
Valuation: S$28.0 m PSA TERMINAL
Major
Light
Business Park
Industrial
Planned development Cluster
Properties
of Tuas Port, where all
of Singapore’s port Business
operations will be 30 Pioneer Road Park Logistics
consolidated Home-Fix Building Properties Properties
GFA: 281,090 sq ft
Valuation: S$55.0 m 11 Ubi Road 1 GFA: 120,556 sq ft
GFA: 253,058 sq ft Valuation: S$47.8 m
Valuation: S$85.0 m
VIVA ITRUST 14Improved Portfolio Fundamentals
Portfolio Summary
30 June 2018 31 March 2018
Total Number of Properties 9 9
Total Portfolio GFA 3,900,269 sq ft 3,900,269 sq ft
Net Lettable Area (NLA) 3,313,493 sq ft 3,320,464 sq ft
WALE (by rental income)1 2.9 years 3.0 years
Weighted Average Land Lease (by valuation) 33.4 years 33.5 years
Weighted Average Age of Buildings (by
8.8 years 8.6 years
valuation)
Weighted Average Portfolio Occupancy 92.0% 91.5%
- Weighted Average Portfolio Occupancy as at Listing 70.1% 70.1%
Date (4 November 2013)
Total Portfolio Valuation S$1.28 billion S$1.28 billion
1By Rental Income - based on net property income and rental support, taking into account the master lease arrangements and rental support arrangements,
assuming that renewal options are not exercised.
VIVA ITRUST 15Key Revenue drivers
Increasingly diversified portfolio underpinned by resilient business park assets.
Gross Revenue
Contribution to y-o-y Revenue Growth
(by Asset Type) S$(‘000)
12,000
10,554
8% 10,279
8%
S$2.4m 10,000
S$2.2m
2Q18 Total 9,231
12%
13% S$3.5m Gross 8,529
S$3.5m
Revenue 8,000
19%
19%
S$5.4m
grew by
S$5.3m
$1.1m y-o-y
6,000
4,000
60% 61%
S$16.6m S$17.4m 2,118 2,431
2,000 1,803 1,588
0
2Q17 2Q18 VBP UEBH East Jackson 11 Ubi Rd 1
Square
Business Park Light Industrial Logistics Hotel 2Q17 2Q18
VIVA ITRUST 16Diversified Quality Tenant Mix
GLC
4.4%
E-Business / Data
Centre
17.0%
Retail
9.8%
ICT /Information
Breakdown of Technology
SME 24.1% Breakdown of
Tenant Type
45.0% Trade Sector by Lifestyle &
by Underlying Services
Underlying
Gross Rental MNC
7.5%
Gross Rental
Income* 50.6%
Healthcare
2.3% Income* F&B
5.5%
Energy
0.4%
Others
3.5% General
Engineering /
Self-storage Electronics
Engineering
1.7% 2.5%
Packaging & Services
Storage Warehouse & 11.0%
2.4% Logistics
12.3%
• Total of 162 tenants, of which 41% operate in the information technology, e-business or data
centre sectors.
• 55% of tenants are multinational corporations or government-linked corporations.
* Based on monthly gross rental income for the month of June 2018, excluding the rental income from the UEBH Hotel Leased Premises.
VIVA ITRUST 17Diversified Quality Tenant Mix1
Top 10 tenants/sub-tenants account for 42% of monthly committed rental
income.
Sharikat Logistics Pte Ltd 7.6%
Cisco Systems (USA) Pte Ltd 6.0%
GKE Warehousing & Logistics Pte Ltd 4.7%
1-Net Singapore Pte Ltd 4.5%
Meiban Investment Pte Ltd 4.2%
NTUC Fairprice Co-operative Limited 3.9%
Home-Fix D.I.Y Pte Ltd 3.2%
Decathlon Singapore Pte Ltd 3.1%
Johnson Controls (S) Pte Ltd 2.6%
Teledirect Ptd Ltd 2.3%
Total 42.1%
1 As at 30 June 2018, excluding United Engineers Developments Pte Ltd as lessee of the UEBH Hotel Leased Premises.
VIVA ITRUST 18Staggered Lease Expiry Provides Income Stability
Expiry by % of Underlying Monthly Gross Rental Income1
40%
30%
22%
3%
20%
12%
5% 1%
2%
3%
0%
10% 7%
4%
11% 12%
3% 6% 7%
2%
0%
FY 2018 FY 2019 FY 2020 FY2021 FY2022 & Beyond
VBP UE BizHub East Jackson Square Others
• Secured over 235,000 sq ft of lease renewals and new leases in 2Q2018.
• Renewed 44.6% of leases due for renewal in FY2018 with an overall positive rental
reversion of 2.3%.
1. Based on committed leases as at 30 June 2018, assuming renewal options are not exercised and excluding United Engineers Developments Pte Ltd as lessee of the
UEBH Hotel Leased Premises.
VIVA ITRUST 19Successful Signing of Master Lease with Mauser
Master lease expiry risk mitigated with the signing of master lease with Mauser before lease
expiry on 31 May 2019.
• Executed forward master lease agreement for 5+5 years.
• 5% rental escalation every alternate year.
• 5 months of security deposit.
• No near-term master lease expiry in portfolio until FY2021.
VIVA ITRUST 20Outlook & Strategic Focus
VIVA ITRUST 21Proposed Merger with ESR-REIT
On 7 August 2018, the Managers announced:
• An extraordinary general meeting (“EGM”) and a scheme meeting of the Stapled
Securityholders will be held on 31 August 2018, Friday at 2.30pm and 4.00pm
respectively at Stephen Riady Auditorium @ NTUC, Level 7, NTUC Centre, One Marina
Boulevard, Singapore 018989.
1 2
Scheme Meeting
EGM 31 August 2018, Friday, 4.00pm
31 August 2018, Friday, 2.30pm or as soon thereafter following the conclusion or
adjournment of the EGM to be held, whichever is later
Resolutions Resolution
1. The proposed VIT Trust Scheme 1. The proposed merger of ESR-
Amendments to the VIT Trust REIT and Viva Industrial Trust by
Deeds way of a trust scheme of
arrangement
2. The VIT Facilitation Fee
Amendments to the VI-REIT
Trust Deed
VIVA ITRUST 22VIT’s Value Proposition
Best in Class Portfolio Anchored by Sizeable Integrated
1 Business Park Developments
• Integrated Business Park developments attract quality tenants by providing
complementary amenities that enliven the workplace.
• UE BizHub East is an unique business park development integrated with a
251-room hotel, convention centre and retail component, while Viva
Business Park has significant “white” component.
Proactive Leasing and Asset Management
2 • Secured over 235,000 sq ft of new leases and lease renewals in 2Q2018 with
positive rental reversion of 2.3%.
• Signed master lease agreement with Mauser for 5+5 years, mitigating master
lease expiry risk.
3 Crystalizing Value for Stapled Securityholders
• Differentiate ourselves in the challenging REITs market with active
management, deep relationships and prudent investment decisions while
bringing the REIT forward to outperform expectations and crystallise value
for our Stapled Securityholders.
23Thank you
You can also read