Volcanic impact on the climate - the stratospheric aerosol load in the period 2006-2015
←
→
Page content transcription
If your browser does not render page correctly, please read the page content below
Atmos. Chem. Phys., 18, 11149–11169, 2018
https://doi.org/10.5194/acp-18-11149-2018
© Author(s) 2018. This work is distributed under
the Creative Commons Attribution 4.0 License.

Volcanic impact on the climate – the stratospheric
aerosol load in the period 2006–2015
Johan Friberg1 , Bengt G. Martinsson1 , Sandra M. Andersson1,a , and Oscar S. Sandvik1
1 Division   of Nuclear Physics, Lund University, Lund, 22100, Sweden
a now   at: Core service, information and statistics, Swedish Meteorological and Hydrological Institute, Norrköping, Sweden

Correspondence: Johan Friberg (johan.friberg@nuclear.lu.se)

Received: 20 December 2017 – Discussion started: 25 January 2018
Revised: 7 June 2018 – Accepted: 9 July 2018 – Published: 10 August 2018

Abstract. We present a study on the stratospheric aerosol          1   Introduction
load during 2006–2015, discuss the influence from volcan-
ism and other sources, and reconstruct an aerosol optical          Aerosol particles have a large impact on the Earth’s climate.
depth (AOD) data set in a resolution of 1◦ latitudinally and       Trends in the abundance of aerosol particles are an impor-
8 days timewise. The purpose is to include the “entire” strato-    tant component of the climate system, although their influ-
sphere, from the tropopause to the almost particle-free al-        ence on climate is still highly uncertain (IPCC, 2014). For
titudes of the midstratosphere. A dynamic tropopause of            example, volcanic eruptions inject particles and the sulfate-
1.5 PVU was used, since it enclosed almost all of the volcanic     forming precursor gas sulfur dioxide (SO2 ) into the strato-
signals in the CALIOP data set. The data were successfully         sphere, where submicron particles may remain for up to sev-
cleaned from polar stratospheric clouds using a temperature        eral years. There, the aerosol particles scatter and absorb
threshold of 195 K. Furthermore, a method was developed to         solar radiation, hindering it from heating the surface of the
correct data when the CALIOP laser beam was strongly at-           Earth. The eruption of Mt Pinatubo in 1991 resulted in a
tenuated by volcanic aerosol, preventing a negative bias in        global cooling in excess of 0.5 ◦ C in the following years (Mc-
the AOD data set. Tropospheric influence, likely from up-          Cormick et al., 1995).
welling dust, was found in the extratropical transition layer         In recent years much attention has been drawn to a dis-
in spring. Eruptions of both extratropical and tropical vol-       crepancy between the Earth system models’ (CMIP5) pro-
canoes that injected aerosol into the stratosphere impacted        jections of temperatures to those of an observed slow-down
the stratospheric aerosol load for up to a year if their clouds    in the warming trend in the beginning of this century (Fyfe
reached lower than 20 km altitude. Deeper-reaching tropical        et al., 2013, 2016; Rajaratnam et al., 2015; Trenberth, 2015;
injections rose in the tropical pipe and impacted it for several   Xie et al., 2016; Yan et al., 2016), often called the hiatus. Part
years. Our AODs mostly compare well to other long-term             of the discrepancy was caused by bias in the temperature data
studies of the stratospheric AOD. Over the years 2006–2015,        (Karl et al., 2015). Likely reasons behind the remaining dis-
volcanic eruptions increased the stratospheric AOD on aver-        crepancy are fluctuations in oceanic heat sequestration, solar
age by ∼ 40 %. In absolute numbers the stratospheric AOD           blocking by volcanic aerosol in the stratosphere, and solar
and radiative forcing amounted to 0.008 and −0.2 W m−2 ,           forcing not captured by the state-of-the-art models (Ander-
respectively.                                                      sson et al., 2015; Medhaug et al., 2017; Meehl and Teng,
                                                                   2014; Myhre et al., 2013; Santer et al., 2014; Solomon et al.,
                                                                   2011).
                                                                      In the past decade several volcanic eruptions perturbed
                                                                   the stratospheric aerosol load, causing periods of increased
                                                                   stratospheric aerosol optical depth (AOD) that have been ob-
                                                                   served via remote sensing from satellites as well as ground-
                                                                   based (Khaykin et al., 2017; Sakai et al., 2016; Vernier et al.,

Published by Copernicus Publications on behalf of the European Geosciences Union.
11150                                                                        J. Friberg et al.: Volcanic impact on the climate

2011; Zuev et al., 2017), and in situ observations (Martinsson     vertical resolution (Winker et al., 2007). Vernier et al. (2009)
et al., 2017).                                                     developed a method of filtering out clouds, to study the
   In the tropics, upwelling tropospheric air enters the strato-   backscattering from aerosol particles above 15 km altitude.
sphere, bringing aerosol particles and precursor gases in-         The stratospheric AOD values have been computed from
cluding SO2 and carbonyl sulfide (OCS), contributing to the        the lidar backscattering from particles by assumptions on
background stratospheric aerosol. Which of these compo-            particle size distribution and composition (Jäger and Desh-
nents that dominates as source is still a topic of debate (Brühl   ler, 2002, 2003). Solomon et al. (2011) estimated the ra-
et al., 2012; Sheng et al., 2015). While the water-soluble SO2     diative forcing induced by the injection of volcanic aerosol
may be scavenged by cloud processes in convective trans-           above 15 km altitude during year 2000–2010 to be on av-
port, a large fraction of the OCS is transported to the strato-    erage ∼ −0.1 W m−2 . Their approach excluded the lower-
sphere where it is oxidized by UV radiation at ∼ 25 km al-         lying LMS, which contains approximately 40 % of the strato-
titude and contributes to the Junge layer (Crutzen, 1976). A       spheric mass. Including the LMS, Ridley et al. (2014) and
recent study by Rollins et al. (2017) indicates that SO2 con-      Andersson et al. (2015) revealed that the LMS contains a sig-
centrations in the tropical upper troposphere (UT) are too low     nificant fraction of the stratospheric aerosol, which influence
for general tropical SO2 upwelling to be a significant source      on the AOD had been neglected in previous studies. Hence,
of the stratospheric background aerosol.                           for estimation of the full climate impact of volcanism one
   Sulfate is the dominating constituent in the stratospheric      needs to consider the whole stratospheric column.
background as well as in the volcanic aerosol (Deshler,               In this paper we present the volcanic influence on the “en-
2008). In addition, organics (Friberg et al., 2014; Murphy et      tire” stratospheric AOD (from the tropopause to 35 km alti-
al., 2014), meteoritic matter, soil dust, and volcanic ash can     tude) over time and space, starting with studies on the trans-
be found in stratospheric aerosol particles. The ash compo-        port of volcanic aerosol within the stratosphere. New tech-
nent decreases rapidly after a volcanic eruption as the large      niques of handling the CALIOP data will be presented and
ash particles are gravitationally separated from the sulfate-      discussed: one being the removal of signals from polar strato-
forming volcanic SO2 layers and subside out of the strato-         spheric clouds (PSCs) and the other a means of correcting
sphere. Therefore it generally constitutes only a small frac-      data in periods when the lidar signal becomes attenuated by
tion of the stratospheric aerosol.                                 dense aerosol layers. Finally, the regional and global AODs
   Sandwiched between the tropopause and the overlying             are presented for the entire stratosphere in relation to trans-
380 K isentrope, the lowermost stratosphere (LMS) consti-          port patterns. As a means of representing the residence time
tutes the lowest part of the stratosphere. It is connected         of the aerosol from eruptions at several latitudes, reaching
with the troposphere through isentropic surfaces crossing the      various altitudes, the AOD is presented for three stratospheric
tropopause, where significant bidirectional transport of air       layers: the LMS, the potential temperature range of 380 to
takes place (Holton et al., 1995). Local air exchange oc-          470 K, and altitudes above the 470 K isentrope.
curs in a region extending a couple of kilometers above the
tropopause, termed the extratropical transition layer (ExTL;
Hoor et al., 2002). The ExTL is characterized by steep gra-        2   The CALIOP data
dients in chemical species that have different concentration
levels in the troposphere and stratosphere (Gettelman et al.,      This study of the stratospheric aerosol in the time period
2011).                                                             2006–2015 is based on measurements with the CALIOP in-
   The Brewer–Dobson circulation transports air meridion-          strument aboard the satellite CALIPSO (Cloud-Aerosol Li-
ally from the tropical stratosphere, in an overturning circula-    dar and Infrared Pathfinder Satellite Observation) in a joint
tion (Gettelman et al., 1997). Most of the air is transported      mission of NASA and the French space agency, CNES. The
in a low-altitude, or shallow, branch that spans an isentropic     almost nadir-viewing (3◦ ) CALIOP is a two-wavelength lidar
range of 380 to ∼ 450–470 K (Fueglistaler et al., 2009; Lin        utilizing three receiver channels (Winker et al., 2007, 2009).
and Fu, 2013). A portion of the air ascends in the so-called       One channel measures backscatter intensity at 1064 nm
tropical pipe. This high-altitude, or deep, branch extends         and two channels measure orthogonally polarized backscat-
to the stratopause (∼ 50 km altitude) and transports the air       ter intensity at 532 nm. The measurements result in high-
slowly, resulting in residence times of several years (Bönisch     resolution vertical profiles of aerosols and clouds: in the al-
et al., 2009). Air is then subsiding through the midlatitude       titude ranges 8.2–20.2, 20.2–30.1, and 30.1–40 km, with re-
and polar stratosphere, bringing aerosol particles down to the     spective vertical resolutions of 60, 180, and 300 m. During
LMS from higher stratospheric altitudes that eventually end        1 day, CALIPSO performs approximately 15 orbits between
up in the troposphere, where they are rapidly scavenged by         82◦ S and 82◦ N with a repeat cycle of 16 days (Winker et al.,
cloud processes.                                                   2010).
   The CALIOP (Cloud-Aerosol Lidar with Orthogonal Po-                This work is based on the Level 1B (version 4-10) night-
larization) instrument uses a lidar to retrieve observations of    time products of the 532 nm perpendicular and parallel po-
the backscattering from aerosol particles and clouds at high       larized channels. Together, the two channels provide the

Atmos. Chem. Phys., 18, 11149–11169, 2018                                          www.atmos-chem-phys.net/18/11149/2018/
J. Friberg et al.: Volcanic impact on the climate 11151
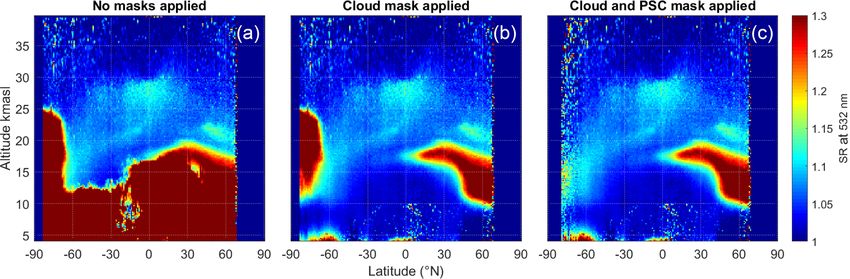
Figure 1. Illustration of the removal of cloud signals from the CALIOP data: (a) the original data and (b, c) removal of signals from ice
clouds and polar stratospheric clouds, respectively. Data averaged over August 2009 were used in this example. The strong aerosol signal in
the Northern Hemisphere comes from aerosol connected to the Sarychev eruption.
backscatter intensity. Their ratio, called polarization ratio, is et al., 2009). We will discuss this in Sect. 5, along with a
used to infer the shape of the scattering objects. In the present method we developed to correct for the increased attenua-
study each swath measured by CALIOP was averaged over tion occurring during periods when volcanism increased the
1◦ in latitude and averaged or interpolated to 180 m in al- stratospheric aerosol load. The improved calibration in the
titude. Polarization ratios were used to identify pixels con- version 4 (V4) data has reduced the bias of CALIOP, and by
taining clouds. From that a mask was formed for removal of comparison to airborne lidar (the HSRL: high spectral resolu-
pixels containing signals from clouds, using a 5 % threshold tion lidar) Kar et al. (2018) estimate the bias to be 1.6±2.4 %.
in the polarization ratio (Vernier et al., 2009). The mask was Up to 60 % of the mean bias (1.6 %) may have come from un-
expanded to remove weak signals from the edges of clouds, detected clouds and aerosols, suggesting it to be even lower.
and data below thick clouds were excluded (Andersson et al., We use the latest version of the CALIOP V4 data (V4-10),
2015); compare Fig. 1b with Fig. 1a for an example. and therefore expect potential bias in β 0 to have low impact
The measured backscattering intensity is the sum of the on our data analysis.
scattering from aerosol particles and air molecules. To sepa-
rate these two components, the molecular scattering of the air
was modeled based on ozone number density, atmospheric 3 Computing the stratospheric AOD
temperature, and pressure from the Global Modeling and As-
similation Office (GMAO). In this study we use the ratio of The AOD as a function of latitude was obtained by integrat-
the total scattering (β) to the modeled molecular scattering ing the AS in the vertical direction and multiplying it with
(βm ), the so-called scattering ratio (SR), and the difference the so-called lidar ratio, i.e., the extinction-to-backscattering
between them, the aerosol scattering (AS): ratio. The lidar ratio has been estimated in many studies and
is usually reported to span a range of values from ∼ 40 to
β ∼ 70 sr for stratospheric aerosol (Jäger et al., 1995; Kremser
SR = , (1)
βm et al., 2016; Prata et al., 2017 and references therein). In a
AS = β − βm = (SR − 1) · βm , (2) thorough study Jäger and Deshler (2003) reported a value of
50 sr for background stratospheric aerosol concentration and
The SR is an optical equivalent to mixing ratio and the AS to size distribution occurring at the end of the 1990s. This value
aerosol concentration. is commonly used for CALIOP (e.g., Hostetler et al., 2006;
The measured backscattering intensity is an “attenuated Khaykin et al., 2017; Solomon et al., 2011) and with that
backscattering” (β 0 ), due to light extinction of the laser value Khaykin et al. (2017) found good agreement between
pulses caused by molecules and particles. The attenuation CALIOP, other satellite instruments, and ground-based lidar.
that the laser pulses experience while passing through the In a recent long-term study, Thomason et al. (2018) found a
atmosphere is estimated using the so-called two-way trans- CALIOP lidar ratio of 53 sr, by comparing to data from the
mission parameter (T 2 ), which is the product of the two-way OSIRIS instrument. Prata et al. (2017) found that lidar ratios
transmissions by the two components (molecules and parti- of volcanic aerosol after the eruptions of Kasatochi (2008),
cles). The molecular part is estimated from modeling data Sarychev (2009) and Puyehue–Cordón Caulle (2011), where
of the molecular background (Hostetler et al., 2006; Winker ∼ 20–30 % higher but not statistically differing from the val-
et al., 2009), while the attenuation from particles is gener- ues reported by Jäger and Deshler (2003) and Thomason et
ally considered negligible (e.g., Khaykin et al., 2017; Vernier al. (2018). They used data from detected layers of relatively
www.atmos-chem-phys.net/18/11149/2018/ Atmos. Chem. Phys., 18, 11149–11169, 2018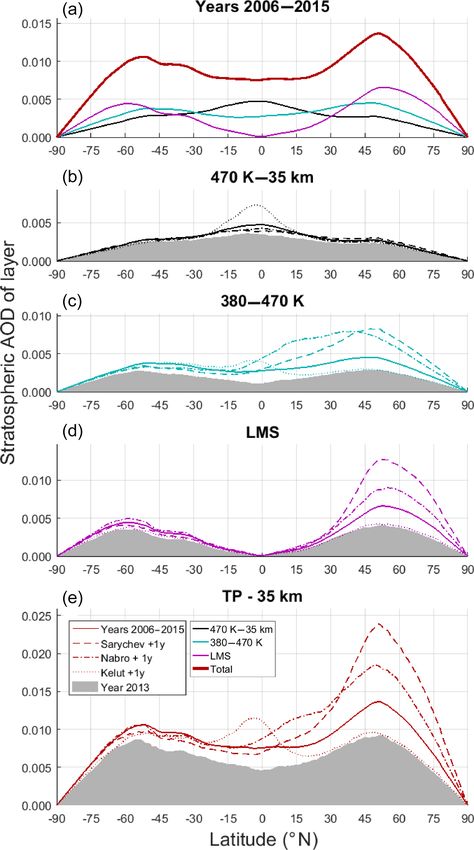
11152                                                                            J. Friberg et al.: Volcanic impact on the climate

fresh volcanic aerosol, whereas we use zonal means where           4     Handling PSCs
the volcanic and background aerosol are averaged together.
   The aerosol particle size distribution is needed to ob-         The occasional presence of PSCs results in strong back-
tain the AOD from the CALIOP lidar measurements. It is             scattering signals in the winter polar stratosphere that can
well established that large volcanic eruptions like that of Mt     cause bias to the stratospheric AOD. This is especially prob-
Pinatubo in 1991 cause a shift towards larger particle sizes       lematic in the Southern Hemisphere where the PSCs occur
in the stratosphere (Deshler, 2008), resulting in a variable       at latitudes from 60◦ S. This is illustrated in Fig. 1a as the
relation between lidar backscatter and extinction (Jäger and       high SR extending up to 25 km altitude in the Antarctic re-
Deshler, 2003). Measurements in the LMS show that vol-             gion. For investigation of the volcanic influence on the strato-
canic eruptions of Grimsvötn and Nabro in 2011 had only a          spheric aerosol, the influence from PSCs needs to be negli-
minor influence on the particle size distribution (Martinsson      gible, requiring a means of excluding data affected by these
et al., 2014), and they were similar to size distributions ob-     clouds. Andersson et al. (2015) solved this problem by man-
tained in periods of small volcanic impact (Jäger and Desh-        ually omitting periods with PSCs. In the present study, we
ler, 2002). We will therefore use the more conservative lidar      present a general approach to exclude the PSCs from the
ratio of 50 sr, corresponding to the background stratospheric      aerosol data.
aerosol (Jäger and Deshler, 2003), which is also close to the         Since PSC formation requires temperatures below 195 K,
value of 53 sr retrieved by Thomason et al. (2018).                that temperature was used as a minimum threshold for a PSC
   Existing stratospheric AOD data sets exclude the LMS.           mask applied to the polar regions, as a means of minimizing
They are based on measurements where the AOD was in-               the bias from PSCs. Furthermore, data below the clouds were
tegrated with the lower altitude limit being either the 380 K      removed to avoid bias from the strongly attenuated signals
isentrope (Bourassa et al., 2012; Sato et al., 1993) or 15 km      below the optically dense PSCs. This automated approach
altitude (Solomon et al., 2011; Vernier et al., 2011). A first     resulted in an almost complete removal of PSC signals, as
AOD estimation based on high-resolution measurements that          illustrated by comparing Fig. 1b and c, while keeping almost
included the LMS were presented by Andersson et al. (2015).        all of the data. Weak PSC signals remain, but its influence be-
As the lower altitude limit of the AOD integration they            comes negligible when averaged globally or hemispherically
used the tropopause supplied with the CALIOP data set,             since the Antarctic region (60–90◦ S) constitutes only 6 % of
a thermal tropopause (Pan and Munchak, 2011) based on              the Earth’s surface area.
GEOS5 (Goddard Earth Observing System Model Version 5)
data. The thermal tropopause according to the WMO defini-
tion on average resides more than 1 km above the dynamic           5     Correcting for errors caused by particle extinction
tropopause of 1.5 PVU in the extratropics (Wilcox et al.,
2012).                                                             5.1    Attenuation of the laser
   In the present study we use a dynamic tropopause as it
                                                                   Passing through the atmosphere, the laser beam is atten-
captures the chemistry better than the thermal one does. This
                                                                   uated by scattering and absorption from aerosol particles,
is reflected in that part of the volcanic aerosol in the present
                                                                   molecules, and O3 . Thus, the CALIOP instrument retrieves
study residing below the thermal tropopause. The location of
                                                                   an “attenuated backscattering” from laser pulses. Comput-
the dynamic tropopause was computed from potential vortic-
                                                                   ing the true backscattering requires information on the ex-
ity (PV) values obtained from ERA-Interim reanalysis data
                                                                   tinction through the overlying atmosphere. The attenuation
provided by the ECMWF (European Center for Medium
                                                                   is accounted for by the two-way transmission (T 2 ), where an
Ranged Weather Forecasts), and averaged to the same res-
                                                                   expression for the corrected backscattering becomes
olution as was the CALIOP data (1◦ latitudinally, 180 m ver-
tically). Using a lower tropopause will of course increase                β0
the stratospheric AOD and the duration of effects on strato-       β=        ,                                                 (3)
                                                                          T2
spheric AOD from volcanic eruptions. It will thereby pro-
vide a better estimate of the total stratospheric AOD. How-        where β 0 is the attenuated backscattering retrieved by
ever, lowering the tropopause leads to more influence from         CALIOP. The two-way transmission depends on two atten-
the ExTL (Hoor et al., 2004), thus increasing the influence        uating components, i.e., that of molecules (Tm2 ) and particles
from tropospheric aerosol on the estimate of the stratospheric     (Tp2 ) (Young et al., 2005), and can be expressed as their prod-
AOD. The location of the dynamic tropopause will be dis-           uct:
cussed more in Sect. 6.2.
                                                                   T 2 = Tm2 · Tp2 ,                                           (4)

                                                                   where the absorption from ozone molecules is here included
                                                                   in Tm2 . By combining Eq. (1), (3), and (4), an expression for
                                                                   the SR corrected from both molecular extinction and parti-

Atmos. Chem. Phys., 18, 11149–11169, 2018                                              www.atmos-chem-phys.net/18/11149/2018/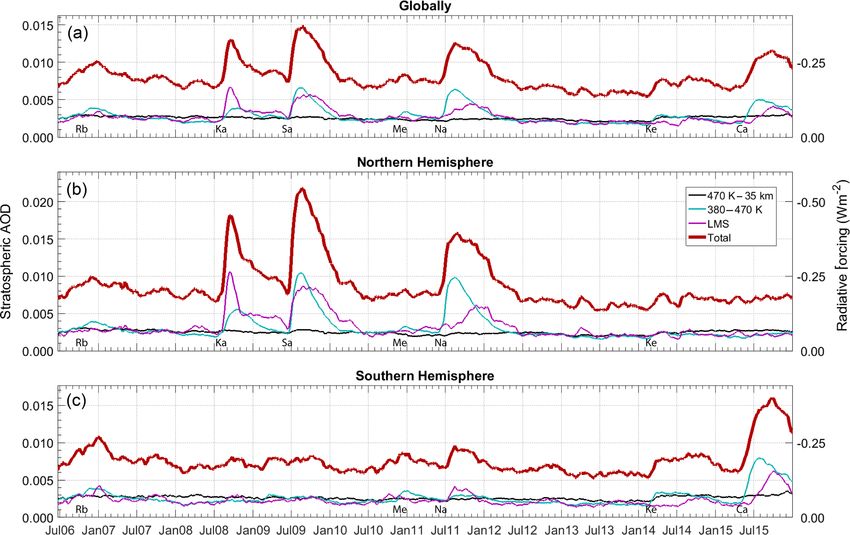
J. Friberg et al.: Volcanic impact on the climate 11153
cles becomes the AS in Fig. 3. The patterns of the Level 2 particle extinc-
β0 tion (Fig. 3a and c) and those of the AS (Fig. 3b and d) do
SRmpC = . (5) not match. The algorithm obviously fails to detect most of
Tm2 · Tp2 · βm
the relatively fresh volcanic clouds, and when the volcanic
Attenuation from molecules is computed based on modeling, aerosol is mixed with the background aerosol 5 months af-
but that by particles is generally not considered in studies ter the eruption (Fig. 3c and d) the Level 2 procedure does
based on CALIOP data. For example, Vernier et al. (2009) not detect any attenuating aerosol. In Fig. 2b it is clear that
and Khaykin et al. (2017) discuss that the attenuation from the SR in the UT still is strangely lowered 5 months after the
particles is less than 1 % at 15 km altitude in the absence Calbuco eruption. We therefore developed a means of cor-
of strong volcanic eruptions, arguing that corrections are un- recting for the attenuation caused by volcanic aerosol par-
necessary during these time periods. Assuming Tp2 = 1, the ticles, where the particle-related two-way transmission (Tp2 )
expression for the SR corrected from molecular extinction is calculated and applied to the SRmC data. This procedure
becomes follows below.
The apparent decrease in the UT SR (Fig. 2) following the
β0 largest eruptions of the time period studied indicates atten-
SRmC = , (6)
Tm2 · βm uation of the laser signal induced by particles. By assuming
from which the molecular-extinction-corrected AS (ASmC ) that the UT conditions remain approximately unchanged af-
can be computed using Eq. (2). ter volcanic eruptions the degree of attenuation in a given
Volcanic clouds may, however, result in non-negligible at- volcanically perturbed time and place can be estimated by
tenuation of the lidar signals. By neglecting the attenuation comparison with the signals in the years without strong vol-
caused by particles, part of the aerosol signal will be ac- canic influence. However, a volcanically perturbed strato-
counted for as signal coming from molecules, because the sphere results in a small elevation of the UT aerosol concen-
latter signal is also attenuated by the aerosol. Unaccounted tration. That effect can be assumed to be small for most of
for, the attenuation by volcanic aerosol particles can result in the eruptions of this study, but the lower cloud of Kasatochi
underestimation of the full effect of the volcanic impact of had a direct impact on the UT aerosol load (Andersson et al.,
the stratospheric aerosol load and the corresponding AOD. 2015). In Sect. 5.2 we present a method to handle that erup-
The attenuation is naturally increasing as the laser beams tion separately. By assuming the UT conditions to remain ap-
(and scattered light) pass through the atmosphere, causing proximately unchanged after all but the Kasatochi eruption,
the largest errors to occur for signals retrieved from the we can estimate the two-way transmission from particles at
lower altitude side of volcanic clouds, and below them. In the altitude of the tropopause:
the present work this corresponds to the strongest attenua- hSRmC,ut iv hSRmC,ut ibg
tion being at the tropopause and in the UT. hSRut iv = hSRut ibg ⇒ 2
= 2 i
hTp,ut iv hTp,ut bg
In the present study, we first corrected the data by comput-
2 i
hTp,tp
ing the two-way transmission caused by the attenuation from v hSRmC,ut iv
molecules (Eq. 6). This correction is sufficient in the absence ⇒ 2 i
= ,
hTp,tp bg hSRmC,ut ibg
of volcanic clouds, but light extinction caused by aerosol par-
ticles in dense volcanic clouds resulted in further attenuation 2 is the two-way transmission at the tropopause,
where Tp,tp
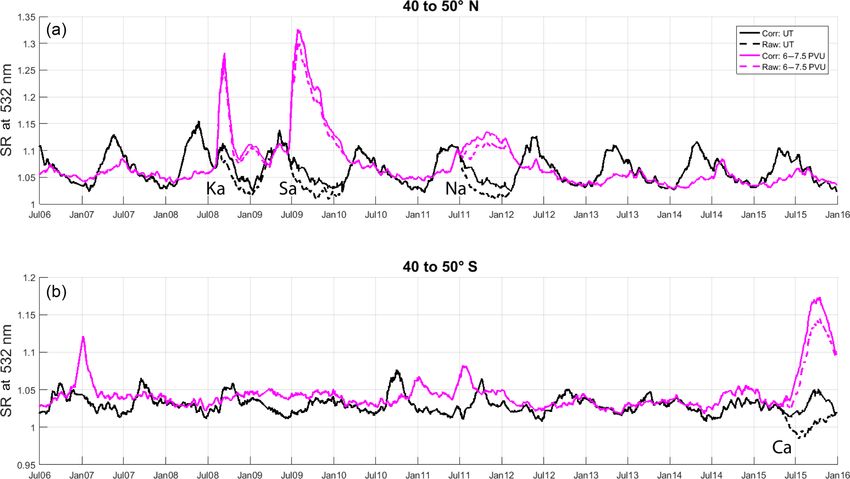
of the CALIOP laser. This is evident in Fig. 2 (black dashed and the indexes v and bg represent volcanic and background
line) where apparent decreases in SR arise in the UT after conditions. Furthermore, we assume that hTp,tp2 i = 1 since
bg
the volcanic eruptions of Sarychev, Nabro, and Calbuco. The the particle extinction is small in background conditions, and
most dramatic decrease is observed for the SR data after the we end up with
eruption of Calbuco in 2015, where strong attenuation re-
sulted in unphysically low SR, i.e., below 1. 2 hSRmC,ut iv
hTp,tp iv = . (7)
hSRmC,ut ibg
5.2 Estimating the two-way transmission from particle
extinction T 2 values can theoretically be in the range of 0 to 1. In this
2 i are distributed from 0.95 to 1, with the major-
work hTp,tp v
The two-way transmission from particles can be retrieved by ity of values being > 0.97. Thus, the decreases in SR under
a complicated technique in which strongly attenuating fea- volcanic clouds are mostly on the order of 2–5 %, which may
tures in the CALIOP data are first identified and then an it- appear to be negligibly low. For example, Fig. 2a shows typ-
erative process is used as means of estimating particle ex- ical decreases in SR to be on the order of 0.025 in absolute
tinctions in attenuating layers (Young et al., 2005). The layer terms, from for example hSRmC,ut ibg of 1.050 to hSRmC,ut iv
detection requires the use of a threshold value for identifi- 2 i
of 1.025. Using Eq. (7) these values correspond to a hTp,tp v
cation of attenuating features. The resulting particle extinc- of 0.976. However, transferred to the AS and AOD these de-
tion parameter in the CALIOP Level 2 data is compared with viations become relevant. Using Eq. (2), and assuming βm to
www.atmos-chem-phys.net/18/11149/2018/ Atmos. Chem. Phys., 18, 11149–11169, 2018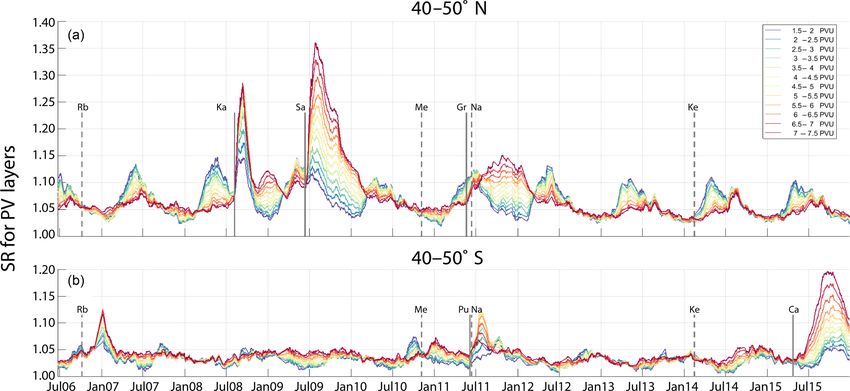
11154                                                                              J. Friberg et al.: Volcanic impact on the climate

Figure 2. Examples illustrating the effects from corrections made to compensate for the laser attenuation caused by aerosol particles. The
scattering ratios (SR) were averaged over the latitude intervals (a) 40–50◦ N and (b) 40–50◦ S for the UT (black; 250–1000 m below the
tropopause) and the PV layer of 6–7.5 PVU (magenta). Volcanic eruptions are indicated by their abbreviations. Both layers are on average
approximately 750 m thick). Corrected (uncorrected) data are marked as full (dashed) lines.

Figure 3. Comparisons of the particle extinction parameter from the level 2 data v4-10 (a, c) and the aerosol scattering (b, d) taken after
the Calbuco eruption. The upper figures were taken 3 weeks after the eruption (on 13 May 2015), and the lower almost 4 months after the
eruption (on 17 September 2015). Data in b and d were based on the attenuated backscattering at 532 nm in the level 1 v4-10 data, and
modeling of the molecular scattering. The white lines mark the thermal tropopause.

Atmos. Chem. Phys., 18, 11149–11169, 2018                                                www.atmos-chem-phys.net/18/11149/2018/
J. Friberg et al.: Volcanic impact on the climate 11155
be equal during volcanic periods and background, we end up
with 2
TOA
P
hASmC,ut iv hSRmC,ut iv − 1 1.025 − 1 ASmC (z)
= = = 0.50, 2
z+1
hASmC,ut ibg hSRmC,ut ibg − 1 1.050 − 1 Tp (z) = 1 − 1 − Tp,tp , (10)
TOA
P
ASmC (z)
the hASmC,ut iv and hASmC,ut ibg being the AS in the UT dur-
TP
ing volcanic and background conditions. Thus, if the attenu-
ation by particles is unaccounted for, the AOD of the UT gets where z is the altitude bin, and the TOA is at 35 km altitude.
underestimated by as much as 50 % in the current example, This linear method produces Tp2 values that in the current
since we retrieve the AOD linearly from the AS. A small ef- study deviate by
1 % from those computed by the multi-
fect on the SR is transformed into a large effect on the AS plicative method, and the resulting AOD values deviate by
and AOD because before the correction half of the aerosol < 1 %. However, the deviations grow with the size of the
signal was accounted as signal from molecules in the exam- particle extinction values and may become more relevant for
ple above. This simple example illustrates that apparent tiny eruptions of the size of the 1991 Pinatubo eruption.
decreases in the T 2 may result in large underestimations in
the computed AOD of low altitude layers, i.e., the LMS and The Kasatochi eruption
especially the ExTL and UT. Once computed, the hTp,tp 2 i are
v
Since Kasatochi’s lower cloud increased the UT aerosol load
combined with the column-integrated ASmC data to compute 2 i could not be retrieved directly using Eq. (7) for
the hTp,tp v
two-way transmission matrices for the whole stratospheric
that eruption. Instead we made use of the similar extratropi-
column (Tp2 ).
cal eruption of Sarychev. For Sarychev we found the extinct
To compute Tp2 values for the whole stratospheric column, fraction (1 − hTp,tp iSar ) to be related to the amount of aerosol
the integrated column of stratospheric ASmC values are used TOA
as a means of normalizing the Tp2 values from the “top of
P
in the column, i.e., the column-integrated AS ( ASSar ).
the atmosphere” (TOA), here 35 km altitude, down to the TP
2 i after Kasatochi was estimated indirectly from
The hTp,tp
tropopause. In this procedure the uppermost altitude bin gets v
a Tp2 value of 1, and altitude bins below get lower Tp2 values, that relation:
down to the tropopause where the Tp,tp 2 is computed from TOA TOA
P P
Eq. (7). We start by using the fraction that becomes extinct ASKas ASSar
TP TP
by particles: = , (11)
1 − hTp,tp iKas 1 − hTp,tp iSar
Extp = 1 − Tp (8)
where the indexes indicate the respective volcano. Combined
and formulate an expression for estimating the fraction ex- with Eq. (8) and rearranging yields the expression for es-
tinct in a single altitude bin (a), timating the UT-particle-related two-way transmission after
the Kasatochi eruption:
ASmC,a
Extp,a = · Extp,tp , (9) TOA 2
TOA P
AS
P
ASmC (z) Kas
TP 2 TP
hTp,tp iKas = 1 − · hTp,tp iSar . (12)
TOA
P
ASSar
where Extp,tp is the extinct fraction at the tropopause (1 −
TP
Tp,tp ), ASmC,a is the molecular corrected AS in altitude bin a,
and the denominator holds the integrated backscattering for 5.3 Correcting the data
the total stratospheric column where z is the altitude bin. The
transmission through the column can be computed by multi- Once the Tp2 is known, the scattering ratios can be cor-
plying the transmission through each layer. Such an approach rected in regard to the attenuation by particles by combining
may result in instabilities when the ASmC values become Eqs. (5) and (6):
close to zero or negative, as was the case after the eruption
of Calbuco, i.e., the SRmC < 1 in Fig. 2b corresponds to neg- β0 SRmC
SRmpC = = , (13)
ative ASmC . By instead assuming linearity we can compute Tm2 · Tp2 · βm Tp2
the extinction at each altitude simply by summing the ex-
tinction in each overlying layer. Combined with Eq. (8), this and the corresponding aerosol scattering (ASmpC ) can be
procedure yields the following expression for the altitude- computed from insertion into Eq. (2). By this, our method
dependent two-way transmission from particles: introduces a simple means of correcting the data to account
for particle attenuation.
www.atmos-chem-phys.net/18/11149/2018/ Atmos. Chem. Phys., 18, 11149–11169, 201811156 J. Friberg et al.: Volcanic impact on the climate
To study the sensitivity of the method, an iterative process slightly lower altitude, as a result of the eruption of Rabaul
was performed where the ASmpC data were used to com- in 7 October 2006. The next major feature appears in October
pute new Tp2 values. We found only negligible changes in 2008. Aerosol from the eruption of the extratropical volcano
the SRmpC and ASmpC after these iterations. Thus, the devel- Kasatochi in 7 August 2008 formed two layers at different al-
oped procedure was found to be a robust method for correct- titudes. The influence from this eruption remained in January
ing stratospheric CALIOP data for the attenuation caused by 2009, and in April more volcanic aerosol was added close to
particle extinction. the tropopause by the eruptions of Redoubt in March and
Correcting the CALIOP data following volcanic eruptions, April 2009. A feature appearing above 20 km altitude in the
according to the equations above, significantly changes the southern tropics in April has been identified as smoke from
SR, as shown in Fig. 2 (dashed vs. full lines). The global bush fires in February 2009 in Victoria, Australia (Vernier et
mean stratospheric AOD in the first 8 months after eruptions al., 2011). In July 2009 the northern hemispheric stratosphere
increased by 4 % (Kasatochi), 6 % (Sarychev), 6 % (Nabro), was perturbed again, this time by the extratropical volcano
and 7 % (Calbuco; Fig. 2b). These numbers are the result Sarychev (12 June 2009), with the SR signal still clearly vis-
of relatively small volcanic elevations in the stratospheric ible in January 2010. In January 2011 aerosol from the erup-
aerosol load. The influence of particle extinction naturally tion of the tropical volcano Merapi (5 November 2010) had
grows with the strength in elevation of the aerosol concen- affected mainly the southern hemispheric stratosphere. Three
trations. Thus, eruptions of the size of the 1991 eruption of volcanic eruptions influenced the stratosphere in July 2011.
Mt Pinatubo, which was more than a magnitude larger than The southern hemispheric Puyehue–Cordón Caulle (5 June
the eruptions of this study, would result in a strong need to 2011) and the northern hemispheric Grimsvötn (21 May
correct the data for the particle extinction. 2011) affected the respective LMSs, and aerosol from the
tropical Nabro (12 June 2011) went to the north and affected
the stratosphere for approximately 1 year. After a couple of
6 Results years with lower activity the tropical volcano Kelut erupted
(13 February 2014), reaching above 20 km altitude. The ma-
Large quantities of background sulfuric acid aerosol are pro- jority of the SR signal was confined to the tropics, but over
duced deep into the stratosphere from OCS that is transported a year, part of the aerosol was transported to the extratropics
from the tropical troposphere in the Brewer–Dobson circula- while the remaining tropical aerosol rose to higher altitudes.
tion (Crutzen, 1976) together with particles, SO2 , and other Finally, the southern hemispheric extratropical volcano, Cal-
particle precursors from natural and anthropogenic sources. buco (23 April 2015), induced the highest SR that occurred
To this rather stable stratospheric background, special events in the Southern Hemisphere during 2006–2015. The effect of
inject large amounts of particles and precursor gases into this eruption still remains at the end of the period.
the stratosphere, causing large variability in the stratospheric Another interesting feature in Fig. 4 is the variability at
aerosol load. The most common cause of this variability is altitudes above 30 km, which is connected with the quasi-
explosive volcanic eruptions (Robock, 2000), but large fires biennial oscillation (QBO) (Vernier et al., 2011). The strato-
can occasionally influence the stratospheric aerosol (Fromm spheric temperature varies with the QBO, in the 30–50 hPa
et al., 2010). For the time period studied here, mid-2006 to layer by almost 10 ◦ C, with the highest temperatures in
2015, several volcanic eruptions and two large fires had such the westerly shear (Baldwin et al., 2001). Modeling indi-
potential. Table 1 lists these events starting more than a year cates that the QBO-associated temperature variability in-
before mid-2006 to account for the long residence time of duces QBO-related altitude dependence in sulfuric acid evap-
volcanic aerosol going deep into the stratosphere; e.g., the oration from the aerosol (Hommel et al., 2015). Hence, at
aerosol load following the Mt Pinatubo eruption in 1991 de- these altitudes less aerosol is present during the westerly
clined over several years (McCormick et al., 1995). shear.
The SR deals with properties relative to the air mass, but
6.1 The volcanic impact on the SR and AS from a climatic point of view the AS, i.e., the absolute mea-
sure of the scattering by aerosols (Eq. 2), is of importance.
The stratospheric aerosol load varied substantially during Figure 5 shows the AS as a function of time and altitude in six
the period studied, as indicated in Fig. 4, where the SR is latitude bands, each constituting 16 % of the Earth’s surface
illustrated in relation to latitude and altitude averaged for area. The white lines mark the mean upper and lower limits
the months January, April, July, and October over the years of the LMS, i.e., the 380 K isentrope and the tropopause.
2006–2015. Already in the first month, July 2006, a fea- Elevated AS is clearly observed both after the stronger and
ture is seen in the tropics at 19 km altitude. This was caused weaker volcanic eruptions, and a striking feature in Fig. 5 is
by the eruption of the Soufrière Hills volcano in 20 May the transport patterns where volcanic clouds in the tropics
2006 (Vernier et al., 2009), approximately 1 month before (extratropics) ascend (descend). Several eruptions reached
the start of measurements from CALIPSO. In October of above 380 K, but it is also shown that a large portion of the
the same year a second feature appears to the south and at aerosol was located in the LMS. Part of that aerosol came
Atmos. Chem. Phys., 18, 11149–11169, 2018 www.atmos-chem-phys.net/18/11149/2018/J. Friberg et al.: Volcanic impact on the climate 11157
Table 1. Volcanic eruptions and wildfires in the 21st century that affect (or had the potential to affect) the aerosol loading of the stratosphere.
NA is not available.
Volcano Date Lat. Long. VEIa SO2 (Tg)
Ulawun 29 September 2000 5◦ S 151◦ E 4 NA
Shiveluch 22 May 2001 57◦ N 161◦ E 4 NA
Ruang 25 September 2002 2◦ N 125◦ E 4 0.03b
Reventador 3 November 2002 0◦ S 78◦ W 4 0.07b
Anatahan 10 May 2003 16◦ N 146◦ E 3 0.03b
Manam 27 January 2005 4◦ S 145◦ E 4 0.09b
Sierra Negra 22 October 2005 1◦ S 91◦ W 3 NA
Soufrière Hills 20 May 2006 17◦ N 62◦ W 3 0.2c
Rabaul Rb 7 October 2006 4◦ S 152◦ E 4 0.2b
Jebel at Tair 30 September 2007 16◦ N 42◦ E 3 0.08d
Great Divides Fire Gd 1 December 2006 37◦ S 144◦ E – –
Chaitén 2 May 2008 43◦ S 73◦ W 4 0.01e
Okmok 12 July 2008 53◦ N 168◦ W 4 0.1d
Kasatochi Ka 7 August 2008 52◦ N 176◦ W 4 1.7d
Fire in Victoria Vi 7 February 2009 37◦ S 145◦ E – –
Redoubt 23 March 2009 60◦ N 153◦ W 3 0.01f
Sarychev Sa 12 June 2009 48◦ N 153◦ E 4 1.2g
Eyjafjallajökull 14 April 2010 64◦ N 20◦ W 4 NA
Merapi Me 5 November 2010 8◦ S 110◦ E 4 0.4h
Grimsvötn Gr 21 May 2011 64◦ N 17◦ W 4 0.4i
Puyehue–Cordón Caulle Pu 6 June 2011 41◦ S 72◦ W 5 0.3i
Nabro Na 12 June 2011 13◦ N 42◦ E 4 1.5i
Kelut Ke 13 February 2014 8◦ S 112◦ E 4 0.2j
Calbuco Ca 23 April 2015 41◦ S 73◦ W 4 0.3k
a Volcanic Explosivity Index (from Global Volcanism Program, http://www.volcano.si.edu/, last access: 14 November 2017).
b Prata and Bernardo (2007). c Carn and Prata (2010). d Thomas et al. (2011). e Carn et al. (2009). f Lopez et al. (2013).
g Haywood et al. (2010). h Surono et al. (2012). i Clarisse et al. (2012). j Li et al. (2017). k Pardini et al. (2017).
from the direct injection of volcanic clouds in the extratrop- comes the lowest of the 380 K isentrope and that of a chosen
ics. Volcanic injections to higher altitudes eventually reach PV surface. The lowest commonly used dynamic tropopause,
the LMS due to the latitudinal transport and subsidence in the 1.5 PVU surface, is on average located approximately
the midlatitudes within the Brewer–Dobson circulation. Fur- 1.3 km below the thermal tropopause. Integration from this
thermore, a seasonal variation is revealed in the strong signal dynamic tropopause increases the total stratospheric AOD
from particles in the extratropical troposphere, with the max- compared to when using the thermal tropopause. Here the
imum AS occurring in spring–summer. A small part of this aim is to use as low a PV level as possible for the best possi-
tropospheric source extends into the ExTL. Its possible in- ble enclosure of the stratospheric volcanic aerosol. However,
fluence on the stratospheric aerosol load will be discussed in before deciding the tropopause level we need to consider the
Sect. 6.3. impact from tropospheric aerosol in the ExTL.
In Figs. 1 to 5, we assumed the 1.5 PVU level to be a good
6.2 Using the dynamic tropopause representation of the tropopause. Figure 6 illustrates a simple
means of investigating the best-suited PV value of a dynamic
The dynamic tropopause was chosen to represent the lower tropopause where the SRs in approximately 0.25 km thick
boundary of the LMS as it is expected to best enclose the layers of the atmosphere above the 1.5 PVU level (LMS) are
stratospheric air carrying volcanic aerosol. The PV of the plotted for the midlatitudes of each hemisphere over the en-
dynamic tropopause varies between different studies (Get- tire time frame of our study.
telman et al., 2011) and is generally considered to lie some- It is evident from Fig. 6 that the strong volcanic eruptions
where in the range of 1.5–3.5 PVU (Hoerling et al., 1991; of Sarychev and Calbuco induced strong gradients in the SR
Hoinka, 1997; Kunz et al., 2011). The PV fields become ver- throughout the ExTL, and that volcanic influence is present
tical close to the equator. Therefore the 380 K isentrope is down to the lowest PV range, i.e., the 1.5–2 PVU. This is fur-
used as a limit of the dynamic tropopause’s maximum possi- ther corroborated by in situ particulate sulfur measurements
ble altitude. Thus, the altitude of the dynamic tropopause be- (Martinsson et al., 2017). Unlike these eruptions, Kasatochi
www.atmos-chem-phys.net/18/11149/2018/ Atmos. Chem. Phys., 18, 11149–11169, 201811158 J. Friberg et al.: Volcanic impact on the climate Figure 4. Monthly mean scattering ratio as a function of latitude and altitude (7–35 km) in the months January, April, July, and October for the years 2006–2015. Atmos. Chem. Phys., 18, 11149–11169, 2018 www.atmos-chem-phys.net/18/11149/2018/
J. Friberg et al.: Volcanic impact on the climate                                                                                     11159

Figure 5. Aerosol scattering against time and altitude in six latitude bands, each covering 16 % of the Earth’s surface area. The white lines
mark the mean altitudes of the tropopause and the 380 K isentrope.

Figure 6. Temporal trends of the scattering ratio in altitude layers in the lower part of the LMS (PV intervals of 0.5 PVU), for the latitude
bands 40–50◦ N (a) and 40–50◦ S (b). Vertical solid lines mark extratropical volcanic eruptions, and dashed lines indicate tropical eruptions
that impacted the respective Hemisphere.

www.atmos-chem-phys.net/18/11149/2018/                                                  Atmos. Chem. Phys., 18, 11149–11169, 2018
11160                                                                        J. Friberg et al.: Volcanic impact on the climate

injected large amounts of volcanic aerosol in the lower parts      sphere into three layers for which we calculated AOD. This
of the LMS and the UT. As a result, the aerosol signal is          sub-division was based on transport patterns: the upper layer
strong also in the lowest LMS layer of Fig. 6a (1.5–2 PVU).        extends down to the 470 K isentrope, and represents the re-
   The local tropospheric sources’ contribution to the strato-     gion where the latitudinal transport is weak (Fueglistaler et
spheric aerosol load are small in comparison to the signals of     al., 2009; Lin and Fu, 2013), the LMS constitute the low-
strong volcanic eruptions from Kasatochi, Sarychev, or Cal-        est layer, and in between is the midlayer-spanning isentropes
buco, making them negligible in the perspective of the strato-     of 380–470 K, where the shallow Brewer–Dobson branch is
sphere’s total AOD. They do, however, have significant rela-       strong. This categorization of stratospheric layers will be
tive influence on the ExTL in the absence of strong volcanic       used in the following discussions.
eruptions.                                                            The temporal trends of the global and hemispheric mean
   The value of 1.5 PVU is the lowest dynamic tropopause           AODs are compared in Fig. 8 for the three layers and for that
commonly used, and based on the investigation above, a             of the “entire” stratosphere. Even though the LMS is mostly
PV value of 1.5 PVU was chosen to represent the dynamic            confined to the extratropics, and altitudes above 470 K con-
tropopause in the following analyses, as it best captures the      stitute a small portion of the stratospheric mass, it is evi-
“full” volcanic impact on the stratosphere and on the climate.     dent that aerosol in these layers make up a significant por-
                                                                   tion of the global stratospheric AOD. In times of low vol-
6.3    Volcanic and tropospheric impact in the ExTL                canic impact the three layers contribute in approximately
                                                                   equal amounts to the total stratospheric AOD. Furthermore,
Many interesting features can be seen in comparisons of the        Figs. 7 and 8 show that the global stratospheric AOD reached
atmospheric slices in the lower part of the LMS (Fig. 6)           its lowest values in the studied decade around the year 2013.
and of the two hemispheres. The largest peaks in the SR            This is in agreement with in situ observations that find the
occurred after major volcanic eruptions in the extratropics        stratospheric aerosol load to be at background conditions in
(Kasatochi, Sarychev, and Calbuco), which affected their re-       2013 (Martinsson et al., 2017).
spective hemispheres. In the aftermath, the SR is highest             We further explore the AOD distribution by investigating
deep into the LMS (at the highest PVs) and decreases down          the strong latitudinal patterns shown in Fig. 7. This is illus-
to the tropopause. This gradient is caused by gradual mixing       trated in Fig. 9, where the AOD was averaged over different
of stratospheric air, carrying volcanic aerosol, with cleaner      time periods. In Fig. 9a we find the AOD to be distributed
tropospheric air.                                                  very differently in the respective layers. The upper layer has
   In the absence of major volcanic eruptions, the highest         its highest AOD in the tropics and it decreases towards the
SR is found in spring close to the tropopause. Thus, the SR        poles. The LMS naturally shows the highest AODs in the ex-
gradient is reversed compared to the periods dominated by          tratropics. The largest elevations in the LMS AOD relative to
volcanism, and it is more evident in the Northern than in          background conditions are observed in the Northern Hemi-
the Southern Hemisphere. Figure 5 shows that the gradient          sphere due to stronger volcanic influence. The midlayer is
is connected to a springtime–summertime increase in AS in          shown to have more evenly distributed AOD, with slightly
the troposphere. Hence, we conclude that tropospheric local        higher AOD in the extratropics, and the highest in the North-
sources have significant influence in the ExTL during spring.      ern Hemisphere. In Fig. 9b–d we separate the layers, to com-
These sources are obviously less important in the Southern         pare the influence from three types of volcanic eruptions to
Hemisphere. Aircraft measurements in the ExTL revealed             that of the decadal mean and that of the background condi-
that upwelling dust peaks in spring (Martinsson et al., 2005).     tions (year 2013).
These observations suggest that the spring–summer peaks in
the lowest part of the LMS are caused by upwelling dust. Its       7.1   The different eruption types
impact on the total stratosphere is small and is rapidly de-
creasing in strength in the first 2 km above the tropopause        It is evident that the impact on the stratospheric AOD varied
(1.5–5.5 PVU, the ExTL). Fluctuations caused by local tro-         between eruptions and that only a few eruptions reached into
pospheric sources therefore have only a minor influence on         the uppermost layer. The eruptions that had significant im-
the stratospheric aerosol.                                         pact on the stratospheric AOD were grouped into three cate-
                                                                   gories depending on the observations in Fig. 7. These types
                                                                   are as follows:
7     Discussions                                                    – Trop I – Tropical eruptions with deep-reaching volcanic
                                                                       clouds, which were to a large degree incorporated into
The stratospheric AOD is obtained by converting aerosol                the deep Brewer–Dobson branch and ascended in the
scattering to extinction based on the particle size distribution       tropical pipe.
and chemical composition (Jäger and Deshler, 2002, 2003)
and integrating in the vertical direction. The patterns of vol-      – Trop II – Tropical eruptions with clouds that were
canism are evident in Fig. 7 where we divided the strato-              confined in the midlayer, transported in the shallow

Atmos. Chem. Phys., 18, 11149–11169, 2018                                          www.atmos-chem-phys.net/18/11149/2018/
J. Friberg et al.: Volcanic impact on the climate 11161
Figure 7. The latitudinal distribution over 10 years for the latitude-weighted stratospheric AOD: (a) above the 470 K isentrope, (b) between
the 380 and 470 K isentropes, (c) the LMS, and (d) that of the entire stratosphere. The color bar for panels (a)–(c) spans a range of one-third
that in panel (d). Abbreviations and triangles (circles) mark time and latitude of relevant volcanic eruptions (forest fires).
Brewer–Dobson branch, and not significantly trans- Kelut volcano erupted after this period of stratospheric back-
ported in the deep branch. ground levels, making it easy to track the spread of the vol-
canic aerosol. A large fraction of the volcanic cloud slowly
– Extrop – Volcanic clouds from extratropical eruptions. ascended with the deep Brewer–Dobson branch in the trop-
Some of these were confined within the LMS, and ical pipe, whereas the lower part of it was spread latitudi-
others partly penetrated into the midlayer where the nally in the midlayer, mostly to the southern extratropics
aerosol was incorporated into the shallow Brewer– (Figs. 4 and 9). The high-altitude part of the cloud was con-
Dobson branch and spread to the tropics. fined within the tropics. A small sudden increase in the AOD
The impact of the volcanic eruptions will be discussed is observed in the southern extratropics (Fig. 7a), approxi-
based on these categories in the following sections, along mately 1.5 years after the Kelut eruption. The elevation is
with the two wildfires. shown as in Fig. 7a and was likely connected with aerosol
injected by the midlatitude eruption of Calbuco (April 2015).
7.1.1 Deep reaching tropical volcanic eruptions The aerosol load of the upper layer shows minor fluctuations
which can be caused by evaporation or condensation of sul-
Two volcanoes significantly affected the upper layer furic acid (Vernier et al., 2011) in the upper part of the layer
(Fig. 7a), i.e Soufrière Hills (May 2006) and Kelut (Febru- in connection with temperature variability induced by the
ary 2014). In addition, part of the elevations in AOD from quasi-biennial oscillation (Hommel et al., 2015). The aerosol
summer 2006 may have come from the January 2005 Manam in the upper layer is eventually transported out to the next
eruption (Vernier et al., 2009). The high-reaching part of the lower layer at midlatitudes, i.e the one confined between the
Soufrière Hills cloud slowly ascended in the tropics. A strong 380 and 470 K isentropes. We observe this in the 380–470 K
elevation of the AOD is visible for more than 1.5 years after layer in northern midlatitudes (Fig. 7b), where the AOD was
the eruption, after which the AOD decreases slowly over the
following years until reaching its lowest values in 2013. The
www.atmos-chem-phys.net/18/11149/2018/ Atmos. Chem. Phys., 18, 11149–11169, 201811162 J. Friberg et al.: Volcanic impact on the climate
Figure 8. Temporal trends of the stratospheric AOD and radiative forcing for (a) the entire globe, (b) the Northern Hemisphere, and (c) the
Southern Hemisphere. The lines mark the AOD of the LMS (magenta), altitudes between the 380 and 470 K isentropes (cyan), altitudes
above the 470 K isentrope (black), and the entire stratosphere (thick red). Significant volcanic eruptions are indicated by their abbreviations.
Note the reversed scale for the radiative forcing on the right y axis. Data were extrapolated to the polar regions and latitude weighted before
averaging.
higher in the year 2007 and beginning of 2008 compared to 7.1.3 Extratropical volcanic clouds
the background (year 2013).
Several extratropical eruptions impacted the northern hemi-
7.1.2 Tropical eruptions below the 470 K isentrope spheric stratosphere, and some influenced the southern one.
In the Northern Hemisphere, Kasatochi (August 2008) and
The volcanic clouds of the tropical eruptions from Rabaul Sarychev (June 2009) induced the strongest elevations in the
(October 2006), Merapi (November 2010), and Nabro (June AOD. Part of the aerosol from these eruptions reached the
2011) all penetrated the tropopause but did not reach alti- midlayer, where it was spread to the tropical stratosphere
tudes above the 470 K isentrope (∼ 20 km). While the two within the shallow Brewer–Dobson branch. Figure 8 shows
former eruptions impacted both hemispheres, the Nabro that some patterns of the global and northern hemispheric
eruption mostly influenced the Northern Hemisphere (Figs. 7 mean AOD in the midlayer after Sarychev are similar to
and 9). The small increase shown after Nabro in the South- that of the Nabro eruption. The latitudinal distributions in
ern Hemisphere LMS (Fig. 9) was caused by the extratrop- the midlayer shows similarities (Fig. 9c), but being a tropical
ical eruption of Puyehue–Cordón Caulle (June 2011). The eruption Nabro naturally had a greater impact in the tropics.
aerosol from the Trop II eruptions was incorporated into the The Kasatochi eruption formed two clouds. Kasatochi’s
shallow Brewer–Dobson branch and spread to the midlati- dense lower cloud was confined to the LMS and UT.
tudes within weeks. There the volcanic aerosol subsided and Its stratospheric part was transported to the tropopause
increased the AOD of the LMS, while decreasing in the mid- within approximately 3 months. The remaining weaker sig-
layer (Figs. 7 and 8). The AOD in the midlayer decreased nal comes from the upper cloud that descended to the LMS
over ∼ 9 months in the case of the strong Nabro eruption, and (Fig. 8). The upper cloud reached the 380–470 K layer, and
the subsidence through the LMS resulted in several months shows some similarities with that from the Sarychev and
prolonging of the volcanic impact of the eruption (Figs. 7 and Nabro eruptions, having a rapid latitudinal transport in the
8). lower BD branch. For all three eruptions, the elevation of
the AOD remained until the following spring until the strong
subsidence transported the aerosol down to the troposphere.
Atmos. Chem. Phys., 18, 11149–11169, 2018 www.atmos-chem-phys.net/18/11149/2018/J. Friberg et al.: Volcanic impact on the climate 11163
Kasatochi and Sarychev did, explaining the slower transport
down to the LMS.
There were also a number of minor influences from extra-
tropical volcanic eruptions that are shown as small increases
in Figs. 7 and 8, e.g., the eruptions of Redoubt (March 2009),
Grimsvötn (May 2011), and Puyehue–Cordón Caulle (June
2011). Their clouds contained lower amounts of aerosol and
did not penetrate as deep into the stratosphere, as did the ex-
tratropical eruptions discussed above. Hence, the aerosol was
rapidly transported out of the stratosphere, similarly to the
lower cloud following the Kasatochi eruption.
7.1.4 The forest fires
The two forest fires affecting the stratosphere in this 10-year
period had a significantly lower impact on the stratospheric
AOD than the volcanic eruptions. The fire in February 2009
reached altitudes of more than 20 km (Figs. 4 and 7a). A con-
current small increase in the AOD is shown in the south-
ern tropical upper layer (Fig. 7a), which is mixed with the
volcanic aerosol from the Soufrière Hills eruption. This fire
therefore could have made a small but long-term impact on
the stratospheric AOD. The fire in December 2006 mainly
affected the southern LMS, as evidenced in Fig. 6c, with a
duration of a few months.
7.2 Patterns of volcanic aerosol in the stratosphere
Summarizing the findings of volcanic perturbations and
transport within the stratosphere, we make the following ob-
servations:
1. Aerosol from extratropical eruptions injected into the
LMS remains there until transported out to the tro-
posphere, e.g., the lower Kasatochi (2008) cloud. The
AOD is elevated for less than a year.
2. Volcanic injections close to the extratropical tropopause
Figure 9. The latitudinal distribution of the latitude-weighted AOD. only briefly impacts the stratospheric aerosol load, for
(a) The AOD of the different stratospheric layers and of the total example Grimsvötn (May 2011).
stratospheric AOD (thick red) for the entire period (2006–2015).
(b)–(d) The respective layers and (e) the AOD of the entire strato- 3. Aerosol from extratropical eruptions reaching the mid-
spheric column, for the time periods noted in the legend. Lines rep- layer gets dispersed hemispherically, and will be found
resent AODs in the altitude intervals 470 K to 35 km (black), 380– at higher altitude in the tropics than their extratropical
470 K (cyan), the LMS (magenta), and the entire stratosphere (thick injection altitude, but no clear case of interhemispheric
red). The year 2013 (grey filling) is considered as background con- exchange. Examples are the upper Kasatochi cloud, the
dition, and the line styles mark the different periods, as noted in the upper part of the Sarychev (2009) cloud and Calbuco
legend. (2015).
4. Volcanic clouds from tropical eruptions reaching above
the 470 K isentrope (approximately 20 km altitude) tend
The Calbuco eruption (April 2015) was by far the largest to move upwards without a strong poleward transport,
one in the Southern Hemisphere. The volcanic cloud reached e.g., Soufrière Hills (2006) and Kelut (2014). Hence, the
above the LMS and induced a rapid strong elevation of aerosol remains in the stratosphere for several years.
the AOD of the midlayer. The subsiding aerosol increased
the AOD of the LMS so that it peaked a few months later 5. Volcanic clouds injected close to the tropical tropopause
than in the midlayer. Calbuco reached higher altitudes than tend primarily to be transported poleward and within
www.atmos-chem-phys.net/18/11149/2018/ Atmos. Chem. Phys., 18, 11149–11169, 2018You can also read