VOLUME 1 Justin Hofman / Greenpeace
←
→
Page content transcription
If your browser does not render page correctly, please read the page content below
© Justin Hofman / Greenpeace

VOLUME 1
BRANDED
    IN SEARCH OF THE WORLD’S
TOP CORPORATE PLASTIC POLLUTERS

           VOLUME 1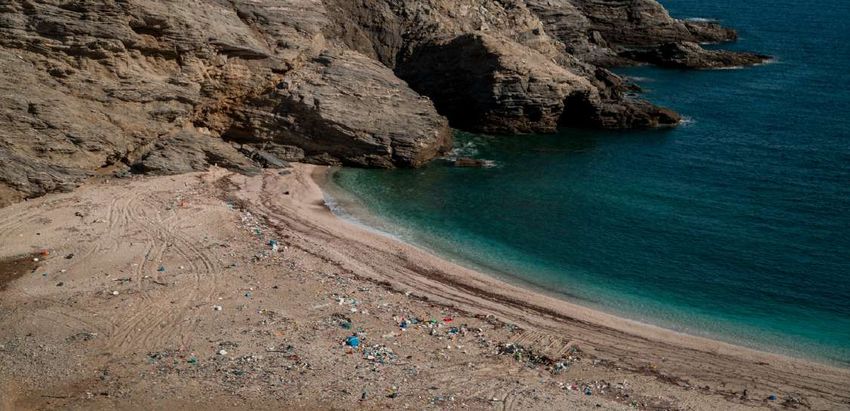
Executive Summary

                                                                  S OF PLASTIC
                                                                CE CLEANU P
                                                               E 39 VOLU PS
In 2018, individuals and organizations                           2 00     NT

                                                                                    O
                                                        ~10 I
                                                              1P
                                                                  0

                                                                                     LL
across the globe took local action to hold

                                                                                       EE
                                                      187,85

                                                                                       UTI
                                                            ,
corporations accountable for the plastic

                                                                                         RS
pollution they force into the marketplace

                                                                                          ON
                                                                   42 COUNTRIES
through unnecessary, problematic                                   6 CONTINENTS
and excessive throwaway packaging
and materials. Break Free From Plastic
member organizations engaged nearly
10,000 volunteers in 239 cleanups in 42
countries on 6 continents, collecting over
187,851 pieces of plastic pollution.

By adding “brand audits” to the cleanups, the teams catalogued thousands of parent companies
marketing many thousands more consumer brands found as plastic pollution collected in
the countries represented. Our analysis of that data reveals the Top Polluters worldwide from
participating brand audits: Coca-Cola, PepsiCo, Nestlé, Danone, Mondelez International, Procter
& Gamble, Unilever, Perfetti van Melle, Mars Incorporated, and Colgate-Palmolive. The top three
companies alone (Coca-Cola, PepsiCo, and Nestlé) accounted for 14% of the branded plastic
pollution found worldwide.

Coca-Cola was the most prolific polluter, found in 40 of 42 participating countries. More than 75%
of all 239 participating cleanups reported finding Coca-Cola branded products along their coasts,
shorelines, parks, and streets.

                                                4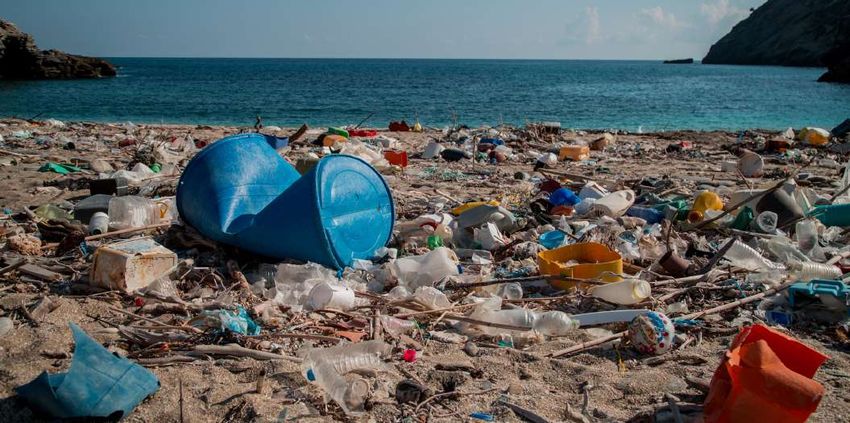
This report reinforces the need for corporations to accept responsibility for the full life-cycle
impacts of their products and the packaging in which their products are sold. Waste management
systems and environments worldwide are suffering under the weight of a planned 40% increase in
the production of plastics, and consumer goods companies have an opportunity and an obligation
to stop this crisis where it starts. Individuals and cities have he power to hold these brands
accountable by demanding food, drinks, and personal care products that are either unpackaged
or contained in reusable packaging. Responsibility for this plastic pollution problem lies not with
individual “litterbugs”, but with corporate polluters who must adopt sustainable solutions and
systems to stop the crisis.

Acknowledgments/Partners
This report and the data within it would not have been possible without the foundational work of
Mother Earth Foundation, Citizen consumer and civic Action Group (CAG), GAIA Asia Pacific and
Greenpeace, on whose pioneering work this project was built.

Break Free From Plastic member organizations participated in conducting, coordinating,
and recruiting cleanups for this event, including Greenpeace, Global Alliance for Incinerator
Alternatives (GAIA), Story of Stuff Project, Zero Zbel Morocco, Nipe Fagio, StudentPIRGs, 5 Gyres,
Inland Ocean Coalition, Trash Hero, Let’s Do It World, Surfrider, Wishtoyo Chumash Foundation,
Amics de la Terra Mallorca, Amigos de la Tierra Madre, Amow Foundation, Association Horizons,
Center for Environmental Justice and Development (CEJAD), Científicos de la Basura, City
University of Hong Kong, Ecology Center, ESDO, Fountain Valley School of Colorado, Gili Eco
Trust, Heal the Bay, Houston DSA EcoSocialists, Instituto Argonauta Para Conservação Costeira e
Marinha, Klub izolskih študentov in dijakov, Law Offices of Lori R. Mendez, Pacific Environment,
NESMAC, Planeteers of Southern Maine, Plastico Project, Proyecto Fronterizo de Educación
Ambiental, Ramble Island Plastic Pickup Sisters, Rockefeller University, Sahabat Laut, Sous Les
Dechets La Plage, and Zavod Bob.

The organizers of this effort would also like to thank the Plastic Solutions Fund for their generous
support in making possible this coordination project and report.

Cover Image: © Justin Hofman/Greenpeace

Published under responsibility of:
Greenpeace USA, 702 H Street, NW Suite 300 Washington, D.C. 20001
www.greenpeace.org/usa

                                                  5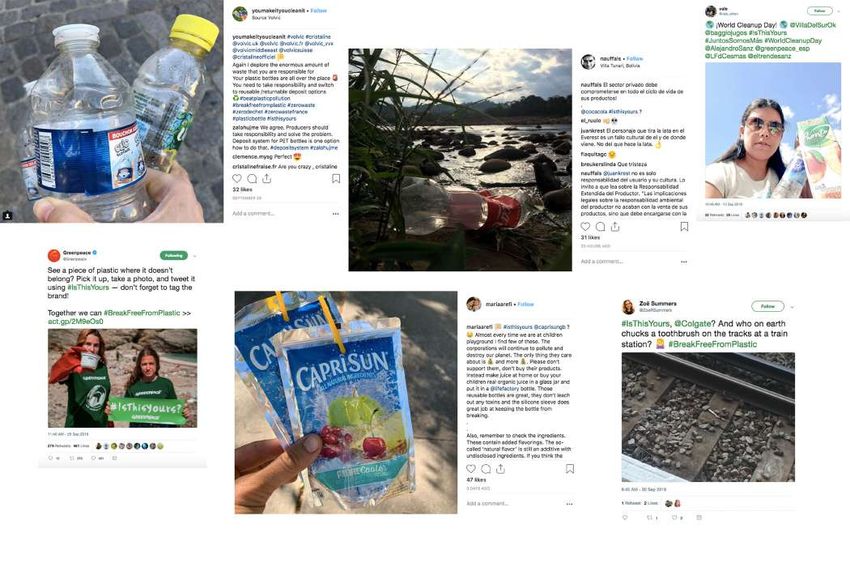
© Constantinos Stathias/Greenpeace

Table of Contents
      Executive Summary                    2
      Acknowledgments                      3
      Introduction                         5
      Methodology                          7
          Highlight: Pellets               9
      Locations                           11
             Spotlight on: Manila         11
      Top Waste Results                   12
             Spotlight on: Tanzania       13
      Top Brand Results                   13
             Spotlight on: Malibu         15
          Highlight: PET Bottles          15
      Results by Brand                    16
             Coca-Cola                    17
             Spotlight on: Greece         18
             PepsiCo                      19
             Nestle                       19
             Spotlight on: Morocco        20
             Danone                       20
          Highlight: #IsThisYours         21
      Conclusion                          22

                                      6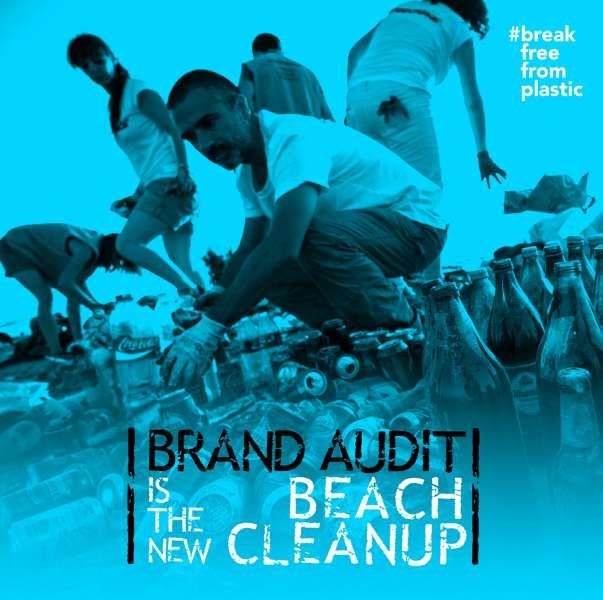
Introduction
Unnecessary, problematic, and excessive single-use packaging is one of the most offensive and
damaging applications of plastic. Despite calls for a “circular economy” approach to plastic
packaging, thousands of brands and corporations insist on wrapping their food, household, and
personal care products in this polluting and toxic material.

Plastic is rarely designed from the start to be reused or recycled back into the original product. As
growing global plastic production has topped 320 million metric tons per year1, many millions of
tons of plastic pollution enter and clog our rivers, oceans, and landfills each year, defiling nature
and overwhelming local waste management systems. An estimated 8.3 billion metric tons of
plastic has been produced in total since the 1950s, and recent research shows that only 9% has
been actually recycled, 12% has been incinerated, and the remaining roughly 80% has largely
ended up in landfills, in the oceans, or loose in the environment.2

Our society is inundated with industry-sponsored messages about “litter” and “cleanups” that leave
individual consumers believing and feeling guilty that they are the cause of the plastic pollution
crisis. Many of the solutions put forward by these brands and corporations focus on collection and
recycling, despite years of persistently low and falling plastic recycling rates worldwide.

Moreover, individual consumers are
burdened with inequitable and impossible                           Brand Audit:
choices, and plastic is unavoidable                                Identifying, counting, and
in modern life. As this conception of                              documenting the brands
“modernity” and “progress,” embodied                               found on plastic and other
by a throwaway lifestyle, extends from                             collected packaging waste to
the Global North to the Global South, so                           help identify the corporations
do conventional disposal-oriented waste                            responsible for pollution.
management systems which are aggressively
being pushed and promoted in developing
countries. Consumers are made to feel guilty
for their own choices and constraints, while corporations are rarely, if ever, meaningfully held
responsible for the full costs of the harmful impact of their packaging.

We cannot recycle our way out of this plastic pollution crisis. We must recognize the responsibility
of corporations and plastic producers to innovate and implement whole-system redesign to make
the use of plastic packaging unnecessary. Break Free From Plastic member organizations are
working together to realize solutions for systemic change.

                                                  7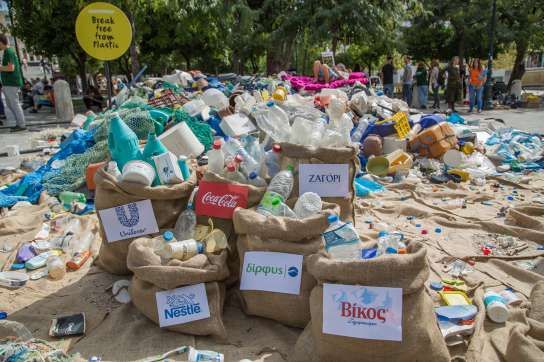
Break Free From Plastic is a global movement of nearly 1,300 member groups and thousands of
individuals united around a common goal: to bring systemic change through a holistic approach
that tackles plastic pollution across the entire plastics value chain, focusing on prevention rather
than cure and on providing effective solutions.

In 2017, core members of Break Free From Plastic in the Philippines conducted its first globally
coordinated and publicized brand audit to identify the consumer brands that pollute our lands and
water with their unnecessary plastic packaging. They developed a shared methodology to clean a
large stretch of beach on Freedom Island along Manila Bay, working with volunteers for eight days
to collect a total of 54,260 pieces of plastic waste. Among the top polluters identified in this audit
were Nestlé, Unilever, Indonesian company PT Torabika Mayora, and some Filipino companies.3

“We are calling on companies to use materials in their products and packaging that can be truly
recovered, reused and recycled, and to invest in alternative delivery systems that will deliver
their products to the public without the need for low-value, disposable packaging,” said Froilan
Grate, Regional Coordinator, GAIA Asia Pacific. “Companies conveniently blame the public,
their consumers, for plastic pollution, when their products are almost impossible to manage.
Companies are only too happy to pass on to cities and the public the responsibility of addressing
the waste that their products create.”

Following the Freedom Island brand audit, similar audits took place in other parts of the world.
As part of GAIA’s work on Zero Waste Cities, brand audits were conducted in Indonesia and the
Philippines in late 2017 and early 2018. In May 2018, ten GAIA member and partner organizations
in India conducted cleanups and brand audits in fifteen cities across the country.4 The audit
involved over 15,000 volunteers who collected 72,721 pieces of branded plastic pollution from
the environment. The top three polluters among international brands identified in that audit were
PepsiCo, Perfetti van Melle, and Unilever — all brands that also showed up in the top 10 from the
data included in this report.5

 © Nikita Tibrewal                                    © Reema Banerjee
 Centre for Environment Education (CEE) East          Centre for Environment Education (CEE) East

                                                  8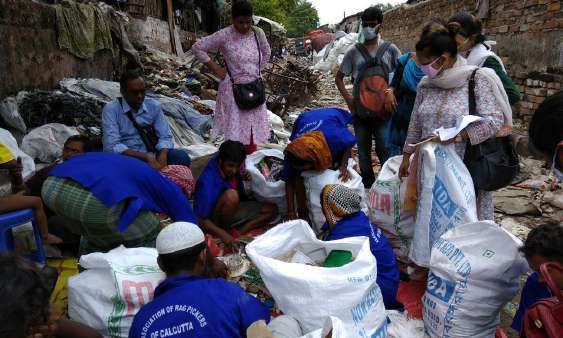
Methodology
In 2018, Break Free From Plastic members
around the world mobilized to adapt and
deploy an updated methodology.

Organizations and volunteers were
recruited to lead local cleanups and
were directly trained on using Break
Free From Plastic’s Brand Audit Toolkit
and forms, available publicly online. By
following the steps outlined in the toolkit,
participants were trained to: define their
cleanup area; collect all waste found in
that area; and count and record the brand,
parent manufacturer, product type (food,
personal care, or household product), and
packaging type (HDPE, PET, PVC, PP, PS, multi-layer plastics, single-layer plastics, and other) of
each piece of waste collected. A visual guide was provided as part of the toolkit to help volunteers
identify the classification of Product Type and Packaging Type. Self-reported data on item brand
and parent manufacturer were reviewed, cleaned, and confirmed before publication of this report.

 Cleanups by Country
 Australia                            5     Hungary            1    Philippines                  1
 Austria                              2     India              2    Portugal                    2
 Bangladesh                           1     Indonesia          5    Russian Federation          3
 Brazil                               1     Ireland            1    Senegal                     1
 Cameroon                             1     Italy             11    Slovenia                   12
 Canada                               9     Jamaica            1    South Africa                3
 Chile                                1     Kenya              2    South Korea                 2
 Croatia                              3     Latvia             1    Spain                       6
 Cyprus                               1     Lebanon            3    Switzerland                 1
 Czech Republic                       2     Malaysia           1    Tanzania                   22
 Democratic Republic of Congo         1     Maldives           1    Thailand                    1
 Ecuador                              1     Mexico            16    United Kingdom              5
 Greece                               1     Morocco           29    United States              70
 Hong Kong                            4     Nigeria            1    Vietnam                     2
                                                                                     Total    239

                                                 9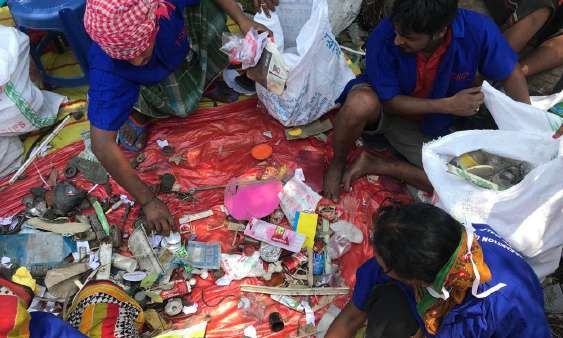
In areas where a huge amount of waste and plastic pollution was collected and a brand audit
on every piece was impossible, volunteers were asked to perform the audit on a set portion
of what they collected. The only data included in this report are the individual pieces of waste
directly accounted for in the brand audits. No extrapolation or statistical methods were used in
aggregating these data.

The cleanups for this year were conducted on a strictly voluntary basis. While small amounts
of funding (maximum $500) were provided to a handful of organizations who applied to cover
the costs of materials6, the recruitment process for countries and volunteers was open and not
targeted. Thus, because of the nature of our direct and social networks, the cleanups are not
necessarily evenly distributed across strategic areas, but are rather a reflection of the spontaneous
and enthusiastic support coming from various groups and volunteers for the goals of this project.

Limitations
This document is a report on the waste and plastic pollution collected and self-reported by
volunteers working in diverse locations and environments around the world. There are many
more consumer brands producing and packaging in plastic than are represented in this report,
and some of those brands might indeed be putting more plastic into the environment than the
companies and brands reported here. This report gives an indication of the most common brands
found in cleanups around the world. It is not meant to be a definitive quantification of all the plastic
pollution that can be attributed to specific companies, nor is the report a representative sample of
all of the waste produced by plastics manufacturers or corporate brands around the world.

 © Zero Zbel Morocco

                                                   10
What this report provides is insight into the impact that the corporate practice of overpackaging
is having on the environment and communities worldwide, based on the plastic pollution that
participating groups and individuals found in their different areas and localities. This report serves
as a call to action to consumers and consumer brands alike: Our planet and our lives are overrun
with plastic pollution. We are in crisis from an onslaught of problematic packaging and useless
applications of plastic that are currently projected to continue growing exponentially.
We still have time to solve this issue. Corporations have an urgent and immediate obligation to
stop overpackaging, to redesign product delivery systems in ways that minimize or eliminate
waste, and to take responsibility for the plastic pollution they are pumping into the environment.
Over the next 10 years, plastic production is slated to increase by 40%.7 The petrochemical
build out required to produce this much plastic will harm fenceline communities for decades
and generations to come, and will have increasingly deleterious effects on the world’s oceans.
We must act now to demand that corporate brands reject their overpackaging habit in order to
meaningfully reverse the demand for new plastic.
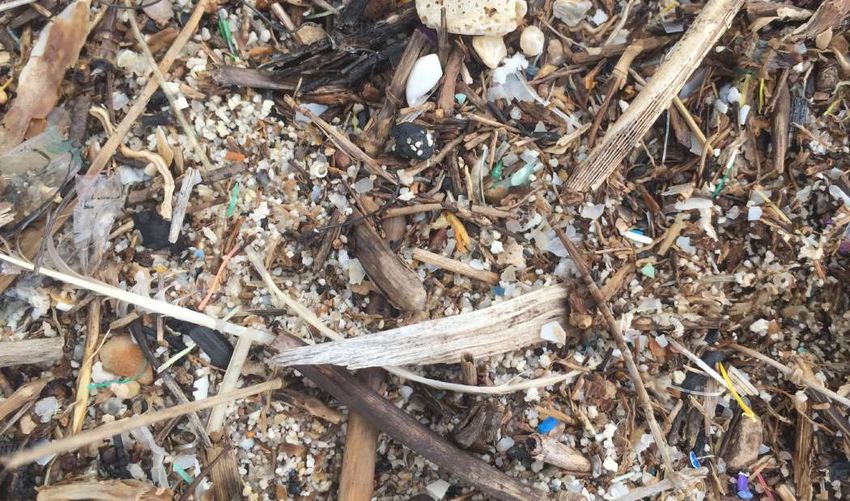
Highlight: Pellets
Plastic becomes pollution long before it is processed into consumer packaging and discarded.
Originally made out of the byproduct (i.e. waste) of the oil refinement process — and now
increasingly using fracked “wet gas” or ethane — plastic production contributes to global warming
and damages local environments, public health, and livelihoods. Communities near fracking wells
and plastic production facilities have been fighting for decades the pollution wrought upon them by
these oil, gas, and petrochemical corporations.
Plastic resin is produced and transported in the form of pellets, commonly called nurdles. They
are the raw material building block form of plastics, optimized for easy selling and transport. At
plastic production sites across the globe, local communities have been struggling against an
encroaching tide of plastic nurdles and powder from these production facilities. While the nurdles
found on beaches don’t have recognizable brand logos printed on them, they are linked to specific
producers, who are also suppliers of the consumer brands named in this report.
The Lavaca Bay and adjacent creeks in southeast Texas are routinely polluted with plastic pellets
and plastic powder. The source of this pollution is difficult to establish, but it is thought to be linked
to the nearby Formosa Plastics Corporation. One scientist described the presence of plastic pellets
11and powder in the local area in these terms: “In some spots they covered the ground, looking
like a dusting of sleet or hail”. On a beach in Scotland, only miles from the Grangemouth plastic
production facility owned by the UK’s biggest wannabe-fracker INEOS, volunteers found 450,000
nurdles in just under two hours of cleaning.8 Indeed: contamination by spilled plastic pellets is so
pervasive that several research-focused NGOs, like International Pellet Watch, have popped up to
document the phenomenon and its negative impacts — all of which are borne by communities rather
than the corporations that produce these pellets.
© Diane Wilson / San Antonio Bay Estuarine Waterkeeper
Many plastics producers point to their participation in “Operation Clean Sweep”, a voluntary pledge
program sponsored by the American Chemistry Council and other plastics industry groups. This
program was implemented 25 years ago to recruit manufacturers to make a pledge to prevent loss
of plastic pellets, flake, and powder in production or transportation. Yet there has never been an
impact report to measure its success. Its publications and reports indicate that no baseline for loss
is ever measured, and no amount of reduction or “number of pellets prevented from loss” has ever
been released. We have no way of knowing if this program has made any impact on the amount of
plastics spilled uncontrolled into the environment. In the absence of disclosure on what Operation
Clean Sweep actually does and what it asks of corporations, it’s strictly industry greenwashing.
Common sense steps must be taken by plastic producers and governments to regulate and enforce
pellet loss prevention,9 all of which will be amplified by a measurable and urgent reduction in the
amount of virgin plastic produced and used across the world.
12Locations
By recruiting through our direct networks and social media channels, Break Free From Plastic
engaged nearly 10,000 volunteers in 42 countries on 6 continents to conduct a total of 239
cleanups. These volunteers collected more than 180,000 pieces of plastic waste, over 65% of
which was marked with a clear consumer brand.
This recruitment effort built on two specific events, championed and pioneered by other
organizations: World Environment Day (5 June) and World Cleanup Day (15 September).
17,316
33,309
28,418
99,289
4,859
4,660
Spotlight on Manila
One year after the initial pilot program to conduct brand audits, a group of volunteers returned
to collect and audit plastic pollution found in Manila Bay, Philippines. While the first 2017 audit
identified Nestlé, Unilever, and Indonesian company PT Torabika Mayora as the Top Polluters, the
more recent audit tells a different story. In 2018, products from Unilever and Nestlé were found in
the audit (with 128 and 82 pieces, respectively), but the Top Polluters in Manila Bay in 2018 were
Filipino company JBC Food Corporation, Mondelez International, and Filipino snack brand Oishi.
Coca-Cola products were also prominent in this audit, coming in at number 7 on the Top Polluters
list for the 2018 Manila Bay cleanup.
13“The overwhelming number of volunteers
at the Manila Bay cleanup and brand
audit is a testament to our people’s
commitment to do better and their resolve
to take action against plastic pollution,”
said Abigail Aguilar, campaigner for
Greenpeace Philippines. “Companies
© Richard Atrero de Guzman / Greenpeace
must reciprocate and step up in this fight.
They are the missing piece in this global action against plastic pollution, and they can do better by
reducing their production of single-use plastics.”
Top Waste Results
Recycling is not a feasible solution to the plastic pollution crisis. Over 100,000 pieces of the plastic
pollution audited in this data collection effort were plastics that are very difficult or impossible to
recycle in most places around the world: polystyrene (PS), polyvinyl
chloride (PVC), single-layer plastic film (SL), and multilayer plastic Type of Packaging
bonded materials (ML). The largest category of collected materials Other 68,578
(Other) mostly includes materials that are not at all recyclable: PS 46,764
cigarette butts, textiles, diapers, sanitary napkins, and other items. PET 45,914
SL 36,857
Multilayer materials—a mixture of plastic and other materials ML 23,268
bonded together in layers—are especially pernicious. These HDPE 16,601
packaging types are common in the form of snack and potato chip PP 13,463
bags, shelf-stable packaging (like Tetrapak), and juice pouches. In PVC 4,984
many emerging markets around the world, one-time-use sachets Total Plastic 187,851
and packets often used for personal care and food products have Total All 256,429
overwhelmed waste collection and management systems with
non-recyclable packaging. Global brands PepsiCo, Unilever, Mondelez International, and Nestlé
topped the list of branded multilayer plastic pollution products.
14Spotlight on Tanzania
Nipe Fagio (“give me the broom” in Swahili)
is a Tanzania-based nonprofit organization
that is part of Break Free From Plastic, GAIA,
and Let’s Do It World. On World Cleanup Day
2018, the group conducted 102 cleanups,
engaged 26,419 people, and collected
18,547 bags — 466,378 kg — of trash in the
country. For this brand audit report, 22 sites © Nipe Fagio
in Dar es Salaam were cleaned, engaging
7,249 volunteers and collecting 7,233 bags of trash. Nearly half of the global volunteers engaged in
the cleanups included in this report were Nipe Fagio participants cleaning and counting in Tanzania.
Much of the waste collected was from Tanzania-based manufacturers (MeTL, Azam Bakhresa Group,
Watercom), and a few recognizable global brands were found: Coca-Cola, Colgate-Palmolive,
Unilever, and others.
“Tanzania is not known for voluntary or civic society engagement,” said Nipe Fagio Executive
Director Ana Rocha. “We don’t have a volunteering culture, and most people expect the
government to lead any kind of mobilization. World Cleanup Day was a day in which, with
endorsement from the government, the movement was led by regular people. It enabled behavior
change. Moving around and seeing people proud of themselves and taking ownership of their
environment, performing waste and brand audits to advocate for company responsibility, was a life-
changing experience.”
Top Brand Results
Large corporations make billions of dollars of annual profits off the plastic and products contained
within it10, while leaving communities to pay for and manage the negative impacts resulting from
its production and use. As plastic is being made, frontline communities are exposed to toxic doses
of harmful chemicals in the local air, water, and soil. As the food and products contained in plastic
are consumed, people are accumulating phthalates and endocrine-disrupting chemicals in their
bloodstreams through exposure. And finally, tax-paying citizens end up shouldering the burden and
massive costs associated with the management and disposal of plastic once it is used and discarded.
Corporations have intentionally separated and distanced themselves from the responsibility or
costs of the full life-cycle impacts of their products or plastic packaging. As consumer brands
15have become increasingly consolidated under ever-larger multinational corporate umbrellas,
identifying the decision-makers responsible for overpackaging our food and personal care
products has become even easier.
Teams across the participating cleanups catalogued thousands of parent companies marketing
many thousands more consumer brands found on plastic pollution collected in the countries
represented. Our analysis reveals the Top Polluters worldwide: Coca-Cola, PepsiCo, Nestlé,
Danone, Mondelez International, Procter & Gamble, Unilever, Perfetti van Melle, Mars
Incorporated, and Colgate-Palmolive round out the top ten corporate brands found on plastic
pollution collected on six continents.
This Top Polluters list took into account the sampling limitations of our data set. Therefore, only
corporations from which we found more than 100 pieces of plastic pollution worldwide in at least
ten countries were included in this Top Polluters ranking. Our volunteers in the United States,
Tanzania, and Morocco reported a disproportionately large number of cleanups compared to both
their population size and the rest of the dataset. Therefore, the raw data revealed a number of
strictly regional or national brands and corporations that are not necessarily worldwide polluters.
The branded plastic pollution included in this database is largely taken from outdoor coastal,
shoreline, and urban cleanups. Therefore, it is not a full picture of the plastic pollution harming our
communities and quickly overwhelming our landfills. Many more brands, found in relatively small
amounts in this limited auditing effort, are producing and packaging in many more millions of tons
of plastic pollution than are measured and accounted for here.
16Spotlight on Malibu
The Wishtoyo Chumash Foundation has been leading
cleanups and waste counts through the International
Coastal Cleanup Day program for years. In 2018, the
group hosted two cleanups in the Malibu area, one on
the coast and the other on the beach outside of the
Wishtoyo Chumash Village, during which they adopted
the BFFP brand audit methodology to ensure their
cleanups have a wider impact. With a total of nearly
100 volunteers, the group identified the top brands
of plastic pollution found on these beaches that are
normally considered pristine: Mars Incorporated,
© Wishtoyo Chumash Foundation
Starbucks, and General Mills.
“If corporations got on board with the impact they’re having on common every day beaches, they
can actually make a big difference,” said Volunteer Coordinator Kote Melendez. “The brand audit is
holding big corporations accountable, not just everyday citizens when it comes to plastic pollution.”
Highlight: PET bottles PET Recycling Rates11
The international story told around polyethylene terephthalate (PET,
United States 29%
sometimes PETE) is that it is very recyclable and has a high value on
Europe 48%
the market for post-consumer recycled material. Yet as we see in the
Japan 72%
dramatically varying PET recycling rates by country and by region,
India 80%
“recyclable” does not necessarily mean “recycled”.
As of 2016, an independent analysis found that we are producing more than 1 million PET bottles
per minute worldwide.11 1 million PET bottles per minute amounts to 525,600,000,000 produced
annually, based on estimates that are now 2 years old for a market whose sales numbers have been
growing each year.
Our analysis bears out the crisis surrounding PET bottle production and the lack of adequate
recycling: PET was the second most common plastic type found in the participating cleanups, at
17nearly 46,000 pieces catalogued. Indeed, the top 3 brands on our Top Polluters list are all significant
brands in the PET bottled beverage market (Coca-Cola, PepsiCo, Nestlé), and all 4 of the Top
Polluters in this analysis have massive global bottled water brands.
IMAGES OF BOTTLES
PepsiCo and Nestlé Waters NA both previously made commitments to their investors12 to increase
the recycling rates of their PET bottles in U.S. markets, where less than one-third of PET plastic
bottles are recycled. In 2008, Nestlé Waters pledged to work with peers to achieve an industry PET
recycling goal of 60% by 2018. Two years later Pepsi made a separate but related goal to elevate
the U.S. beverage container recycling rate to 50% for PET plastic and glass bottles and aluminum
cans, also by 2018. As the timeline is set to expire on these promises, neither has come remotely
close to meeting their goals, and they have publicly lobbied against policies proven to increase
recycling rates, like bottle deposit laws. Indeed, PepsiCo recently announced a $10 million pledge
toward new recycling technologies and infrastructure, representing a wholly inadequate attempt
to compensate for its major failure to move recycling rates.13 $10 million is about 1% of what is
estimated to be needed to fix the U.S.’s inefficient recycling system.
It is clear from the unmet corporate pledges and inadequate investments, the low (and falling)
recycling rates of PET worldwide, and the prevalence of PET in our brand audit that recycling will
not solve the crisis we are facing around waste and harm from single-use plastic water bottles.
Corporations must instead redesign their delivery systems to sell their actual products (water or
beverages) without the need for single-use packaging.
Results - By Brand
Plastic pollution marked with brands from Coca-Cola, PepsiCo, Nestlé, and Danone were the
Top Polluters in the sampled cleanups, and each brand was found in at least 24 participating
countries. In the maps that follow, you can clearly identify which of these companies’ brands were
catalogued in the participating cleanups and how many pieces of plastic pollution were found
from each brand per country.
18Coca-Cola ranked first on this year’s Top Polluters list, with plastic pollution marked with one of
its many brands found in 40 out of 42 countries in our sample. The cover image on this report,
featuring a diver holding a plastic bottle with the signature Coca-Cola red plastic cap and distinct
markings on the bottle, was taken on October 2, 2018, during a voyage to the Great Pacific
Garbage Patch by the Greenpeace ship Arctic Sunrise. Even in the middle of the Pacific Ocean,
thousands of miles from any inhabited land, Coca-Cola branded plastic pollution was found.
Break Free From Plastic member groups have high expectations for Coca-Cola and the other
brands on this list, because how these companies choose to respond to this crisis has a lot of
potential to benefit communities around the globe. We urge these corporations to move quickly
on redesigning how they bottle and deliver beverages, to eliminate unnecessary bottles and the
toxic impacts of plastic pollution worldwide.
Coca-Cola
1,388
3,668
1,030
2,723
189
218
19Spotlight on Greece
© Constantinos Stathias / Greenpeace
Greenpeace Greece staged a particularly remarkable demonstration: The group extensively cleaned
a beach in Southern Evoia, far away from settlements and not host to any visible human activities.
100 volunteers collected over 20,000 liters of waste, more than 95% of which was plastic and all
of which could have had only one source: the open sea. The plastic pollution found was sorted on
site, separating the clearly branded items from the non-branded waste. The branded plastic waste
was then transported to Athens, where an in-depth brand audit was staged at the central square
of Greece’s capital city. This allowed for a big spectacle of brands being exposed in the public,
raising questions from bystanders on the very plastic packaging they may have been holding at the
moment. In the end, they identified 2,981 pieces of branded plastic pollution, with Coca-Cola, Vikos
(a Greek company that bottles water), and Nestlé at the top of the list.
“While cleaning this magnificent place,
sadly it became evident that the pollution
was irreversible,” said Alkis Kafetzis, Oceans
Campaigner at Greenpeace Greece. “A
devastating amount of plastic had already
turned into tiny bits, covering entire parts of
the sand and being entangled between the
roots of bushes. Plastic is quickly becoming
part of the ecosystem and we have to
© Constantinos Stathias / Greenpeace
address the problem at its roots.”
20Pepsi
3,269 889
904
412
197
79
Nestlé
1,924 427
441
35
118
7
21Spotlight on Morocco
From March to August of 2018, Zero
Zbel (Zero Waste) in Morocco enlisted
40 volunteers to conduct waste and
brand audits on 26 beaches along the
Atlantic and Mediterranean coastlines
of the country. During those five
months, 36,280 total pieces of waste
were collected. Zero Zbel released the
© Zero Zbel Morocco
reports on World Cleanup Day 2018,
demonstrating that 85% of the waste was plastic pollution and that almost 20% was just plastic
bottles and caps. Coca-Cola, Danone, and Mondelez International topped the branded plastic
pollution found on Moroccan beaches, while regional brands like Les Eaux Minérales d’Oulmès
and others were also prominent on the list. The story of this brand audit was carried by the largest
Moroccan newspapers, news websites, and radio stations, marking massive exposure for these
consumer brands and their plastic pollution problem.
Danone
395 195
672 580
1
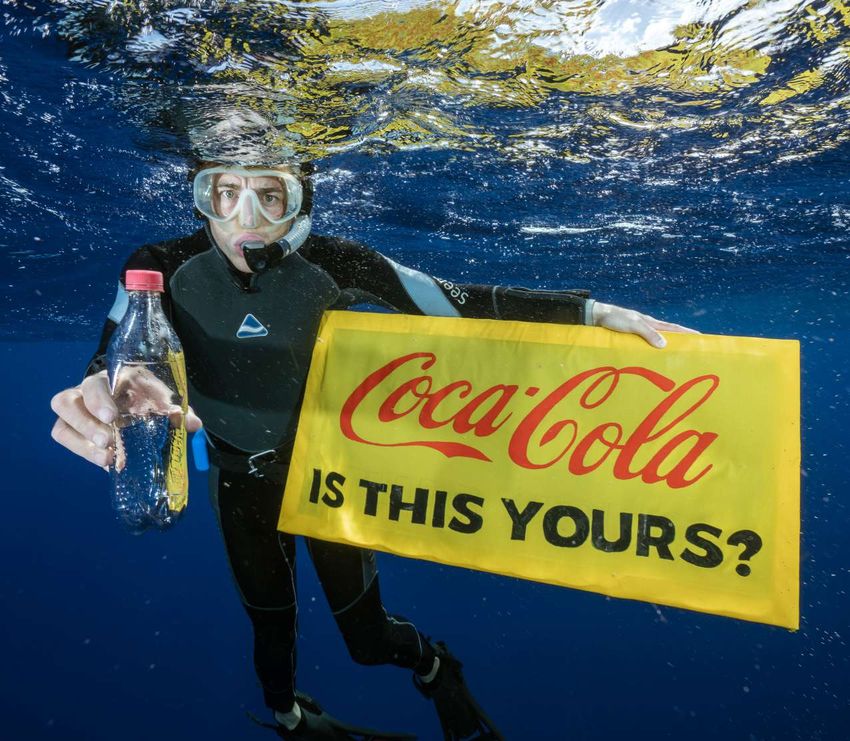
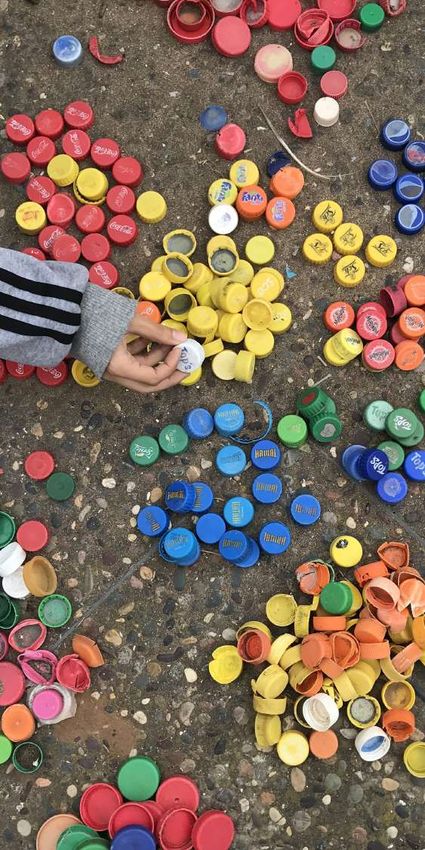
22Highlight: Social Media Campaign #IsThisYours
For years, the messaging around plastic pollution and litter has been focused on community
cleanups and individual responsibility for managing waste. Yet in this latest effort to add brand
audits to cleanups, we are seeing a shift in the way consumers are thinking about waste. People are
beginning to see the connection between plastic pollution on the ground and the corporations that
overpackage food and healthcare products.
Never has this been clearer than in a recent social media conversation to expose the truth of “litter”
as a corporate packaging problem. In more than 13,000 (and counting!) tweets, shares, and snaps,
#IsThisYours? has been targeting the visible brands and parent manufacturers found on plastic
pollution in the environment, and the movement is just getting started. The hashtag is being used as
a rallying cry by individuals and participating cleanups around the globe to declare and share that
we know who is responsible for plastic pollution: Corporations, not consumers.
#IsThisYours?
23Conclusion
From extraction of oil and natural gas to petrochemical production, onto store shelves and into
the hands of consumers, through to waste management and ultimate disposal, plastic has toxic,
expensive, devastating impacts on humans, animals, and the environment. Scientific research is
continuing to prove what communities and industry have known for decades: plastic is pollution
the minute it is made. Individual communities and future generations are not responsible for the
design, production, and transport of plastic packaging, yet they must constantly shoulder the
burden and the costs of plastic’s harmful legacy and impacts.
Corporations are responsible for the overpackaging practices that perpetuate new plastic
production, which in turn translates into pollution that overwhelms communities and our planet.
The addition of waste and brand audit mechanisms and methodologies to the decades-old
practice of cleanups along beaches, shorelines, paths, parks, and streets will continue to increase
the efficacy of our cleanup efforts, placing responsibility where it truly lies: with the corporations
and plastics producers.
Consumer goods corporations should be doing everything possible to prevent the need for
unnecessary and problematic throwaway plastic packaging. In the limited cases where that
packaging might ultimately prove unavoidable, non-toxic systems for production, recycling, and
reuse should be implemented by the corporations requiring the use of this material.
Individuals and cities should continue to hold corporations accountable for their plastic pollution
crisis by identifying the brands found in their local cleanups and making that information visible.
The Break Free From Plastic website will continue to host how-to guides and data-reporting
mechanisms for brand audits, and a real-time analysis will be displayed on
plasticpolluters.breakfreefromplastic.org. We encourage every cleanup worldwide to complete
a brand audit on all waste collected and to contribute that data to this effort. Individuals and
communities should also continue to use social media and digital advocacy to ensure corporations
know where across the world their plastic pollution is being found, and that consumers know who
is responsible.
Only by joining forces and data can we hold corporations to a high standard of accountability
for their trash. These multinational corporations are the true litterbugs, and it’s about time we
collectively asked them, #IsThisYours?
24Branded Plastic Pollution by Country and Corporation
Brand AUS AUT BGD BRA CAN CHL HRV CYP CZE
Coca Cola 218 150 300 26 178 72 50 1 40
Pepsi Co 79 8 245 6 208 81 7 22 8
Nestlé 7 8 5 383 14 2 2 2
Danone 7 1 9 1 1
Mondelez International 58 8 7 81 4 4 2
7-Eleven 1,455 2
Procter & Gamble 13 6 4
Unilever 2 13 55 1 7 1 6 3 14
Perfetti van Melle 106 1 670 3 22
Mars Incorporated 24 26 47 5 4 5
Colgate-Palmolive 4
McDonalds 158 38 95 1
Bimbo
Universal Robina
Indofood
Hershey Company 1 1 108
Costco 3 51
Starbucks 13 2 108
Restaurant Brands Intl. 10 249
Ferrero 43 1 3 4 1 5
Philip Morris 8 72 2 5 20
Kraft Heinz 9 1 1 13 1
Generall Mills 62
Mayora Indah
Keurig Dr Pepper 45 1
Heineken International 1 2 11 1
Solo Cup Co. 2 13
Walmart
Kellogg Company 7 6 1
Lidl 9 6 21
San Benedetto 1 1
Agrokor 1 79
Haribo 10 1 24
Rauch 92 3
Tudung Group
Total 2,140 441 1,342 49 1,686 168 182 67 146
25Branded Plastic Pollution by Country and Corporation
Brand ECU GRC HKG HUN IND IDN IRL ITA JAM
Coca Cola 91 306 103 96 59 98 1 183 8
Pepsi Co 110 30 25 41 40 48 1 19 24
Nestlé 99 225 1 12 19 1 53 1
Danone 87 5 563 13
Mondelez International 35 29 22 8 2 26 5
7-Eleven 4
Procter & Gamble 9 2 35 105 9
Unilever 4 84 1 6 335 31 1
Perfetti van Melle 1 168 14 28
Mars Incorporated 6 78 3 5 1
Colgate-Palmolive 25 1 8
McDonalds 2 2 3
Bimbo
Universal Robina 2 5
Indofood 384
Hershey Company
Costco
Starbucks 1
Restaurant Brands Intl.
Ferrero 2 7 77
Philip Morris 1 1 3 1
Kraft Heinz 53 52 1 1
Generall Mills
Mayora Indah 10 94
Keurig Dr Pepper 1 1
Heineken International 33
Solo Cup Co.
Walmart
Kellogg Company 1 1
Lidl 4 4 12
San Benedetto 1 112
Agrokor
Haribo 1 29
Rauch 7 1
Tudung Group 106
Total 339 848 147 137 494 1,846 14 604 40
26Branded Plastic Pollution by Country and Corporation
Brand KEN LVA LBN MYS MDV MEX MAR NGA PHL
Coca Cola 258 5 8 28 100 3,069 1,507 25 258
Pepsi Co 2 132 596 2,063 223 20 55
Nestlé 48 9 483 35 82
Danone 2 2 373 507 2
Mondelez International 14 9 353 775
7-Eleven
Procter & Gamble 2 266 469 25 97
Unilever 56 7 95 199 128
Perfetti van Melle
Mars Incorporated 6 7
Colgate-Palmolive 21 43
McDonalds 14
Bimbo 461
Universal Robina 461
Indofood 4 50
Hershey Company 30 3
Costco 16
Starbucks 6
Restaurant Brands Intl.
Ferrero 2 1
Philip Morris 3 17 1
Kraft Heinz 1 2
Generall Mills 2
Mayora Indah 72
Keurig Dr Pepper 10 70
Heineken International 3
Solo Cup Co.
Walmart
Kellogg Company 1 4 5
Lidl 1
San Benedetto
Agrokor
Haribo 2
Rauch
Tudung Group
Total 346 21 202 39 696 6,911 3,353 120 2,048
27Branded Plastic Pollution by Country and Corporation
Brand PRT RUS SEN SVN ZAF KOR ESP CHE TZA
Coca Cola 5 71 32 155 156 17 159 44 745
Pepsi Co 7 53 10 4 1 67 165
Nestlé 9 9 15 1 8 71
Danone 17 11 155 3 10 8 35 15
Mondelez International 7 11 25 1 6
7-Eleven 1
Procter & Gamble 2 6 216
Unilever 81 11 3 1 2 6
Perfetti van Melle 1 1 1 1 5
Mars Incorporated 1 41 24 12 9
Colgate-Palmolive 3 504
McDonalds 8 140 6 2
Bimbo 6
Universal Robina
Indofood
Hershey Company 1
Costco
Starbucks 2
Restaurant Brands Intl. 2
Ferrero 50 2 8 29
Philip Morris 8 23 5
Kraft Heinz 6 3
Generall Mills
Mayora Indah
Keurig Dr Pepper 3
Heineken International 4 42 66
Solo Cup Co.
Walmart
Kellogg Company 1 2
Lidl 8 60
San Benedetto 7
Agrokor 30
Haribo 1 3 2
Rauch 4
Tudung Group
Total 154 255 187 549 206 42 311 174 1,696
28Guide to country codes
Branded Plastic Pollution by Country and Corporation and names:
Brand THA GBR USA VNM TOTAL AUS Australia
AUT Austria
Coca Cola 59 22 413 100 9,216 BGD Bangladesh
Pepsi Co 260 18 974 98 5,750 BRA Brazil
CAN Canada
Nestlé 126 20 1,057 143 2,950 CHL Chile
Danone 3 13 1,843 HRV Croatia
CYP Cyprus
Mondelez International 82 90 1,664 CZE Czech Republic
7-Eleven 65 1,527 ECU Ecuador
GRC Greece
Procter & Gamble 6 16 6 1,324 HKG Hong Kong
Unilever 6 35 36 1,230 HUN Hungary
IND India
Perfetti van Melle 2 58 3 1,085 IDN Indonesia
Mars Incorporated 51 316 5 676 IRL Ireland
ITA Italy
Colgate-Palmolive 4 2 615 JAM Jamaica
McDonalds 2 136 607 KEN Kenya
LVA Latvia
Bimbo 6 473 LBN Lebanon
Universal Robina 1 469 MYS Malaysia
MDV Maldives
Indofood 438 MEX Mexico
Hershey Company 1 220 365 MAR Morocco
NGA Nigeria
Costco 236 306 PHL Philippines
Starbucks 134 5 271 PRT Portugal
RUS Russian Federation
Restaurant Brands Intl. 6 267 SEN Senegal
Ferrero 29 264 SVN Slovenia
ZAF South Africa
Philip Morris 1 64 235 KOR South Korea
Kraft Heinz 6 74 224 ESP Spain
CHE Switzerland
Generall Mills 3 123 190 TZA Tanzania
Mayora Indah 1 177 THA Thailand
GBR United Kingdom
Keurig Dr Pepper 35 166 USA United States
Heineken International 1 164 VNM Vietnam
Solo Cup Co. 140 155
Walmart 143 143
Kellogg Company 4 105 1 139
Lidl 1 126
San Benedetto 122
Agrokor 110
Haribo 28 8 109
Rauch 107
Tudung Group 106
Total 445 256 4,501 401 33,613
29Branded Plastic Pollution by Type and Corporation
Brand PET HDPE ML PP PS PVC SL TOTAL
Coca Cola 6,588 1,456 183 900 6 83 9,216
Pepsi Co 3,128 159 872 407 196 988 5,750
Nestlé 959 191 412 1,136 80 172 2,950
Danone 386 138 60 453 773 33 1,843
Mondelez International 6 12 524 19 52 1,051 1,664
7-Eleven 48 612 533 27 307 1,527
Procter & Gamble 8 457 287 265 115 1 191 1,324
Unilever 65 272 640 48 5 1 199 1,230
Perfetti van Melle 4 17 63 98 903 1,085
Mars Incorporated 1 9 304 4 358 676
Colgate-Palmolive 2 557 50 2 1 3 615
McDonalds 11 21 141 201 193 1 39 607
Bimbo 25 83 365 473
Universal Robina 25 313 1 130 469
Indofood 23 188 3 25 199 438
Hershey Company 31 184 4 1 145 365
Costco 257 5 15 9 4 16 306
Starbucks 49 16 18 78 99 11 271
Restaurant Brands International 112 59 40 47 9 267
Ferrero 36 10 87 23 16 92 264
Philip Morris 2 172 5 56 235
Kraft Heinz 5 4 120 7 2 86 224
Generall Mills 14 6 129 6 35 190
Mayora Indah 4 152 4 17 177
Keurig Dr Pepper 37 7 22 93 7 166
Heineken International 121 4 1 31 7 164
Solo Cup Co. 27 1 3 3 111 10 155
Walmart 29 5 20 1 1 87 143
Kellogg Company 4 74 4 1 56 139
Lidl 56 11 20 14 25 126
San Benedetto 112 5 1 4 122
Agrokor 31 63 3 10 1 2 110
Haribo 1 10 5 2 91 109
Rauch 52 3 1 51 107
Tudung Group 67 5 33 1 106
Total 12,228 3,445 5,826 4,461 1,871 5 5,777 33,613
30References
1
Statista, 2018. “Global plastic production from 1950 to 2016 (in million metric tons).”
https://www.statista.com/statistics/282732/global-production-of-plastics-since-1950/
2
Geyer, Jambeck, Law, 2017. “Production, use, and fate of all plastics ever made.”
Scientific Advances. 3 (7).
3
Greenpeace, 2017. “Nestlé, Unilever, P&G among worst offenders for plastic pollution in Philippines
in beach audit.” https://www.greenpeace.org/international/press-release/7621/nestle-unilever-pg-
among-worst-offenders-for-plastic-pollution-in-philippines-in-beach-audit/
4
The complete list can be found here: http://www.no-burn.org/find-out-which-companies-are-
responsible-for-plastic-pollution-in-asia-pacific/
5
The data from the India cleanups is not included in the dataset for this report. The plastic pollution, site,
and volunteer counts for those cleanups is in addition to those tallied for this report.
6
Those organizations include: Let’s Do It Ghana, 5 Gyres, Amics de la Terra Mallorca, Amow Foundation,
CEJAD, Inland Ocean Coalition, Društio Ekologi brez meja (Let’s Do It Slovenia), FloPIRG Chapter at
Eckerd College, NESMAC, Nipe Fagio, Rockefeller University, Sous Les Dechets La Plage, Utah Ocean
Coalition, Wishtoyo Chumash Foundation
7
CIEL, 2017. “How Fracked Gas, Cheap Oil, and Unburnable Coal are Driving the Plastics Boom”.
https://www.ciel.org/reports/fuelingplastics/
8
BBC, 2018. “Fife beach ‘worst’ for nurdle pollution”. https://www.bbc.com/news/uk-scotland-44196556
9
Eunomia, 2018. “Investigating options for reducing releases in the aquatic environment of microplastics
emitted by (but not intentionally added in) products”. http://www.eunomia.co.uk/reports-tools/
investigating-options-for-reducing-releases-in-the-aquatic-environment-of-microplastics-emitted-by-
products/
10
Forbes, 2017. “World’s Largest Food And Beverage Companies 2017: Nestle, Pepsi And Coca-Cola
Dominate The Field”. https://www.forbes.com/sites/maggiemcgrath/2017/05/24/worlds-largest-food-
and-beverage-companies-2017-nestle-pepsi-and-coca-cola-dominate-the-landscape/#61eba0fa3a69
11
India: Hindustan Times, 2017. “India recycles 90% of its PET waste, outperforms Japan, Europe and
US: Study” https://www.hindustantimes.com/mumbai-news/india-recycles-90-of-its-pet-waste-
outperforms-japan-europe-and-us-study/story-yqphS1w2GdlwMYPgPtyb2L.html; US, Europe, Japan:
The Guardian, 2010. “Japan streets ahead in global plastic recycling race.” https://www.theguardian.
com/environment/2011/dec/29/japan-leads-field-plastic-recycling
12
The Guardian, 2017. “A million bottles a minute: world’s plastic binge ‘as dangerous as climate
change’”. https://www.theguardian.com/environment/2017/jun/28/a-million-a-minute-worlds-plastic-
bottle-binge-as-dangerous-as-climate-change
13
As You Sow, 2010. https://www.asyousow.org/our-work/waste/beverage-container-recycling
14
As You Sow, 2018. “PepsiCo Foundation Announces Recycling Challenge, But Commitment Unlikely to
Move the Needle”. https://www.asyousow.org/press-releases/2018/7/31/pepsi-recycling-challenge
31You can also read