Vulnerability of Cryptocurrency Markets: A Study of the Relationship Between High-Impact Users and Bitcoin Market Price Volatility
←
→
Page content transcription
If your browser does not render page correctly, please read the page content below
Vulnerability of Cryptocurrency Markets:
              A Study of the Relationship Between
             High-Impact Users and Bitcoin Market
                          Price Volatility

                   Kunpeng Xu1,3 , Feng Liu2,3(B) , and Jiayin Qi3(B)
     1 School of Statistics and Information, Shanghai University of International Business
                                and Economics, Shanghai, China
2 School of Computer Science and Technology, East China Normal University, Shanghai, China
                                      lsttoy@163.com
      3 Institute of Artificial Intelligence and Change Management, Shanghai University
                  of International Business and Economics, Shanghai, China
                                    qijiayin@139.com

       Abstract. While the blockchain cryptocurrency market is becoming increasingly
       sought after, the vulnerability of the crypto market has also been brought to the
       attention of some academics. Based on cryptocurrency price data in TradingView
       database, this paper studies the effect of high-impact users’ comments on bitcoin
       price volatility in social media. The results show that when the Bitcoin market is in
       the listing channel, high-impact user speech does not bring significant abnormal
       returns. When Bitcoin market is in a downward channel, High-Impact community
       leaders’ empty talk produces significant negative returns.

       Keywords: Blockchain · Cryptocurrency · Vulnerability of the Crypto Market ·
       Bitcoin

1 Introduction
In recent years, Wall Street investment institutions and individuals have deployed the
field of cryptocurrency, pushing Bitcoin — a financial investment product to a historical
peak of $64,000 in mid-April. However, with market speculation reaching its peak,
Tesla, which previously publicly supported Bitcoin payment, announced that it would
no longer accept Bitcoin as a payment method. Its founder Elon Musk frequently tweeted
accusing Bitcoin of excessive energy consumption. This has caused extreme fluctuations
in the cryptocurrency market, and the price of the currency has suddenly fallen sharply,
seriously jeopardizing the self-interest of investors. As a financial investment product,
the influence mechanism of price fluctuation behind cryptocurrency is a hot issue in
academic circles at home and abroad in recent years. Based on the event study method,
this study takes Musk as an example to investigate the impact of high-influential users of
social media on the market price of Bitcoin. By constructing an abnormal return model
for Bitcoin, this study provides more direct evidence that the posting of information by
high-influential users triggers more noisy trading behaviour under social media.

© The Author(s) 2023
D. Qiu et al. (Eds.): ICBBEM 2022, AHIS 5, pp. 688–703, 2023.
https://doi.org/10.2991/978-94-6463-030-5_69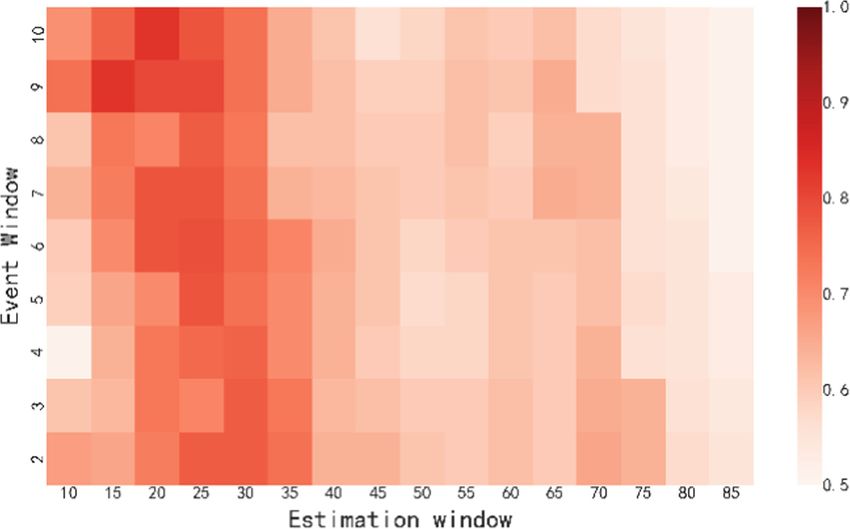
Vulnerability of Cryptocurrency Markets     689

2 Literature Review
2.1 Research Related to Factors Affecting the Price of Cryptocurrencies

Cryptocurrencies emerged after the global financial crisis in 2008 [11] and Satoshi
Nakamoto (2008) proposed Bitcoin in his article as a digital currency using an open-
source payment system. Cryptocurrencies are mainly new electronic currencies that take
a distributed book-keeping approach to mining, creating, issuing and circulating based
on blockchain technology. It is divided into private digital currencies and legal digital
currencies by sovereign endorsement [13]. Private digital currencies are issued by non-
state entities, also known as virtual currencies, and are digital currencies that are issued
and controlled by developers, are not regulated by governments, and circulate among
members of a virtual community [5], such as Bitcoin and Ethereum.
    With the advent of Bitcoin, hundreds of cryptocurrencies have been invented and the
market capitalisation of cryptocurrencies as a whole has grown significantly. As an asset
class [2], cryptocurrencies, represented by Bitcoin, have attracted widespread attention
from investors, regulatory authorities, policy makers, technicians, entrepreneurs and
academics [8].
    At present, there are two research perspectives on the influencing factors of Bitcoin
price fluctuation: the traditional financial theory under the assumption of rational man
and the behavioural finance theory which is more explanatory to practical problems.
In the study of traditional financial theory [6], Bitcoin, as a new financial asset, has
a pricing theory based first on traditional theories such as the mean-variance model,
option pricing theory and efficient market theory. In addition, one study used supply
and demand equilibrium analysis in economics to construct a model of the operating
mechanism of bitcoin price formation [1].
    However, traditional financial theoretical research often relies on many assumptions
and has inherent flaws. In the study of behavioural finance, investors’ cognitive bias,
choice preference, and will control will all cause abnormal fluctuations in the securi-
ties market. Chen uses the noise trading theory of behavioural finance to explain the
phenomenon of abnormal fluctuations in financial asset prices [12]. Liu established an
evolutionary game model of the trading behaviour of noise traders and rational investors
in the financial market, which proved that noise trading strategies may exist for a long
time in the financial market [15]. The high-traffic head users in the financial sector have
a high reputation and a wide range of influence. They are a key node to promote noise
trading and contribute to abnormal market fluctuations. Zhang believes that investor
sentiment can be regarded as a “vane” of market trends [4]. Wang believes that the social
network relationship of social media user interaction is an important factor influencing
stock price fluctuations [14].

2.2 Research Related to the Influence of Opinion Leaders on Cryptocurrencies

Social media is becoming an important source of information for investors, containing
effective information that can assist them in their investment decisions [3]. As hubs
of social networks, opinion leaders control the flow of information between different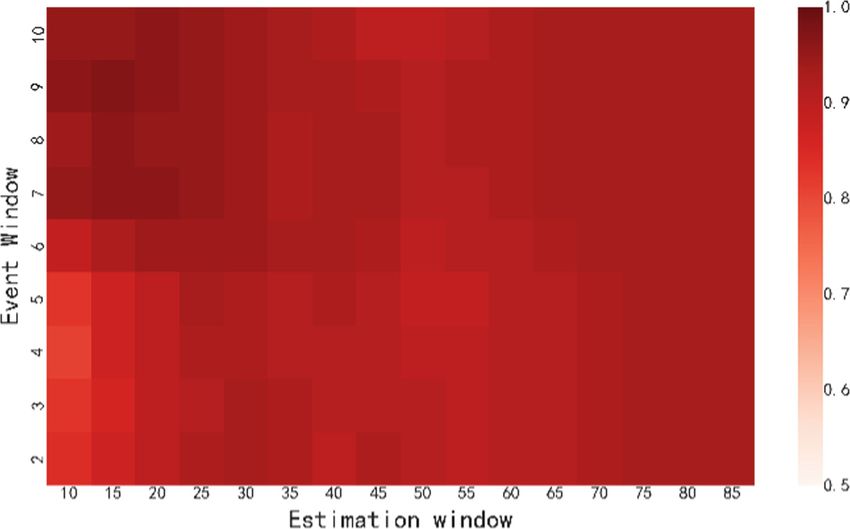
690     K. Xu et al.

groups. They have relatively strong appeal and realisation power among their fan base
and can influence asset price movements in financial markets.
    Garcia and Schweitzer investigate the correlation between opinion signals such as
voice indexes, sentiment scores, opinion polarisation and cryptocurrency prices by crawl-
ing social media for bitcoin-related tweets. The study demonstrates that trading strategies
based on social media sentiment may yield positive investment returns in the cryptocur-
rency market [7]. Linden collects raw data such as text, user information and times-
tamps from an active cryptocurrency community. Based on these data, the research uses
techniques such as dynamic topic modelling, text mining and unsupervised machine
learning to investigate the correlation between the evolution of social media opinions
and cryptocurrency prices [10].

3 Materials and Methods
3.1 Data Sources
In this paper, the daily data of Bitcoin price and Dogecoin price are from the Trad-
ingView database. Event one represents Tesla submitting documents to the Securities
and Exchange Commission (SEC) to disclose the company’s purchase of 1.5 billion dol-
lars of bitcoin (event 1). Event two represents Musk’s announcement that Tesla supports
bitcoin payment (event 2). Event three indicates that Tesla no longer accepts bitcoin
payment (event 3). In order to compare the impact of high-impact users of social media
on different cryptocurrency markets, this study adds empirical study to study the impact
of Musk’s speech on the price of dog-dog coins. The selected events are Musk Twitter’s
release of “Dogecoin rise to the moon” (event 4) and Musk’s drama of “Dogecoin is
a fraud” in variety shows (event 5). Event days corresponding to each event and range
settings for the estimation window, event window, and ex-post window can be found in
Table 1.

3.2 Empirical Study
This study selects the market model of event analysis method to conduct specific research
on Musk’s comments on Bitcoin. The market model needs to select the market index with
strong representativeness and high accuracy. In this study, the median filter-improved
Pearson correlation model is used to explore the synchronization relationship between
the two market indexes of “Total market value of cryptocurrency with bitcoin” and “Total
market value of cryptocurrency without bitcoin”. In addition, the relationship between
the dynamic adjustment of the window range of the estimation window and the event
window and the R2 value of the regression model is studied. By observing the real-time
trend of bitcoin prices before and after the event, we set appropriate parameters for the
market model in the event study method and construct the abnormal rate of return model
of bitcoin. In order to measure the impact of high-impact users on abnormal market
volatility, this paper further explores the comments of the same high-impact user –
Musk on Bitcoin and Dogecoin cryptocurrencies, analyses the differences between the
abnormal market volatility of the two cryptocurrencies, and uses the prospect theory of
behavioural finance to demonstrate the underlying reasons.
Table 1. Selection of Event Windows
Experiment 1 Experiment 2
Event1 Event2 Event3 Event4 Event5
Event Day 2021.2.8 2021.3.24 2021.5.13 2021.1.28 2021.5.9
Estimated Window [−30,−11] [−30,−11] [−30,−11] [−90,−11] [−90,−11]
(Time Period) 2021.1.9–2021.1.28 2021.2.22–2021.3.13 2021.4.13–2021.5.2 2020.10.30–2021.1.17 2021.2.8–2021.4.28
Event window [−10,10] [−10,10] [−10,10] [−10,10] [−10,10]
(Time Period) 2021.1.29–2021.02.18 2021.3.14–2021.4.3 2021.5.3–2021.5.23 2021.1.18–2021.2.7 2021.4.29–2021.5.19
Post-event window [11,30] [11,30] [11,30] [11,30] [11,30]
(Time Period) 2021.02.19–2021.3.10 2021.4.4–2021.4.23 2021.5.24–2021.6.12 2021.2.8–2021.2.27 2021.5.20–2021.6.8
Vulnerability of Cryptocurrency Markets
691692 K. Xu et al.
3.2.1 Market Index Comparison in Market Model
Abnormal yield is the most critical index in the event analysis method, which refers
to the difference between the actual yield and the normal yield. It is mainly used to
determine whether the occurrence of a characteristic event in the capital market affects
asset prices. Wang compares mean adjustment model, market adjustment model and
market model to describe the use range of abnormal return model [9]. Previous studies
on Bitcoin have mostly used constant mean return models for estimation. However, Wall
Street institutions such as Goldman Sachs and Morgan Stanley have begun to embrace
cryptocurrencies, the cryptocurrency space has created a financial market with a total
market capitalisation of over US$2 trillion. Therefore, a market model can be used to
derive a more accurate estimate of normal returns from the relationship between bitcoin
returns and the cryptocurrency market. After comparing the three models, this study
selects the market model for estimation, and the model is set as follows:
ARit = Rit − (αi + βi Rmt ) (1)
Where ARit represents the abnormal return of the Asset I in period t, Rmt represents
t-period market index, corresponding to normal yield. Based on the characteristics of
the cryptocurrency market, this study chooses a market model where the market index
is estimated using the “total market value of cryptocurrencies containing bitcoin”. The
abnormal return is the difference between the actual return Rit and the normal return
ERit in the event window:
ARit = Rit − ERit (2)
3.2.2 Relationship Between Market Index and Regression Model Parameters
The market model is related to the R2 value of the regression model. The larger the
R2 value is, the more the variance of the abnormal return is reduced, and the greater
the return is. Therefore, the empirical two studies the relationship between the dynamic
adjustment of the window range of the estimation window and the event window and
the R2 value of the regression model.
3.2.3 Empirical Study 1 - The Relationship Between Musk’s Speech and Abnormal
Return Rate in The Bitcoin Market
In empirical 3, the market index is the total market value of the cryptocurrency without
bitcoin. The estimation window is set as [−30, −11], the event window is set as [−10,
10], and the post-event window is set as [11, 30]. The market model is established to
calculate the abnormal return rate of the bitcoin market when events occur.Vulnerability of Cryptocurrency Markets 693
3.2.4 Empirical Study 2 - The Relationship Between Musk’s Remarks and Ab-
Normal Returns of Dogecoin Market
The impact of high-impact user’s comments on social media on different cryptocurrency
markets is different. In order to further explore the differences in the self-regulation
ability of different cryptocurrency markets, empirical 4 uses Dogecoin market price as
the research object of cryptocurrency. Based on the characteristics of the price trend of
Dogecoin, the estimated window of the market model is set as [−90, −11], and the rest is
consistent with the setting of empirical three, and the abnormal return rate of Dogecoin
market is calculated when events 4 and 5 occur.
4 Results
4.1 Results of Correlation Analysis of Different Market Indices
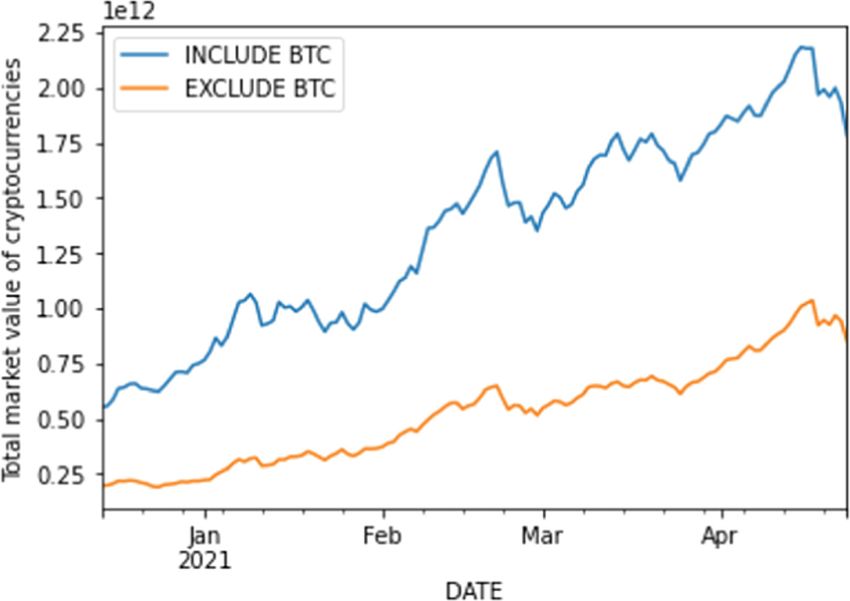
In order to explore the relationship between the two indexes of ‘Total Market Value
of Crypto-currency with Bitcoin’ and ‘Total Market Value of Cryptocurrency without
Bitcoin’, the graph 1 has been showing the market value trend of the two since December
2020. It can be seen that the trend is highly correlated. Figure 2 uses median filtering
technique and nonlinear method to smooth market noise. In addition, the time span
of market data required for target events in this study is from December 4, 2020 to
April 23, 2021, and the Person co-efficient of the two is 0.983(***) by using the data
of this time period, which fully reflects the global synchronization. Figure 1 calculates
the synchronization of sliding windows by setting the window width of 30 days, and
shows the synchronization results at each moment. It can be seen from the figure that in
January–February 2021, the Pearson co-efficient fluctuated abnormally from 0.9 to 0.5.
This is because Bitcoin is in an upward channel during this period. Within a month, its
price rose from USD 31645 on January 27, 2021 to USD 55630 on February 19, 2021.
Fig. 1. Market Value Trend Map of Encryption Currency694 K. Xu et al.
Fig. 2. Variation Chart of Two Index Pearson Coefficients
Fig. 3. Regression model 1 - fitting coefficient R2 thermal diagram
4.2 Results of Regression Model Para-Meters over Time Windows
The study takes Event 2 (Musk announced that Tesla supported Bitcoin payment) as an
example to study the relationship between event window, estimation window range and
the R2 value of the regression model in the event analysis method. In the figure, the Y-axis
indicates the range of the selected event window from two days before and after the event
day to ten days, and increases in two days as a unit. The X-axis in the graph represents the
range of the estimation window from the first ten days to eighty-five days, and increases
in five days. Regression model 1 takes ‘Total Market Value of Cryptocurrency without
Bitcoin’ as independent variable, and ‘Bitcoin yield’ as dependent variable. The average
R2 of the model is 0.6383, and the corresponding regression co-efficient R2 of each
parameter is shown in Fig. 3. Regression model 2 sets the independent variable as ‘Total
Market Value of Cryptocurrency with Bitcoin’, and the others are consistent with model
1. After calculation, the overall mean R2 is 0.9202. Figure 4 reflects the dynamic change
of R2 with parameters in regression model 2.Vulnerability of Cryptocurrency Markets 695
Fig. 4. Regression model 2 - fitting coefficient R2 thermal diagram
4.3 Results of Abnormal Return Statistics Corresponding to Events 1–5
The abnormal returns and cumulative returns corresponding to events 1–5 were calcu-
lated for this study. Event 1 represents Tesla’s disclosure of the company’s purchase of
$1.5 billion in bitcoin. Using Event 1 as an example, Table 2 shows the impact of this
event on the Bitcoin trading market. Rt represents the normal return on Bitcoin, Rmt
represents the market index (Total market value of cryptocurrencies containing bitcoin)
return, and E(Rt) represents the return presented by the regression results. And ARt rep-
resents the abnormal return of the Bitcoin in the trade date, CARt denotes the cumulative
abnormal return from the first day of the event window.
In order to explore the influence of Musk’s speech on the cryptocurrency market,
this study adds Doge coin as a control group for supplementary research. Event 4 (Musk
released dog coins related tweets), event 5 (Musk in the variety show called ‘dog coin is
a fraud’), using the same market model to calculate the corresponding data. The results
of the abnormal returns statistics for other events can be found in Tables 3, 4, 5, and 6.696 K. Xu et al.
Table 2. Statistical results of abnormal returns for Event 1
Trade date Rt Rmt E(Rt) ARt CARt
1/29/2021 0.1294 0.058 0.0441 0.0854 0.0854
1/30/2021 −0.039 −0.0009 −0.0067 −0.0323 0.053
1/31/2021 −0.0181 0.0044 −0.0021 −0.016 0.037
2/1/2021 0.0069 0.0201 0.0114 −0.0044 0.0326
2/2/2021 0.0347 0.0438 0.0318 0.0028 0.0354
2/3/2021 0.0497 0.0172 0.0089 0.0408 0.0763
2/4/2021 0.0269 0.0736 0.0575 −0.0307 0.0456
2/5/2021 −0.0003 0.0352 0.0244 −0.0248 0.0208
2/6/2021 0.0533 0.0296 0.0196 0.0337 0.0545
2/7/2021 −0.0246 −0.0281 −0.0302 0.0056 0.0601
2/8/2021 0.0895 0.0642 0.0494 0.0401 0.1002
2/9/2021 0.1003 0.0513 0.0383 0.062 0.1622
2/10/2021 −0.0233 0.0454 0.0332 −0.0565 0.1057
2/11/2021 0.0177 0.0306 0.0204 −0.0027 0.103
2/12/2021 0.0268 0.0395 0.0281 −0.0013 0.1017
2/13/2021 −0.0077 0.0281 0.0183 −0.026 0.0757
2/14/2021 0.0226 0.003 −0.0033 0.026 0.1016
2/15/2021 −0.0144 −0.0518 −0.0505 0.0361 0.1378
2/16/2021 0.0241 0.0264 0.0168 0.0072 0.145
2/17/2021 0.0408 0.0135 0.0057 0.0351 0.1802
2/18/2021 0.0184 0.0494 0.0367 −0.0183 0.1619
Table 3. Statistical results of abnormal returns for Event 2
Trade date Rt Rmt E(Rt) ARt CARt
3/14/2021 0.0251 0.012 0.0121 0.013 0.013
3/15/2021 −0.0419 −0.0282 −0.017 −0.025 −0.012
3/16/2021 −0.049 −0.0081 −0.0025 −0.0466 −0.0585
3/17/2021 0.0278 0.0295 0.0247 0.0031 −0.0554
3/18/2021 0.0076 0.0195 0.0175 −0.0099 −0.0652
3/19/2021 0.0154 −0.0021 0.0019 0.0135 −0.0518
3/20/2021 0.0179 0.0278 0.0235 −0.0056 −0.0573
3/21/2021 −0.0298 −0.028 −0.0168 −0.013 −0.0703
(continued)Vulnerability of Cryptocurrency Markets 697
Table 3. (continued)
Trade date Rt Rmt E(Rt) ARt CARt
3/22/2021 −0.0177 −0.0078 −0.0022 −0.0155 −0.0858
3/23/2021 −0.0297 −0.0207 −0.0115 −0.0182 −0.104
3/24/2021 0.0029 −0.0209 −0.0116 0.0146 −0.0894
3/25/2021 −0.0517 −0.0452 −0.0292 −0.0224 −0.1119
3/26/2021 0.0234 0.0492 0.0389 −0.0155 −0.1274
3/27/2021 0.0376 0.0307 0.0256 0.0121 −0.1153
3/28/2021 0.0078 0.0053 0.0072 0.0006 −0.1147
3/29/2021 0.016 0.0266 0.0226 −0.0066 −0.1213
3/30/2021 0.028 0.0284 0.0239 0.004 −0.1172
3/31/2021 0.0082 0.0101 0.0107 −0.0025 −0.1198
4/1/2021 0.0037 0.033 0.0273 −0.0236 −0.1433
4/2/2021 0.0088 0.0397 0.032 −0.0232 −0.1666
4/3/2021 −0.012 0.0071 0.0085 −0.0206 −0.1871
Table 4. Statistical results of abnormal returns for Event 3
Trade date Rt Rmt E(Rt) ARt CARt
5/3/2021 0.0132 0.0479 0.0207 −0.0075 −0.0075
5/4/2021 −0.0457 0.0074 −0.0047 −0.041 −0.0485
5/5/2021 0.0043 0.0347 0.0125 −0.0082 −0.0567
5/6/2021 0.0255 0.0517 0.0232 0.0024 −0.0543
5/7/2021 0.0016 −0.006 −0.0131 0.0147 −0.0396
5/8/2021 0.0218 0.0205 0.0036 0.0183 −0.0214
5/9/2021 −0.0064 −0.0003 −0.0095 0.0031 −0.0183
5/10/2021 −0.0183 −0.0078 −0.0142 −0.0041 −0.0224
5/11/2021 −0.0187 −0.0012 −0.0101 −0.0087 −0.0311
5/12/2021 −0.0402 0.0457 0.0193 −0.0595 −0.0907
5/13/2021 −0.0855 −0.0659 −0.0506 −0.0349 −0.1256
5/14/2021 0.0201 0.0619 0.0295 −0.0094 −0.135
5/15/2021 −0.0304 −0.0066 −0.0134 −0.017 −0.152
5/16/2021 −0.0379 −0.0393 −0.034 −0.004 −0.1559
5/17/2021 −0.0532 −0.0623 −0.0484 −0.0048 −0.1607
(continued)698 K. Xu et al.
Table 4. (continued)
Trade date Rt Rmt E(Rt) ARt CARt
5/18/2021 −0.0074 0.0174 0.0016 −0.009 −0.1697
5/19/2021 −0.1722 −0.2502 −0.1663 −0.0059 −0.1756
5/20/2021 0.0433 −0.0149 −0.0186 0.0619 −0.1137
5/21/2021 −0.0225 −0.0244 −0.0246 0.0021 −0.1115
5/22/2021 −0.021 −0.0838 −0.0619 0.0409 −0.0706
5/23/2021 −0.0654 −0.1254 −0.088 0.0226 −0.048
Table 5. Statistical results of abnormal returns for Event 4
Trade date Rt Rmt E(Rt) ARt CARt
1/18/2021 0.0044 0.0196 0.0362 −0.0318 −0.0318
1/19/2021 0.0206 0.0324 0.0563 −0.0356 −0.0674
1/20/2021 −0.0547 −0.0467 −0.0676 0.0129 −0.0545
1/21/2021 −0.0296 −0.0555 −0.0813 0.0517 −0.0028
1/22/2021 −0.0475 −0.0461 −0.0666 0.019 0.0162
1/23/2021 0.0506 0.0435 0.0737 −0.0231 −0.0069
1/24/2021 0.0164 0.0035 0.011 0.0054 −0.0015
1/25/2021 −0.0214 0.0463 0.0781 −0.0995 −0.101
1/26/2021 −0.0408 −0.0515 −0.0751 0.0343 −0.0667
1/27/2021 −0.0569 −0.0305 −0.0421 −0.0148 −0.0815
1/28/2021 1.0604 0.0343 0.0593 1.0011 0.9196
1/29/2021 0.9758 0.0861 0.1404 0.8354 1.755
1/30/2021 −0.4859 −0.0264 −0.0357 −0.4502 1.3049
1/31/2021 0.0425 −0.0098 −0.0098 0.0522 1.3571
2/1/2021 0.0057 0.0121 0.0246 −0.0189 1.3382
2/2/2021 −0.1799 0.0382 0.0653 −0.2452 1.093
2/3/2021 0.0968 0.0389 0.0664 0.0304 1.1234
2/4/2021 0.3039 0.043 0.0729 0.231 1.3544
2/5/2021 0.0192 0.0138 0.0271 −0.0079 1.3464
2/6/2021 0.0577 0.0456 0.077 −0.0192 1.3272
2/7/2021 0.3073 −0.0274 −0.0374 0.3446 1.6718Vulnerability of Cryptocurrency Markets 699
Table 6. Statistical results of abnormal returns for Event 5
Trade date Rt Rmt E(Rt) ARt CARt
4/29/2021 0.0301 −0.008 0.0347 −0.0046 −0.0046
4/30/2021 0.0326 0.032 0.1024 −0.0698 −0.0744
5/1/2021 0.1215 0.0367 0.1105 0.011 −0.0634
5/2/2021 0.0497 −0.002 0.0447 0.0049 −0.0585
5/3/2021 0.0755 0.0306 0.1002 −0.0246 −0.0831
5/4/2021 0.206 −0.0179 0.0178 0.1882 0.1051
5/5/2021 0.1836 0.0211 0.0839 0.0997 0.2048
5/6/2021 −0.0069 0.0393 0.1148 −0.1217 0.0831
5/7/2021 0.0368 -0.0019 0.045 −0.0082 0.0749
5/8/2021 0.0694 0.0211 0.0839 −0.0146 0.0603
5/9/2021 −0.1828 −0.004 0.0414 −0.2242 −0.1639
5/10/2021 −0.1188 −0.0141 0.0243 −0.1431 −0.307
5/11/2021 0.0004 −0.0076 0.0353 −0.0349 −0.3419
5/12/2021 −0.0923 0.0062 0.0588 −0.151 −0.4929
5/13/2021 −0.0365 −0.0771 −0.0825 0.046 −0.4469
5/14/2021 0.1901 0.0502 0.1333 0.0568 −0.3901
5/15/2021 0 −0.017 0.0194 −0.0194 −0.4095
5/16/2021 −0.0538 −0.0391 −0.0181 −0.0357 −0.4452
5/17/2021 −0.0276 −0.0585 −0.051 0.0234 −0.4218
5/18/2021 0.0117 0.0073 0.0606 −0.0489 −0.4707
5/19/2021 −0.3534 −0.2232 −0.3303 −0.0231 −0.4938
5 Discussions
Aiming at the parameters of event window and estimation window in event analysis
method, previous studies mostly rely on subjective experience to set artificially. On
this basis, this study takes the two parameters as variables to quantitatively study the
influence of their changes on the fitting coefficient R2 of regression model. In addition,
in view of the fact that the cryptocurrency market has not yet formed a stable and widely
accepted market index, this study compares the performance of two index in the market
model and the relationship between them, and constructs the research model of Bitcoin
price fluctuation from the perspective of objective data and subjective consideration. The
results of the discussion are as follows.
a) This paper provides an idea for a quantitative study on the setting of parameters
for the event analysis method. The cryptocurrency market Bitcoin accounts for a700 K. Xu et al.
disproportionately high market capitalisation weighting and when a single invest-
ment underlying accounts for a dis-proportionately high market index, the index is
not representative. At the same time, the study compares the synchronisation rela-
tionship between the two indices, which are highly correlated. And after filtering
the anomalous market noise with the median filtering technique, the trends are also
extremely consistent, which can indicate that the “total market capitalisation of cryp-
tocurrencies without bitcoin” index is both representative and stable, expanding the
idea of researching price volatility in the cryptocurrency field.
b) Based on the empirical results, the event 1–5 abnormal returns and cumulative abnor-
mal returns are plotted separately in Fig. 5, whereby the reaction of the bitcoin price
to Musk’s release of information on Tesla’s policy towards bitcoin can be visualized.
Figure 5-a corresponding to Event 1 is taken as an example for analysis. Firstly,
the abnormal return rate of bitcoin in the event window fluctuates by nearly 4% on
the event day. The abnormal return rate return rate on the first day after the event
reaches the maximum positive value of about 6%, and the cumulative abnormal
return rate also reaches the maximum positive value of about 9%, indicating that
Tesla’s purchase of bitcoin has a substantial positive impact on the price of bitcoin.
On the day of the event, investors buy bitcoin in large quantities under the
stimulation of good news. However, on the second day after the event, with short-
seeing speculators entering the market rapidly, the price of bitcoin has been greatly
adjusted, and the abnormal return rate reaches the minimum negative value of 6.1%.
From five to ten days after the event, the abnormal return rate gradually stabilized.
Secondly, the volatility of the abnormal return rate on the first six days of the
event decreased, and the cumulative abnormal return rate within the first two days
was close to 0, indicating that the Bitcoin market did not expect Tesla to announce
its purchase of Bitcoin. Third, combined with the cumulative yield curve, this event
has a significant positive impact on the bitcoin market.
c) In order to measure the impact of high-impact users on the price trends of different
markets, this study explores the factors behind the impact differences by analysing the
volatility of the Bitcoin and Dogecoin markets in the face of news shocks. Figure 5-d
shows that when Musk made good comments, the abnormal rate of return on the
day of dog-dog coins could rise by about 100%. Figure 5-f shows that after Musk
released his bullish remarks, the maximum decline in the abnormal return on dog
money can reach 20%.
As the opinion leader of cryptocurrency market, Musk is also the investor of cryp-
tocurrency. Behind the frequent tweets about Dogecoin, Musk’s related comments
have also influenced the movement of Dogecoin market funds. On the contrary, there
are a large number of institutional investors in the Bitcoin market. They arbitrage
against unusual market fluctuations caused by information disclosure in a timely
manner. This move keeps the market price relatively stable.
As a result, commentary from opinion leaders tends to be limited. Therefore, the
comments of opinion leaders are often limited. Other Crypto-currency markets, such
as Dogecoin, have the characteristics of low market value and concentrated chips.
Behind the good or bad news, they often represent the inflow and outflow of marketVulnerability of Cryptocurrency Markets 701 Fig. 5. Event 1–5 Abnormal Return and Cumulative Abnormal Return Curve
702       K. Xu et al.

      funds. The impact of their statements on the market is usually essentially accompa-
      nied by abnormal changes in funds, rather than just the impact of information, and
      thus the abnormal return range is much larger than the bitcoin market.

6 Conclusions
Based on the price information of Bitcoin and Dogecoin, this paper studies the impact
of high-impact user comments on the cryptocurrency market. It is found that when the
bitcoin market is in the upward channel, favourable information occurs frequently, and
high-impact users’ comments are only favourable promoters to promote the rise. Due to
the existence of key investors, excessive abnormal returns cannot be formed. Conversely,
when the bitcoin market is in a downward channel, the adverse comments of high-impact
users can cause extreme panic in the market. And the large number of noise traders selling
in a frenzy to follow the trend created a terrible trampling effect, with abnormal returns
falling far more than the good news.
     To a certain extent, the conclusion of this study shows that the opinion leader effect
measured in this paper exists and has good applicability for the study of price fluc-
tuation in cryptocurrency market. However, due to the lack of relevant literature, the
measurement of opinion leader effect in this paper is still an attempt, there is room
for improvement and perfection. In addition, the window setting of the event analysis
method itself is uncertain, which has great subjectivity. Moreover, the fitting degree R2
calculated by OLS regression in the market model cannot accurately measure the quality
of the prediction results, which is also the limitation of this paper.
     The directions can be further investigated in this paper include the following three
points.
     a) Firstly, the potential factors that cause abnormal fluctuations in the cryptocurrency
market can be sorted out by modules. And the influence degree of each factor can
be examined in more detail. b) Secondly, we further study the difference between the
positive returns brought by good news and the negative returns caused by bad news.
Combined with the different returns and loss psychological utility values of different
types of investors, the next step in the research could be the next empirical research based
on prospect theory. c) Finally, when the event analysis market model predicts the normal
return of the market, the neural network and deep learning technology can be used to
improve the accuracy of the prediction and improve the credibility of the conclusion.

Acknowledgements. This work was supported by 2020 Joint projects between Chinese and
CEECs’ Universities, Research on the technology and method of data cross-border flow
governance, 202033.

References
 1. Biais, B., C. Bisiere, M. Bouvard, C. Casamatta and A. J. Menkveld (2020). “Equilibrium
    bitcoin pricing.” Available at SSRN 3261063.
Vulnerability of Cryptocurrency Markets 703
2. Corbet, S., Meegan, A., Larkin, C., Lucey, B., & Yarovaya, L. (2017). Exploring the dynamic
relationships between cryptocurrencies and other financial assets. Economics Letters, 165,
28–34.
3. Cheng, Wan-Yun Cheng, Lin, J. Investor sentiment and stock market indices in social media
[J]. Management Science, 2013, 26(05): 111–9.
4. Dan Zhang, Shiguang Liao (2009) “Research on Investor Sentiment in Chinese Stock Market”.
Securities Market Herald (10) 61–68.
5. European Central Bank. (2012). Virtual Currency Schemes. ECB.
6. Glaser, F., K. Zimmermann, M. Haferkorn, M. C. Weber and M. Siering (2014). “Bitcoin-
asset or currency? revealing users’ hidden intentions.” Revealing Users’ Hidden Intentions
(April 15, 2014). ECIS.
7. Garcia, D. and F. Schweitzer (2015). “Social signals and algorithmic trading of Bitcoin.”
Royal Society open science 2(9): 150288.
8. Koki, Constandina & Leonardos, Stefanos & Piliouras, Georgios. (2022). Exploring the pre-
dictability of cryptocurrencies via Bayesian hidden Markov models. Research in International
Business and Finance, Elsevier, vol. 59(C).
9. Ling Wang, Zhanhong Zhu (2012) “Research Innovation and Application Progress of Event
Analysis”. Social Sciences Abroad (01) 138–144.
10. Linton, M., E. G. S. Teo, E. Bommes, C. Chen and W. K. Härdle (2017). Dynamic topic
modelling for cryptocurrency community forums. Applied quantitative finance, Springer:
355–372.
11. Mensi, W., Al-Yahyaee, K. H., Al-Jarrah, I. W., Vo, X. V., & Kang, S. H. (2021). Does volatility
connectedness across major cryptocurrencies behave the same at different frequencies? a
portfolio risk analysis. International Review of Economics & Finance, 76.
12. Qian Chen, Qinyun Lai, Liang Chen (2010) “Risk asset pricing model and its application in
the Chinese stock market based on noise traders”. System Engineering - Theory & Practice
30(03) 385–395.
13. Wu, J., Liu, J., Chen, W., Huang, H., Zheng, Z., & Zhang, Y. (2021). Detecting mixing services
via mining bitcoin transaction network with hybrid motifs. IEEE Transactions on Systems,
Man, and Cybernetics: System, pp (99): 1–13. https://doi.org/10.1109/TSMC.2021.3049278.
14. Xinrui Wang, YueHe (2019) “Predicting Stock Market Fluctuations with Social Media Behav-
iors: Case Study of Sina Finance Blog”. Data Analysis and Knowledge Discovery 3(11):
108–119
15. Yi Liu, Jinghua Li (2012) “Research on the long-term existence of noise traders in the financial
market”. Management Review 24(07) 34–9
Open Access This chapter is licensed under the terms of the Creative Commons Attribution-
NonCommercial 4.0 International License (http://creativecommons.org/licenses/by-nc/4.0/),
which permits any noncommercial use, sharing, adaptation, distribution and reproduction in any
medium or format, as long as you give appropriate credit to the original author(s) and the source,
provide a link to the Creative Commons license and indicate if changes were made.
The images or other third party material in this chapter are included in the chapter’s Creative
Commons license, unless indicated otherwise in a credit line to the material. If material is not
included in the chapter’s Creative Commons license and your intended use is not permitted by
statutory regulation or exceeds the permitted use, you will need to obtain permission directly from
the copyright holder.You can also read