W&M ScholarWorks - William & Mary
←
→
Page content transcription
If your browser does not render page correctly, please read the page content below

W&M ScholarWorks

Reports

2020

Isotopes in the Estuary: Conception and Application of Stable and
Radioactive Carbon
Derek Detweiler
Virginia Institute of Marine Science

Follow this and additional works at: https://scholarworks.wm.edu/reports

   Part of the Environmental Chemistry Commons, Marine Biology Commons, and the Science and
Mathematics Education Commons

Recommended Citation
Detweiler, D. (2020) Isotopes in the Estuary: Conception and Application of Stable and Radioactive
Carbon. VA Sea 2020 Lesson Plans. Virginia Institute of Marine Science, William & Mary. doi: 10.25773/
f8rb-6z53

This Report is brought to you for free and open access by W&M ScholarWorks. It has been accepted for inclusion in
Reports by an authorized administrator of W&M ScholarWorks. For more information, please contact
scholarworks@wm.edu.
ISOTOPES IN
THE ESTUARY
CONCEPTION AND APPLICATION
OF STABLE AND RADIOACTIVE CARBON

              Derek Detweiler
              Virginia Institute of Marine Science

              Grade Level
              High School

              Subject Area
              Chemistry, Oceanography,
              and Environmental Science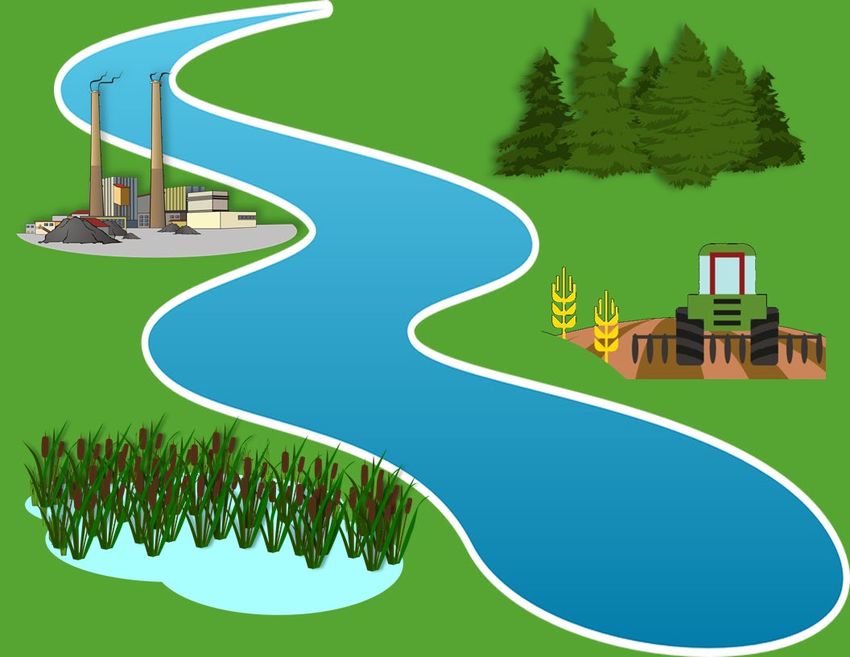
The 2019/2020 VA SEA project was made possible through funding from the
  National Estuarine Research Reserve System Margaret Davidson Fellowship Program which supports graduate students in
partnership with research reserves where fieldwork, research, and community engagement come together. VA SEA is currently
             supported by the Chesapeake Bay National Estuarine Research Reserve, Virginia Sea Grant, and the
                                Virginia Institute of Marine Science Marine Advisory Program.
Title: Isotopes in the Estuary: Conception and Application of Stable and Radioactive Carbon

Focus: Scientists use stable and radioactive carbon isotopes to determine the source and age of
environmental samples such as plant matter and soils.

Grade Level: High School Chemistry, Oceanography, Environmental Science

VA Science Standards:

CH.1 The student will investigate and understand that experiments in which variables are measured,
analyzed, and evaluated produce observations and verifiable data. Key concepts include:
       1. manipulation of multiple variables, using repeated trials.
       2. accurate recording, organization, and analysis of data through repeated trials.
       3. mathematical manipulations including graphing, ratio and proportion, construction and
           defense of a scientific viewpoint.
       4. the use of current applications to reinforce chemistry concepts.

CH.2 The student will investigate and understand that the placement of elements on the periodic table
is a function of their atomic structure. The periodic table is a tool used for the investigations of:
        1. average atomic mass, mass number, and atomic number.
        2. isotopes, half-lives, and radioactive decay.

CH.3 The student will investigate and understand how conservation of energy and matter is expressed in
chemical formulas and balanced equations. Key concepts include:
      1. balancing chemical equations.
      2. writing chemical formulas.

Learning Objectives: At the completion of this lesson, students will be able to:

       1. Define and explain the concept of stable and radioactive carbon isotopes.
       2. Describe how isotope data is collected and analyzed.
       3. Conduct analyses on isotope data by calculating proportions and averages of stable and
          radioactive carbon signatures.
       4. Compare isotope data from different land types within an estuary, including natural forests,
          wetlands, agriculture, and industry.
       5. Assess chemical compounds derived from different land types and their reactions with other
          compounds.
       6. Predict products of two reactants and develop balanced chemical equations based on
          provided chemical reactions.
       7. Communicate scientific results using oral and graphical interpretation.
       8. Apply stable and radioactive carbon isotopes in the context of real-world environmental
          issues and questions.

Virginia Scientists and Educators Alliance (VA SEA) 2020                  Derek Detweiler   Page 1 of 41
Total length of time required for lesson:
1 hr. 30 min. (or two class periods) with an optional 50 min. supplemental activity.

Key words, vocabulary: the following definitions are modified from Google Dictionary.

            Carbon (C) – belonging to group 14 on the Periodic Table of Elements, it is one of the most
            abundant elements on Earth, with atomic number 6 and atomic mass 12.011.

            Isotope – each of two or more forms of the same element that contain equal numbers of
            protons, but different numbers of neutrons in their nuclei, and hence differ in relative atomic
            mass but not in chemical properties.

            Carbon-12 (12C) – the most common natural carbon isotope of mass 12, with a nucleus
            containing six protons and six neutrons. It is the basis for the accepted scale of atomic mass
            units.

            Carbon-13 (13C) – a natural, stable isotope of carbon with a nucleus containing six protons
            and seven neutrons. As one of the environmental isotopes, it makes up about 1.1% of all
            natural carbon on Earth.

            Carbon-14 (14C) – a long-lived, naturally occurring radioactive carbon isotope of mass 14, its
            nucleus contains six protons and eight neutrons. C-14 is used in carbon dating and as a tracer
            in biochemistry. As one of the environmental isotopes, it makes up less than 0.1% of all
            natural carbon on Earth.

            Atomic number – the number of protons in the nucleus of an atom, which determines the
            chemical properties of an element and its place on the Periodic Table of Elements.

            Atomic mass – the mass of an atom of a chemical element expressed in atomic mass units. It
            is approximately equivalent to the number of protons and neutrons in the atom (the mass
            number) or to the average number allowing for the relative abundances of different isotopes.

            Radioactive decay – spontaneous breakdown of an atomic nucleus resulting in the release of
            energy and matter from the nucleus. Remember that a radioisotope has unstable nuclei that
            does not have enough binding energy to hold the nucleus together.

            Half-life – the time taken for the radioactivity of a specified isotope to fall to half its original
            value.

            Isotope ratio mass spectrometry (irMS) – measures relative abundance of isotopes in an
            environmental sample using mass-to-charge ratio of ions.

            Mass-to-charge ratio – in mass spectroscopy, the mass-to-charge ratio of a cation is equal to
            the mass of the cation divided by its charge.

Virginia Scientists and Educators Alliance (VA SEA) 2020                       Derek Detweiler    Page 2 of 41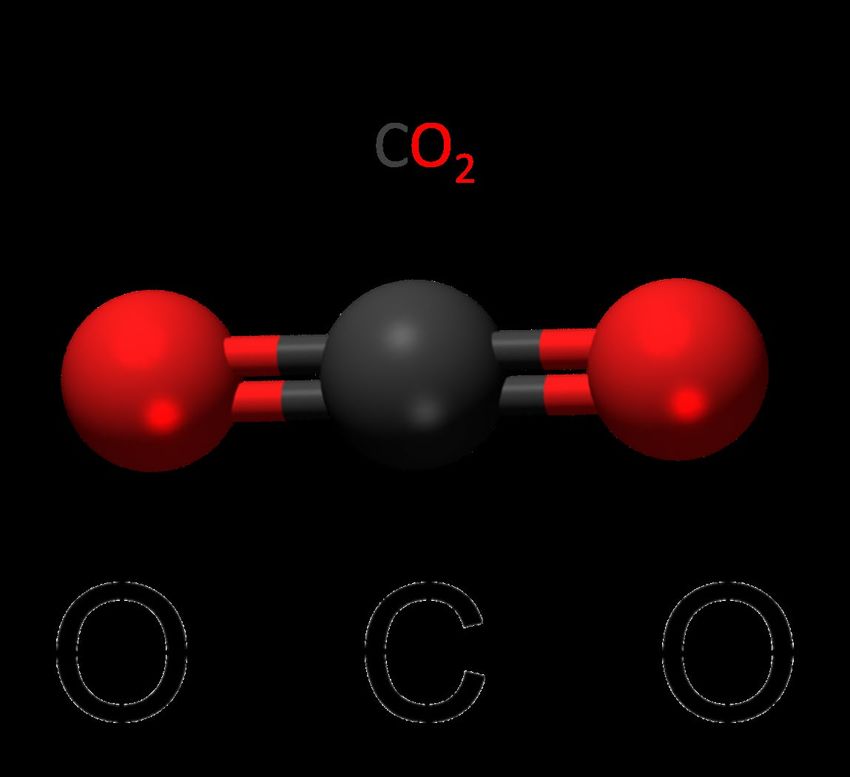
Ratio – the abundance of one thing compared to another (i.e. a proportion or fraction)
denoted by using a colon. For example, 2:1 means 2 to 1, or 2/1.
Ion – an atom or molecule with a net electric charge due to the loss or gain of one or more
electrons. A negatively charged ion is an anion, while a positively charge ion is a cation.
Estuary – a partially enclosed coastal body of brackish water with one or more rivers or
streams flowing into it, and with a free connection to the open sea.
Sea level rise – an increase in the level of the world’s oceans due to the effects of climate
change, including increasing temperatures and melting ice sheets.
Wetland – land consisting of marshes or swamps; saturated land.
Nitrate – a polyatomic ion with the molecular formula NO3−, a common component of
fertilizers in order to maximize crop yield.
Ammonium – a polyatomic ion with the chemical formula NH4+, a common waste product of
metabolic processes in animals.
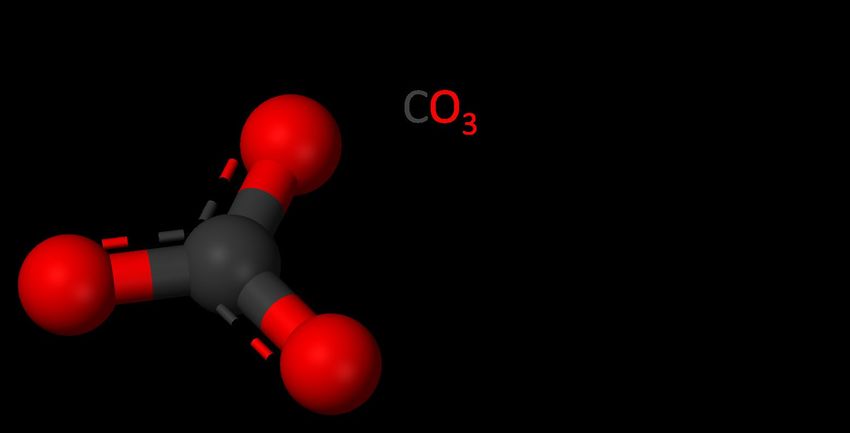
Carbonate – a polyatomic ion with the chemical formula CO32-. In aquatic systems, this
compound acts as a pH buffer so systems do not become too acidic.
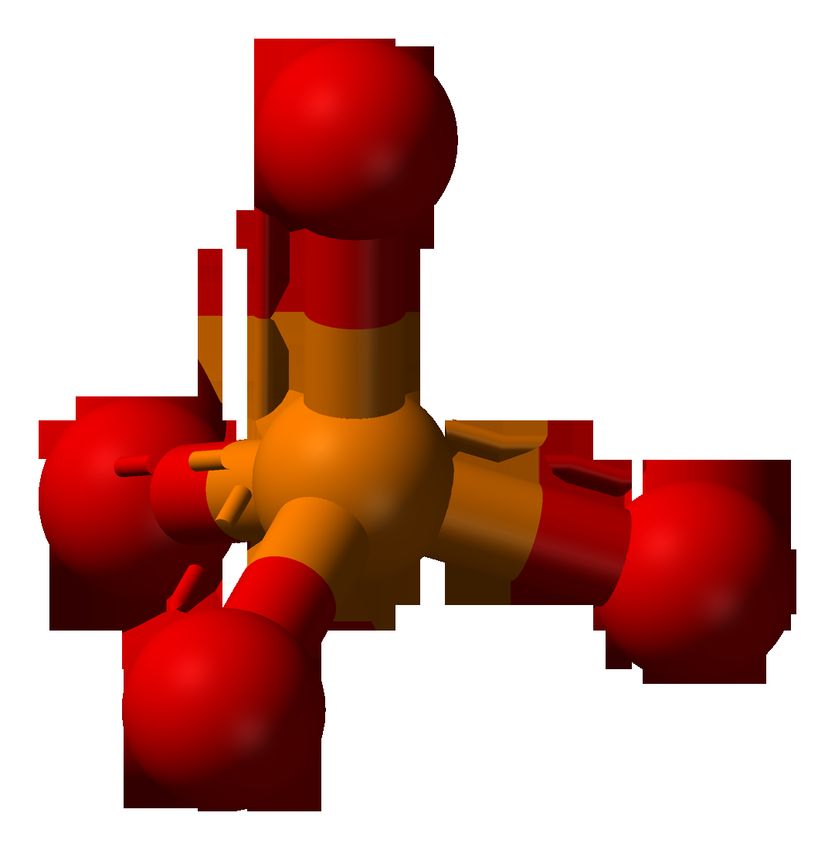
Phosphate – a polyatomic ion with the chemical formula PO43- . In aquatic systems, this
compound is present in minerals and is also used to fuel cellular processes of plants and
algae.
Glucose oxidation – the transformation of glucose sugar (C6H12O6) produced by plants and
algae to carbon dioxide (CO2) through respiration.
Carbon dioxide – a polyatomic ion with chemical formula CO2. It is a colorless, odorless gas
produced by burning fossil fuels. It is absorbed by plants in photosynthesis, but is becoming
increasingly important in the context of climate change because it is a greenhouse gas and is
responsible for Earth’s increasing temperatures.
Proxy – a variable that is not in itself directly relevant, but that serves in place of an
unobservable or immeasurable variable. For example, stable and radioactive carbon isotopes
are proxies for sources of carbon to estuaries.
Replicate – the action of copying or reproducing something.
Virginia Scientists and Educators Alliance (VA SEA) 2020 Derek Detweiler Page 3 of 41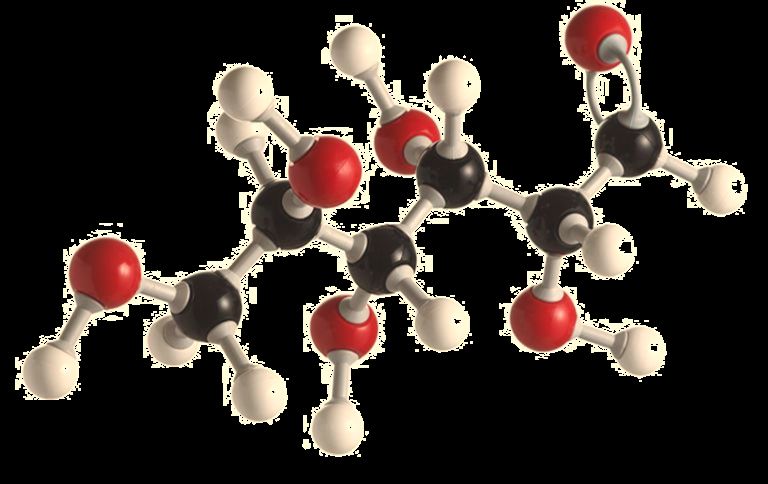
Background Information: The following information is simplified from Fry (2006) and Bianchi and Canuel
(2011), two collegiate-level chemistry textbooks specializing in isotopes and aquatic environments.

Carbon is one of the most abundant elements on Earth and is found in all living things including bacteria,
algae, plants, and animals. Elemental carbon is defined as having an atomic number of 6 and an atomic
mass of 12.0107 with 6 protons and 6 neutrons. However, this is only true most of the time. Have you
ever wondered why the mass of carbon is not exactly 12.0? This is because variations of the carbon
atom, though few, exist naturally in the environment.

A standard atom of carbon described above is more specifically defined as Carbon-12 (12C), which
comprises 98.93% of all naturally occurring carbon on Earth. Two variations of carbon, carbon-13 (13C)
and carbon-14 (14C), are also present in tiny amounts, and simply differ in their number of neutrons.
Carbon-13 has 6 protons, 7 neutrons, and comprises just 1.1% of all carbon on Earth. Carbon-14 has 6
protons, 8 neutrons, and comprises less than 0.1% of all carbon on Earth. Because these variations all
contain 6 protons, they are chemically the same. The difference in the number of neutrons is simply due
to natural variation caused by billions of years of Earth’s environmental history. We call carbon-13 and
carbon-14 isotopes of carbon-12.

The technical definition of an isotope is an atom of an element that has a different number of neutrons
but retains the same chemical characteristics. In Latin terminology, iso- means same, and -topos means
place. In this context, this means that isotopes have the same location on the Periodic Table of
Elements. Though carbon isotopes are the focus of this activity, all elements have various isotopes that
comprise their total abundance on Earth. However, there is typically one atomic form that dominates
the entire pool by more than 98%. As we will see, there is something hidden in that remaining 2% that
scientists can exploit for investigative purposes.

Isotopes can also be characterized as stable or radioactive. Stable isotopes, such as carbon-13, never
change or decay in the environment. Radioactive isotopes, such as carbon-14, spontaneously decay and
disappear over time. How can these two distinct properties be used in scientific research? The following
describes how stable and radioactive carbon isotopes work and how they are used in scientific research.

Scientists can use stable carbon isotopes (13C) to determine the source of materials in a given
environment. 12C dominates in all living things, but biochemical processes such as photosynthesis and
respiration in plants also use 13C. The biochemical pathways for these processes differ between types of
organisms, and therefore would differ in the relative amounts of 13C and 12C present in tissue. For
example, trees, wetland plants, and algae all perform different types of reactions to help them survive in
their respective environments. These reactions follow different pathways and utilize different amounts
of 12C versus 13C. Determining the ratio, or proportion, of these isotopes in an environmental sample
therefore provides insight into the source of the material.

Radioactive carbon, or radiocarbon (14C) is formed in the upper atmosphere when nitrogen loses a
proton and gains a neutron. On Earth, it is found in trace amounts mostly confined to the atmosphere
and surface deposits. The amount of 14C in the environment is almost constant, but decreases with a
predictable decay rate because it is unstable. Decay is measured in terms of half-life, or the time it takes
for one half of all unstable nuclei to decay. Carbon-14 has a half-life of 5,730 years, meaning that half of
an original parent material will remain after 5,730 years. Determining the ratio of 14C: 12C provides
Virginia Scientists and Educators Alliance (VA SEA) 2020                   Derek Detweiler   Page 4 of 41
information on the age of material. For instance, a high 14C: 12C would indicate younger material such as
that derived from plants, since there is still a lot of radiocarbon present. A low 14C: 12C would indicate
older material such as that derived from industry or agriculture, since there is not much 14C left.

In practice, stable and radioactive isotopes can be determined from a variety of environmental samples
including plant matter, soils, and water and are representative of both living and dead plant matter.
While collection and preparation varies, samples can ultimately be analyzed using isotope ratio mass
spectrometry (irMS). This analytical technique measures the mass-to-charge ratio of different elemental
ions, and the frequency or abundance of each carbon isotope is calculated. The mass-to-charge ratio is

equal to the mass (m) of an ion divided by its charge (z). The frequency or abundance of each m/z is
indicative of an isotope.

In environmental research, isotopes provide pertinent information about the quality of an environment
that might have a mixture of materials from different sources, such as estuaries. Estuaries, like the York,
James, and Rappahannock Rivers in Virginia, are partially enclosed coastal water bodies with one or
more rivers or streams flowing into them, and with a free connection to the open sea, in this case, the
Chesapeake Bay. Estuaries are at the interface between land and sea and experience influences from
many surrounding landscapes such as natural forests and wetlands, or more human-perturbed regions
such as agricultural or industrial land. By assessing samples from estuarine environments, one can
conclude how it is impacted by the surrounding landscape and therefore assess its quality.

Quality of estuaries is thereby impacted by the chemical compounds from different land types. If isotope
data suggests that an estuary is impacted by lots of agriculture or industry, scientists might wonder what
types of compounds contribute to this impact. For instance, estuaries might receive lots of fertilizer
runoff from agricultural land which is usually comprised of nitrate and ammonium, two compounds that
optimize the growth of crops. Additionally, factories might release lots of carbon dioxide due to the
burning of fossil fuels. Even natural land types influence the types of compounds found in estuaries. For
instance, forests release phosphate molecules, which are produced by mineral weathering. Wetlands
release carbonate, which buffers aquatic systems from sharp changes in pH. Lastly, the algae that live in
the estuary itself produce their own food in the form of simple sugars or glucose. Isotopes allow
scientists to draw conclusions about the types of chemical compounds that contribute to complex
estuarine water chemistry.

In this activity, students will embark on a journey through an estuary impacted by various land types
including natural forests, wetlands, agriculture, and industry. They assess the abundance of each type of
carbon isotope associated with each land type. Then, given an unknown sample, determine which land
type impacts their estuary “unknown” the most. Through this activity, students will also be introduced
to various aspects of the scientific process, including the importance of replication. Replication is the
action of copying or reproducing something. In research, it is important to sample an area more than
once to assure the accuracy and precision of results. That is, it is important that each replicate is similar
in value. Greater similarity indicates greater strength and power in your results.

Virginia Scientists and Educators Alliance (VA SEA) 2020                    Derek Detweiler   Page 5 of 41
A supplementary activity, titled “What’s in the Water? Visualizing Chemical Compounds in Estuaries,”
provides additional learning about the types of compounds associated with each land type. Here,
students are challenged to predict the products of reactants interacting within estuary waters to form
new compounds.

Materials and Supplies: For each group of 3-4 students, you will need:

       1. Estuary display (provided as five 8.5 x 11’’ sheets in Appendix A, to be assembled)
                 a. Can be assembled on larger poster board (optional)
       2. Access to color printer
       3. Scotch tape
       4. Scissors
       5. Three standard-dozen egg cartons (sampling plot)
       6. Large bag of rice (soil)                                 Round “tokens” cut from
       7. ~60 red beads (12C isotope)                              colored construction paper
       8. ~115 yellow beads (13C isotope)                          can be used an alternative.
       9. ~60 blue beads (14C isotope)
       10. Three dimensional model structures for the following chemical compounds. Note: Can be
           built using marshmallow modeling kits or if not available, use the two-dimensional structures
           in illustrated in Appendix B
                 a. Nitrate (NO3-)
                 b. Ammonium (NH4+)
                 c. Carbonate (HCO3-)
                 d. Phosphate (PO43-)
                 e. Glucose (C6H12O6)
                 f. Carbon dioxide (CO2)
       11. Marshmallow modeling kit (colored pompoms or modeling clay are an additonal alternative)
                 a. Pack of toothpicks
                 b. Pack of multi-color miniature marshmallows (Kraft Jet-Puffed FunMallows)
       12. 25x30” Post-it Easel Pad chart paper
       13. Data sheet (provided in Appendix C)

Virginia Scientists and Educators Alliance (VA SEA) 2020                 Derek Detweiler   Page 6 of 41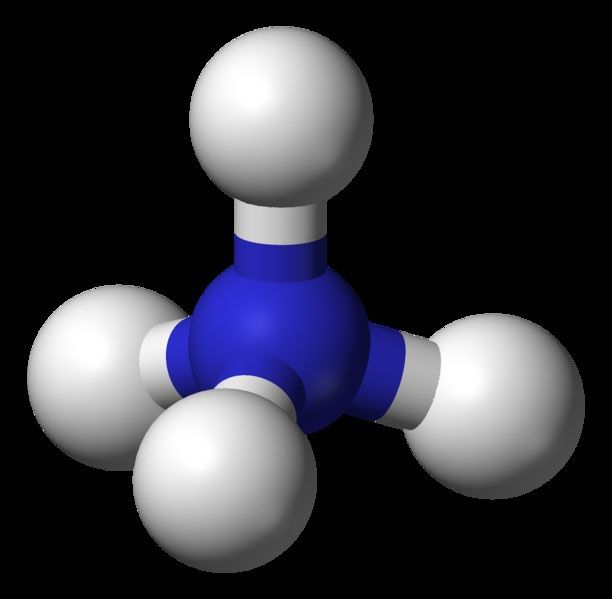
Teacher Preparation: For each group of 3-4 students, complete the following prior to lesson:

       1. Assemble estuary display by printing each of the provided
          8.5 x 11’’ sheets and either taping them together or gluing
          on a larger poster board.
       2. Remove tops (lids) of standard-dozen egg cartons.
       3. Cut bottom portion (the part that holds the eggs) of
          cartons into fractions of four “plots” or egg holders (2x2)
          (Fig. 1).
           a. Note: you will be able to get two 2x2 plots per egg
                carton, and can combine remaining 1x2 plot from two
                cartons to conserve resources.
       4. On each estuary display, place newly created plots on each       Fig 1: Schematic of sampling
          designated site (forest, wetland, agriculture, industry,         plots created from egg cartons.
          aquatic and unkown estuarine site).
       5. Place beads in each 2x2 plot (representative of samples) according to the following ratios
          (Fig. 2).
           a. Note: There are five types of “unknown” estuarine environments that can be used in
                this lesson, each impacted more or less by a certain landscape. Each group will have the
                same forest, wetland, agriculture, industrial, and and aquatic site. However, each group
                will be randomly assigned a different unknown to break up the redundancy among
                groups. Each unkown should match one of the common sites (see procedure).
           b. Forest site
                       i. Sample 1: 5 yellow, 1 red, 2 blue
                      ii. Sample 2: 3 yellow, 1 red, 1 blue
                    iii. Sample 3: 4 yellow, 2 red, 1 blue
                     iv. Sample 4: 5 yellow, 2 red, 1 blue
           c. Wetland site
                       i. Sample 1: 3 yellow, 2 red, 2 blue
                      ii. Sample 2: 4 yellow, 2 red, 4 blue
                     iii. Sample 3: 4 yellow, 3 red, 4 blue
                     iv. Sample 4: 5 yellow, 3 red, 4 blue
           d. Agricultural site
                       i. Sample 1: 3 yellow, 2 red, 1 blue               Fig. 2: Example of 2x2 sampling
                                                                          plot for forest site.
                      ii. Sample 2: 4 yellow, 2 red, 1 blue
                     iii. Sample 3: 4 yellow, 3 red, 1 blue
                     iv. Sample 4: 5 yellow, 3 red, 2 blue
           e. Industrial site
                       i. Sample 1: 2 yellow, 2 red, 1 blue
                      ii. Sample 2: 2 yellow, 1 red, 0 blue
                     iii. Sample 3: 3 yellow, 2 red, 0 blue
                     iv. Sample 4: 1 yellow, 1 red, 0 blue

Virginia Scientists and Educators Alliance (VA SEA) 2020                  Derek Detweiler   Page 7 of 41
f. Aquatic site
i. Sample 1: 4 yellow, 2 red, 1 blue
ii. Sample 2: 6 yellow, 3 red, 3 blue
iii. Sample 3: 2 yellow, 1 red, 0 blue
iv. Sample 4: 6 yellow, 3 red, 2 blue
g. Unkown estuarine site 1 (forest-influenced)
i. Sample 1: 4 yellow, 1 red, 1 blue
ii. Sample 2: 2 yellow, 1 red, 1 blue
iii. Sample 3: 5 yellow, 3 red, 2 blue
iv. Sample 4: 6 yellow, 2 red, 2 blue
h. Unknown estuarine site 2 (wetland-influenced)
i. Sample 1: 3 yellow, 2 red, 3 blue
ii. Sample 2: 5 yellow, 3 red, 4 blue
iii. Sample 3: 2 yellow, 1 red, 3 blue
iv. Sample 4: 4 yellow, 2 red, 4 blue
i. Unknown estuarine site 3 (agriculture-influenced)
i. Sample 1: 4 yellow, 1 red, 1 blue
ii. Sample 2: 2 yellow, 1 red, 0 blue
iii. Sample 3: 3 yellow, 3 red, 1 blue
iv. Sample 4: 3 yellow, 2 red, 2 blue
j. Unknown estuarine site 4 (industry-influenced)
i. Sample 1: 5 yellow, 5 red, 1 blue
ii. Sample 2: 2 yellow, 1 red, 0 blue
iii. Sample 3: 4 yellow, 3 red, 0 blue
iv. Sample 4: 1 yellow, 1 red, 1 blue
k. Unknown estuarine site 5 (no influences – aquatic)
i. Sample 1: 3 yellow, 1 red, 0 blue
ii. Sample 2: 5 yellow, 2 red, 2 blue
iii. Sample 3: 3 yellow, 2 red, 1 blue
iv. Sample 4: 5 yellow, 2 red, 1 blue
6. Fill plots with rice until isotopes are completely covered.
7. Note: Steps 1-6 can be simplified by cutting up “tokens” from colored construction paper to
match number of beads above, without egg cartons.
a. Duplicate as needed and cut colored sheets of paper into respective tokens.
b. Four replicate samples are to be placed at each site using the same color ratios as
described above.
Virginia Scientists and Educators Alliance (VA SEA) 2020 Derek Detweiler Page 8 of 418. For the supplemental activity,Vsualizing Chemical Compounds in the Estuary:
use marshmallows and toothpicks to construct three-dimensional models of representative
compounds that might be found at each site (Fig 3). As an alternative, illustrations of the
structures, provided in Appendix B, can be printed for student reference. If constructing
molecules, refer to sheets for correct structure. Be sure to assign each element a color so
that students are able to interpret the structure.
a. Forest site: phosphate (PO4) Fig. 3: Example of a
b. Wetland site: carbonate (CO3) carbonate (CO3)
c. Agriculture site: nitrate (NO3) and ammonium (NH4) marshmallow molecule. In
d. Industrial site: carbon dioxide (CO2) this example, white
e. Aquatic site: glucose (C6H12O6) marshmallows represent
carbon while blue
f. Other reactants:
represents oxygen.
i. Water (H20)
ii. Hydrogen ion (x2) (H)
iii. Oxygen gas (O2)
9. Place each compound at its respective site next to each sampling plot.
10. Provide printed data sheets (Appendix C) for each group.
Procedure:
1. Introduction (~30 minutes)
a. The instructor will introduce stable and radioactive isotopes and their environmental
applications using the provided PowerPoint.
b. Students will be split into groups of 3-4, each with an assigned display (unknown
estuarine site 1, 2, 3, 4, or 5). Depending on class size, some unknowns may have to
be assigned more than once.
c. The instructor will introduce and explain the activity using the second portion of the
provided PowerPoint.
2. Activity (~40 minutes)
a. Each group will work to collect isotopes from the known forest, wetland, agriculture,
industry, and aquatic sites (4 replicates per site) and organize them by color.
b. Each group will record the number of each isotope for each sample plot according to
color and record results on provided assessment sheet. The average of all plots for
each site will also be recorded.
c. Each group will calculate average ratios of 13C: 12C and 14C: 12C for each sample plot
according to color and record results on provided assessment sheet.
d. Repeat steps a-c for the unknown estuarine site. At this point, each group should
obtain a different result depending on their assigned unknown.
e. Each group will plot bar graphs of the average ratios of 13C: 12C and 14C: 12C on a
25x30” Post-it Easel Pad following the template provided on assessment sheet.
f. Based on isotope ratios from the forest, wetland, agriculture, industry, and aquatic
sites, students will decide what land type most impacts their estuary (based on result
from unknown) and write it on their graph. Students will complete the questions on
their assessment sheet.
Virginia Scientists and Educators Alliance (VA SEA) 2020 Derek Detweiler Page 9 of 413. Gallery Walk (~5 minutes)
a. After completing bar graphs, each group will display their graph around the
classroom.
b. Students will walk around to observe each graph and the conclusion reached by other
groups regarding the land type that most impacts their estuary. Note: the only
difference between each graph should be the bar representing the unknown, and the
unknown should closely match either the forest, wetland, agriculture, industry, or
aquatic site.
4. Wrap-up (~15 minutes)
a. Students will get back into original groups for a closing discussion led by the
instructor.
b. Representatives from each group will share results of their unknown with the entire
class. The class will discuss the answers to the following questions:
i. Based on your graph, does your prediction about the estuarine site make sense?
Why?
ii. What factors might contribute to a certain land type having a greater or lesser
impact on an estuary as indicated by your isotope analyses. For example, if your
estuary exhibited a pattern most similar to agriculture, why might this be so?
iii. Explain the pattern observed with 14C: 12C. That is, why would certain land types
exhibit older material compared to land types with younger material?
iv. Describe an environmental issue that you might be able to resolve, or provide
information about, by using stable and/or radioactive isotopes.
v. Case Study Question: Sea level rise is a current threat to wetlands due to coastal
development and the inability fo wetlands to adapt quickly enough. As a result,
wetlands can become inundated and disappear over time. They are essentially
drowned out. How might isotope signatures shift in response to wetland
disappearance.
c. The instructor will highlight the importance of stable isotopes and how they can be
used to determine the quality of material in estuaries.
5. Optional activity for take-home or additional class period.
What’s in the Water? Visualizing Chemical Compounds in Estuaries
(Note: This activity will work best if students already have experience writing chemical
formulas and balancing chemical equations).
a. Introduction (~10 minutes)
i. Using the provided PowerPoint, the instructor will introduce common chemical
compounds and associated chemical reactions for each land type used in the
isotope activity.
b. Activity (~30 minutes)
i. Students will examine the structure of these compounds using the provided
marshmallow models or print-outs.
ii. Students will predict the products of two given reactants and record results on
provided assessment sheets.
iii. If desired, students may also construct the products using marshmallow models.
c. Wrap-up (~10 minutes)
i. The instructor will review answers using the provided PowerPoint, incorporating
previous knowledge of writing chemical formulas and balancing equations.
Virginia Scientists and Educators Alliance (VA SEA) 2020 Derek Detweiler Page 10 of 41Assessment: Students will be assessed by successful completion of a turned-in data sheet as well as
active participation in group discussion and gallery walk. Overall, this activity can contribute to a
course’s class work and/or participation grade.
References
Bianchi, T.S. and Canuel, E.A. 2011. Chemical biomarkers in aquatic systems. Princeton
University Press: Princeton, New Jersey, 396 pp.
Fry, B. 2006. Stable isotope ecology. Springer Scientific: New York, NY, 308 pp.
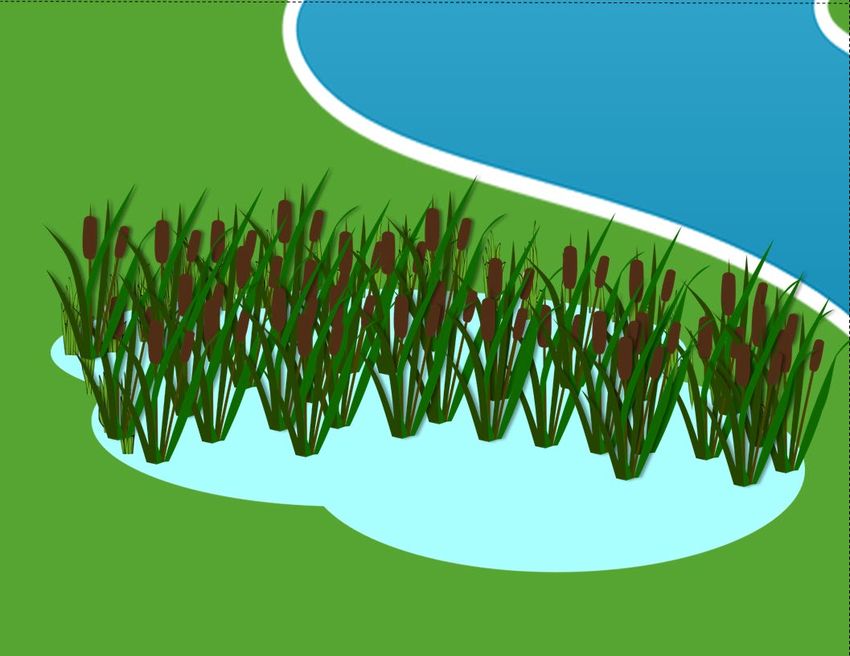
Virginia Scientists and Educators Alliance (VA SEA) 2020 Derek Detweiler Page 11 of 41Appendix A: Estuary Display
Print the following five 8.5 x 11’’ sheets
and assemble to create an estuary landscape display
Virginia Scientists and Educators Alliance (VA SEA) 2020 Derek Detweiler Page 12 of 41Virginia Scientists and Educators Alliance (VA SEA) 2020 Derek Detweiler Page 13 of 41
Virginia Scientists and Educators Alliance (VA SEA) 2020 Derek Detweiler Page 14 of 41
Virginia Scientists and Educators Alliance (VA SEA) 2020 Derek Detweiler Page 15 of 41
Virginia Scientists and Educators Alliance (VA SEA) 2020 Derek Detweiler Page 16 of 41
Virginia Scientists and Educators Alliance (VA SEA) 2020 Derek Detweiler Page 17 of 41
Appendix B: Chemical Compound Structures
                              Supplemental Activity – What’s in the Water? Visualizing Estuary Compounds
                                           Print the following 6 pages for student reference

Virginia Scientists and Educators Alliance (VA SEA) 2020                 Derek Detweiler   Page 18 of 41
Virginia Scientists and Educators Alliance (VA SEA) 2020 Derek Detweiler Page 19 of 41
Ammonium
                                                        NH4

Virginia Scientists and Educators Alliance (VA SEA) 2020   Derek Detweiler   Page 20 of 41
Phosphate
PO4
Virginia Scientists and Educators Alliance (VA SEA) 2020 Derek Detweiler Page 21 of 41Virginia Scientists and Educators Alliance (VA SEA) 2020 Derek Detweiler Page 22 of 41
Virginia Scientists and Educators Alliance (VA SEA) 2020 Derek Detweiler Page 23 of 41
Glucose (sugar)
                                                  C6H12O6

Virginia Scientists and Educators Alliance (VA SEA) 2020   Derek Detweiler   Page 24 of 41
Virginia Scientists and Educators Alliance (VA SEA) 2020 Derek Detweiler Page 25 of 41
Appendix C: Data Sheet
                                Print one data sheet (4 pages) for each group.
                                   If conducting the supplemental activity,
                                            print the 5th page also.

Virginia Scientists and Educators Alliance (VA SEA) 2020                   Derek Detweiler   Page 26 of 41
Name: ________________________
Isotopes in the Estuary: Conception and Application of Stable and Radioactive Carbon
Data Sheet
In student groups of 3-4, collect and organize samples from the known forest, wetland, agriculture,
industry, and aquatic sites. Each group will also collect and organize samples from an “unknown”
estuarine site. Record results here. Be sure to carefully and accurately calculate the average for the
number of each isotope and associated ratios of 13C: 12C and 14C: 12C.
12
C 13
C 14
C 13
C: 12C 14
C: 12C
Forest
Sample 1
Sample 2
Sample 3
Sample 4
Average
Wetland
Sample 1
Sample 2
Sample 3
Sample 4
Average
Agriculture
Sample 1
Sample 2
Sample 3
Sample 4
Average
Industry
Sample 1
Sample 2
Sample 3
Sample 4
Average
Aquatic
Sample 1
Sample 2
Sample 3
Sample 4
Average
Unknown Estuarine Site
Sample 1
Sample 2
Sample 3
Virginia Scientists and Educators Alliance (VA SEA) 2020 Derek Detweiler Page 27 of 41Sample 4
Average
1. Circle your assigned unknown estuarine site: 1 2 3 4 5
2. Create a bar graph for the average isotope ratios at each sample site. For the y-axis, convert
your ratio to a whole number (for example, plot 1.5:2.75 as 0.55, because 1.5 divided by 2.75 is
equal to 0.55).
C: 12C
13
Forest Wetland Agriculture Industry Aquatic Unknown
Site
Virginia Scientists and Educators Alliance (VA SEA) 2020 Derek Detweiler Page 28 of 41C: 12C
14
Forest Wetland Agriculture Industry Aquatic Unknown
Site
3. After analyzing your unknown sample, compare it to the known sites. What land type do you
believe most impacted your estuary?
Circle one: forest wetland agriculture industry no impact (aquatic signature)
4. Based on your graph, does your prediction about the unknown estuarine site make sense? Why?
5. What factors might contribute to a certain land type having a greater or lesser impact on an
estuary, as indicated by your isotope analyses. For example, if your estuary exhibited a pattern
most similar to agriculture, why might this be so?
6. Explain the pattern observed with 14C: 12C. That is, why would certain land types exhibit older
material compared to land types with younger material?
Virginia Scientists and Educators Alliance (VA SEA) 2020 Derek Detweiler Page 29 of 417. Describe an environmental issue that you might be able to resolve, or provide information
about, by using stable and/or radioactive isotopes.
8. Case Study Question: Sea level rise is a current threat to wetlands due to coastal development
and the inability fo wetlands to adapt quickly. As a result, wetlands can become inundated and
disappear over time. They are essentially drowned out. How might isotope signatures shift in
response to wetland disappearance.
Virginia Scientists and Educators Alliance (VA SEA) 2020 Derek Detweiler Page 30 of 41Name: ________________________
Supplemental Activity:
What’s in the Water? Visualizing Chemical Compounds in Estuaries
Data Sheet
After reviewing chemical compounds associated with each land type, predict the following products,
based on their reaction with other compounds in an estuary.
Agriculture
1. NH4+ + NO3- __________________ (ammonium nitrate)
Wetland
2. CO32- + H+ __________________ (bicarbonate)
Forest
3. PO43- + H+ __________________ (phosphoric acid)
Industry
4. CO2 + H20 __________________ (carbonic acid)
Aquatic
5. C6H12O6 + O2 ________ + _________
Virginia Scientists and Educators Alliance (VA SEA) 2020 Derek Detweiler Page 31 of 41Appendix D:
Instructor’s KEYS to Data Sheets
Isotopes in the Estuary: Conception and Application of Stable and Radioactive Carbon
In student groups of 3-4, collect and organize samples from the known forest, wetland, agriculture,
industry, and aquatic site. Each group will also collect and organize samples from an “unknown”
estuarine site. Record results here. Be sure to carefully and accurately calculate the average for the
number of each isotope and associated ratios of 13C: 12C and 14C: 12C.
12
C 13
C 14
C 13
C: 12C 14
C: 12C
Forest
Sample 1 1 5 2
Sample 2 1 3 1
Sample 3 2 4 1
Sample 4 2 5 1
Average 1.5 4.25 1.25 4.25 : 1.5 1.25 : 1.5
Wetland
Sample 1 2 3 2
Sample 2 2 4 4
Sample 3 3 4 4
Sample 4 3 5 4
Average 2.5 4.0 3.5 4.0 : 2.5 3.5 : 2.5
Agriculture
Sample 1 2 3 1
Sample 2 2 4 1
Sample 3 3 4 1
Sample 4 3 5 2
Average 2.5 4.0 1.25 4.0 : 2.5 1.25 : 2.5
Industry
Sample 1 2 2 1
Sample 2 1 2 0
Sample 3 2 3 0
Sample 4 1 1 0
Average 1.5 2.0 0.25 2.0 : 1.5 0.25 : 1.5
Aquatic
Sample 1 2 4 1
Sample 2 3 6 3
Sample 3 1 2 0
Sample 4 3 6 2
Average 2.25 4.5 1.5 4.5 : 2.25 1.5 : 2.25
Unknown Estuarine Site 1
Sample 1 1 4 1
Sample 2 1 2 1
Sample 3 3 5 2
Sample 4 2 6 2
Virginia Scientists and Educators Alliance (VA SEA) 2020 Derek Detweiler Page 32 of 41Average 1.75 4.25 1.5 4.25 : 1.75 1.5 : 1.75
Unknown Estuarine Site 2
Sample 1 2 3 3
Sample 2 3 5 4
Sample 3 1 2 3
Sample 4 2 4 4
Average 2.0 3.5 3.5 3.5 : 2.0 3.5 : 2.0
Unknown Estuarine Site 3
Sample 1 1 4 1
Sample 2 1 2 0
Sample 3 3 3 1
Sample 4 2 3 2
Average 1.75 3.0 1.0 3.0 : 1.75 1.0 : 1.75
Unknown Estuarine Site 4
Sample 1 5 5 1
Sample 2 1 2 0
Sample 3 3 4 0
Sample 4 1 1 1
Average 2.5 3.0 0.5 3.0 : 2.5 0.5 : 2.5
Unknown Estuarine Site 5
Sample 1 1 3 0
Sample 2 2 5 2
Sample 3 2 3 1
Sample 4 2 5 1
Average 1.75 4.0 1.0 4.0 : 1.75 1.0 : 1.75
1. Circle your assigned unknown estuarine site: 1 2 3 4 5
Answer will depend on assigned unknown.
Virginia Scientists and Educators Alliance (VA SEA) 2020 Derek Detweiler Page 33 of 412. Create a bar graph for the average isotope ratios at each sample site. For the y-axis, convert
your ratio to a whole number (for example, plot 1.5:2.75 as 0.55, because 1.5 divided by 2.75 is
equal to 0.55).
Unknown estuarine site 1
3
2
C: 12C
13
1
0
Forest Wetland Agriculture Industry Aquatic Unknown
1.5
1
C: 12C
14
0.5
0
Forest Wetland AgricultureSite Industry Aquatic Unknown
Virginia Scientists and Educators Alliance (VA SEA) 2020 Derek Detweiler Page 34 of 41Unknown estuarine site 2
3
2
C: 12C
13
1
0
Forest Wetland Agriculture Industry Aquatic Unknown
1.5
1
C: 12C
14
0.5
0
Forest Wetland Agriculture Industry Aquatic Unknown
Site
Virginia Scientists and Educators Alliance (VA SEA) 2020 Derek Detweiler Page 35 of 41Unknown estuarine site 3
3
2
C: 12C
13
1
0
Forest Wetland Agriculture Industry Aquatic Unknown
1.5
1
C: 12C
14
0.5
0
Forest Wetland Agriculture Industry Aquatic Unknown
Site
Virginia Scientists and Educators Alliance (VA SEA) 2020 Derek Detweiler Page 36 of 41Unknown estuarine site 4
3
2
C: 12C
13
1
0
Forest Wetland Agriculture Industry Aquatic Unknown
1.5
1
C: 12C
14
0.5
0
Forest Wetland Agriculture Industry Aquatic Unknown
Site
Virginia Scientists and Educators Alliance (VA SEA) 2020 Derek Detweiler Page 37 of 41Unknown estuarine site 5
3
2
C: 12C
13
1
0
Forest Wetland Agriculture Industry Aquatic Unknown
1.5
1
C: 12C
14
0.5
0
Forest Wetland Agriculture Industry Aquatic Unknown
Site
Virginia Scientists and Educators Alliance (VA SEA) 2020 Derek Detweiler Page 38 of 413. After analyzing your unknown sample, compare it to the known sites. What t land type do you
believe most impacted your estuary?
Circle one: forest wetland agriculture industry no impact (aquatic signature)
Students will reach their conclusion by looking at graphs of their isotope ratios and determining
which reference site closely matches their unknown. Unknown site 1 matches the forest site,
unknown site 2 matches the wetland site, unknown site 3 matches the agricultural site,
unknown site 4 matches the industrial site, and unknown site 5 matches the aquatic site.
4. Based on your graph, does your prediction about the unknown estuarine site make sense? Why?
Student reasoning should include that the ratio of 13C: 12C and 14C: 12C for the unknown site
closely matched that of a reference site and allowed them to narrow down their answer. That is,
unknown site 1 matches the forest site, unknown site 2 matches the wetland site, unknown site
3 matches the agricultural site, unknown site 4 matches the industrial site, and unknown site 5
matches the aquatic site.
5. What factors might contribute to a certain land type having a greater or lesser impact on an
estuary as indicated by your isotope analyses. For example, if your estuary exhibited a pattern
most similar to agriculture, why might this be so?
Students should be able to reach the conclusion that if their unknown estuarine site was
impacted by a certain land type, it is because that particular land type is most prominent in the
area while the other land types might not be present. For example, if students conclude that
their unknown site closely matches agricultural land, their particular estuary might be
surrounded by agricultural land (and could experience large amounts of fertilizer or polluted
runoff) and outnumber the total area of forest, wetland, or industrial land.
6. Explain the pattern observed with 14C: 12C. That is, why would certain land types exhibit older
material compared to land types with younger material?
This is a critical thinking question that extends beyond the conclusions made in this activity.
Therefore, the instructor may need to provide hints and guidance towards the correct answer.
Certain land types would exhibit older material compared to others depending on how each
land type functions and how it is used. For example, industrial sites emit fossil fuels that might
find their way into estuaries. Fossil fuels are formed over millions of years, meaning it would
have less carbon-14 and therefore a lower 14C: 12C. Wetlands also store a lot of material from
runoff and build up over time, resulting in a lower 14C: 12C as well. On the other hand, forest and
agriculture land types would exhibit younger material such as fertilizers, soils, or fresher leaf
material that could influence nearby estuaries and therefore have larger 14C: 12C.
Virginia Scientists and Educators Alliance (VA SEA) 2020 Derek Detweiler Page 39 of 417. Describe an environmental issue that you might be able to resolve or provide information about
by using stable and/or radioactive isotopes.
Answers will vary, but might include how changes in land type might impact estuarine water
quality (i.e. removal of forest, construction of some industrial complex), how current land type
influences estuarine water quality, and how estuaries differ by location and is reflective of
material sources. Other scenarios might involve situations where all of a sudden, there is a large
overgrowth of algae, or a major fish mortality event in which isotopes can be used to potentially
trace sudden changes in material sources over time.
8. Case Study Question: Sea level rise is a current threat to wetlands due to coastal development
and the inability fo wetlands to adapt quickly. As a result, wetlands can become inundated and
disappear over time. They are essentially drowned out. How might isotope signatures shift in
response to wetland disappearance.
Isotope signatures would be expected to shift more towards or potentially dominated by those
resembling aquatic environments (if completely inundated) or by forest, agriculture, or
industrial environments depending on the land type immediately adjacent to the affected
marsh.
Virginia Scientists and Educators Alliance (VA SEA) 2020 Derek Detweiler Page 40 of 41Instructor’s KEY to Supplemental Activity Data Sheet
What’s in the Water? Visualizing Chemical Compounds in Estuaries
After reviewing compounds associated with each land type, predict the following products based on
their reaction with other compounds in an estuary.
Agriculture
1. NH4+ + NO3- NH4NO3 (ammonium nitrate)
Wetland
2. CO32- + H+ HCO3- (bicarbonate)
Forest
3. PO43- + H+ HPO42- (phosphoric acid)
Industry
4. CO2 + H20 H2CO3 (carbonic acid)
Aquatic
5. C6H12O6 + 6 O2 6 CO2 + 6 H20
Virginia Scientists and Educators Alliance (VA SEA) 2020 Derek Detweiler Page 41 of 41You can also read