WADDEN SEA ECOSYSTEM No. 36 2016 - Breeding success in the Wadden Sea 2009-2012 - Wadden Sea World Heritage
←
→
Page content transcription
If your browser does not render page correctly, please read the page content below
Breeding success in the Wadden Sea 2009-2012

      WADDEN SEA ECOSYSTEM No. 36 - 2016
1

Breeding success in the Wadden Sea 2009-2012
                                     A review

                                         Breeding success in the Wadden Sea 2009-2012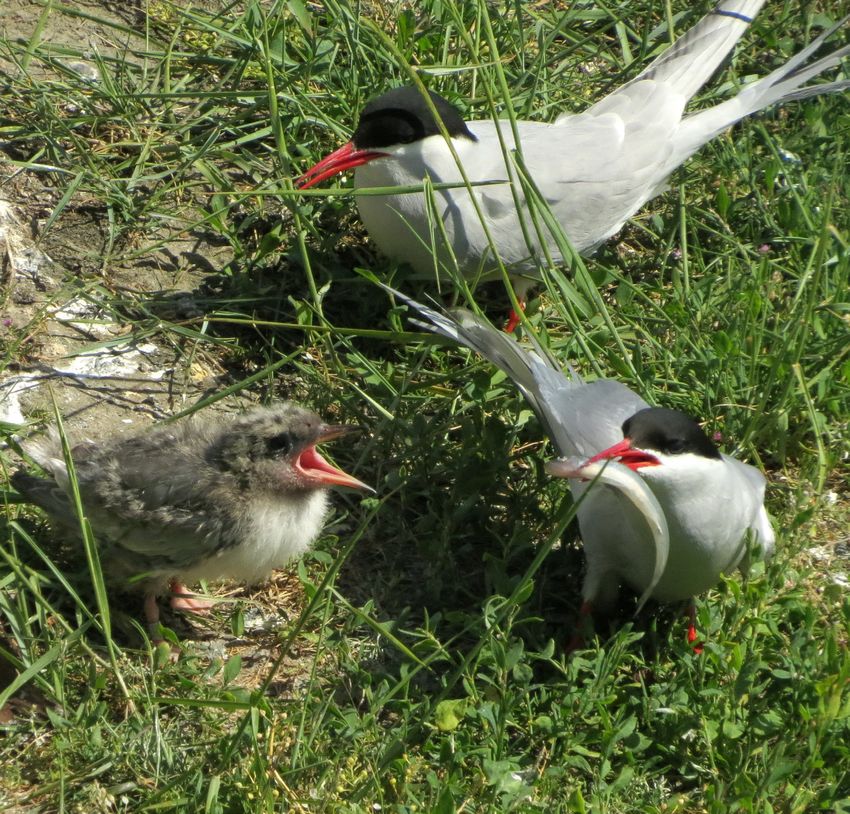
2

                                   Publishers
                                   Common Wadden Sea Secretariat (CWSS), Wilhelmshaven, Germany;
                                   Joint Monitoring Breeding Bird Group (JMBB)

                                   Editors
                                   Ole Thorup           Amphi Consult, Forskerparken 10, 5230 Odense M, Denmark
                                                        olethorup.fugleliv@gmail.com
                                   Kees Koffijberg      Sovon Vogelonderzoek Nederland, Natuurplaza, Toernooiveld 1,
                                                        6525 ED Nijmegen, The Netherlands.
                                                        kees.koffijberg@sovon.nl

                                   Cover photos
                                   Bernd Hälterlein

                                   Lay-out
                                   Gerold Lüerßen

                                   This publication should be cited as:
                                   Thorup, O. and Koffijberg, K. 2016. Breeding success in the Wadden Sea 2009-2012 A review.
                                   Ecosystem No. 36. Common Wadden Sea Secretariat, Wilhelmshaven, Germany.
                                   www.waddensea-secretariat.org, Wilhelmshaven Germany.

Breeding success in the Wadden Sea 2009-2012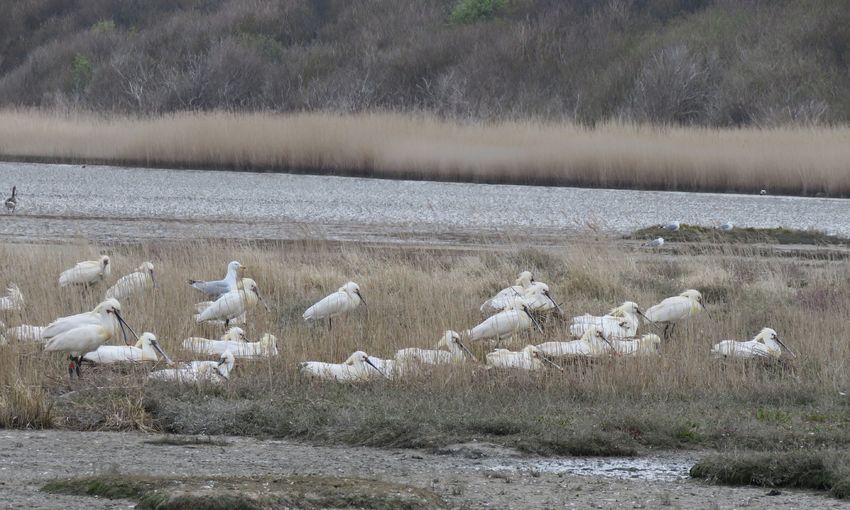
3

           WADDEN SEA ECOSYSTEM No. 36

Breeding success in the Wadden Sea 2009-2012
                                     A review

                                          Ole Thorup
                                      Kees Koffijberg

                                                      2016
                          Common Wadden Sea Secretariat
               Joint Monitoring Breeding Bird Group (JMBB)

                                                     Breeding success in the Wadden Sea 2009-2012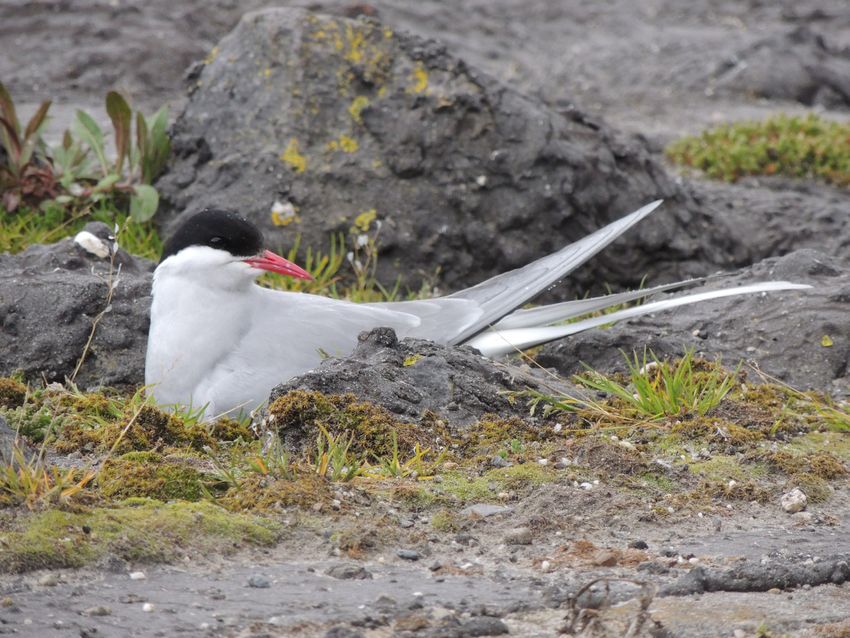
4
Contents
Summary - Resumé - Zusammenfassung - Samenvatting 5
1. Introduction and background 9
2. Methods 10
3. Breeding success of coastal breeding birds in the Wadden
Sea 2009-2012 12
3.1 Spoonbill 14
3.2 Eider 15
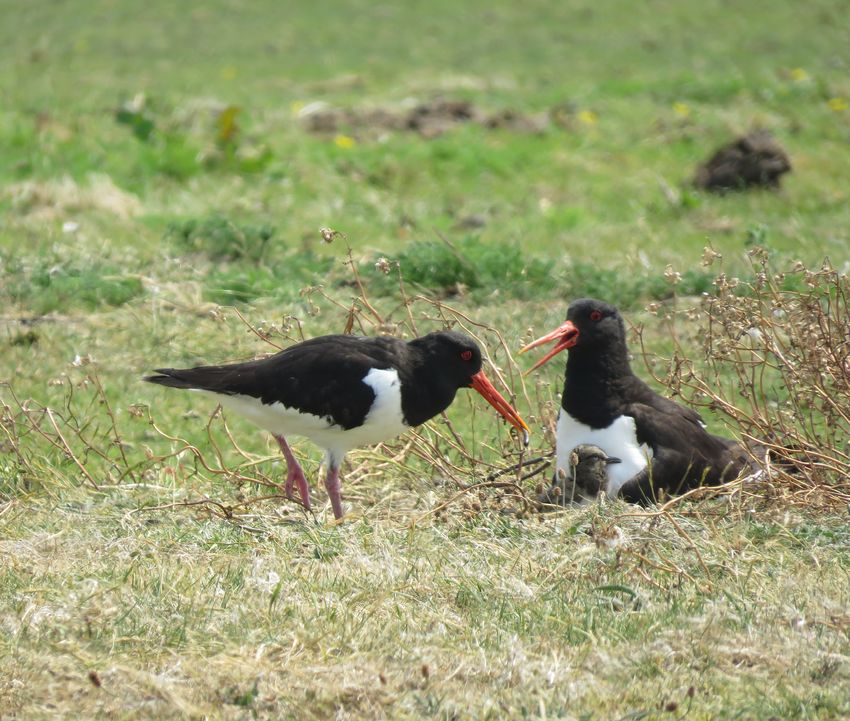
3.3 Oystercatcher 17
3.4 Avocet 23
3.5 Black-headed Gull 26
3.6 Lesser Black-backed Gull 29
3.7 Herring Gull 31
3.8 Sandwich Tern 34
3.9 Common Tern 35
3.10 Arctic Tern 39
4. Conclusion and discussion 41
5. Recommendations 45
6. Acknowledgements 47
7. References 48
Annex 1 - List of sites 51
Annex 2 - Field workers 52
Breeding success in the Wadden Sea 2009-2012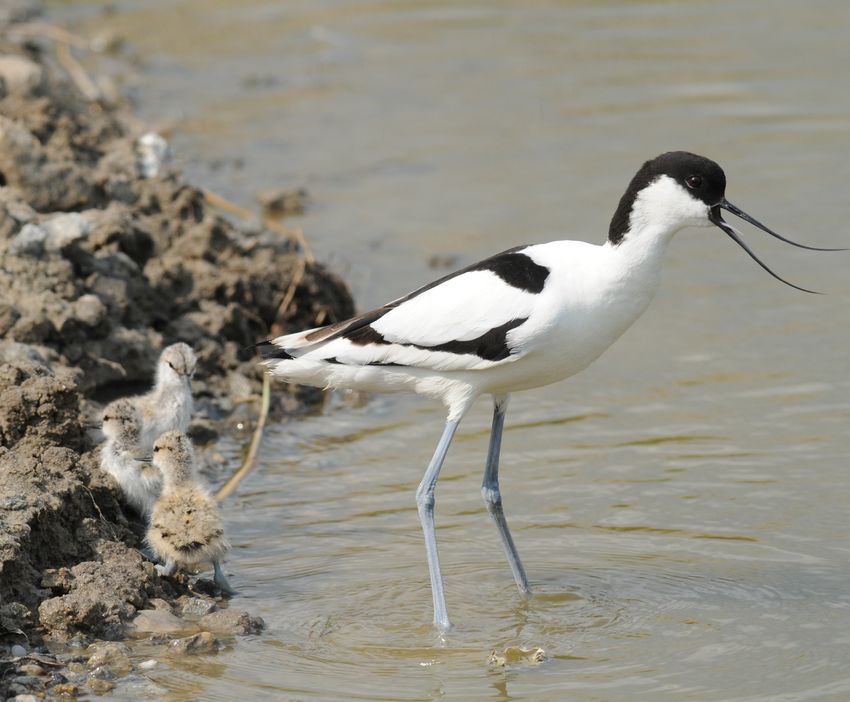
5

                                Summary - Resumé - Zusammenfassung - Samenvatting

                                 Summary             most crucial limitation in the Herring Gull. Also
                                                     Black-headed Gull is faced with a lower annual
Acknowledging that “breeding success” would
                                                     survival. These trilateral findings are very similar
be a crucial parameter to collect in order to in-
                                                     to earlier assessments made for the Dutch sec-
crease the understanding of important processes
                                                     tion of the Wadden Sea.
in breeding birds the Wadden Sea, a TMAP-
                                                        For several species it was possible to identify
breeding success monitoring programme was
                                                     the contribution of the hatching success to the
initiated in 2009 and fully implemented in 2010.
                                                     breeding success. Generally, the species were
It was partly based on experiences collected
                                                     performing better in the incubation period than
during a pilot project in the 1990s. The breed-
                                                     in the chick-rearing phase. Predation and flood-
ing success monitoring programme is focusing
                                                     ing, as a result of storm tides during the breeding
on the number of fledged young per breeding
                                                     season, are among the most frequent causes for
pair in a number of study plots. Ten character-
                                                     failure.
istic breeding species in the Wadden Sea were
selected for the programme, representing differ-
ent habitats and feeding strategies: Spoonbill,                                            Resumé
Eider, Oystercatcher, Avocet, Black-headed Gull,     I anerkendelse af at ynglesucces ville være et
Lesser Black-backed Gull, Herring Gull, Sandwich     essentielt parameter at indsamle for at øge for-
Tern, Common Tern and Arctic Tern. Although not      ståelsen for vigtige processer i Vadehavet, blev
achieving the aimed full coverage of monitoring      der iværksat et overvågningsprogram for yngle-
breeding success of the ten selected species in      succes i 2009, og det kørte i fuldt omfang fra
each of 15 designated subregions of the Wad-         2010. Med ynglesucces menes der antal flyve-
den Sea, breeding success was assessed in a to-      dygtige unger per ynglepar i en række undersø-
tal of 273 species-sites-years in 2009-2012, and     gelsesområder. Der blev udvalgt ti karakteristiske
additionally the hatching success was assessed       ynglefuglearter i Vadehavet, der repræsenterer
in 161 species-sites-years, with a large overlap     forskellige habitater og fødestrategier: Ske-
with the breeding success assessments. Hence,        stork, Ederfugl, Strandskade, Klyde, Hættemåge,
they provide an overall good sample of breeding      Sildemåge, Sølvmåge, Splitterne, Fjordterne og
success within the international Wadden Sea.         Havterne. Selvom det ikke lykkedes at opnå fuld
    The monitoring of breeding success in the        dækning med overvågning af alle arterne i hver
Wadden Sea 2009-2012 provided a picture of           af 15 udpegede underregioner i Vadehavet, blev
that breeding success of the ten selected species,   ynglesuccesen undersøgt i i alt 273 ”artslokali-
despite being quite variable, was insufficient to    tetsår” i 2009-2012, og desuden blev klæknings-
keep populations in balance in several of the        succesen undersøgt i 161 ”artslokalitetsår” med
species. In three of the species – Oystercatcher,    et stort overlap med arter, lokaliteter og år, hvor
Avocet and Arctic Tern – the reproduction was        ynglesuccesen blev undersøgt.
so poor, that they at present seem to have no            Overvågning af ynglesucces i Vadehavet
chance to reproduce themselves, and in an ad-        2009-2012 viste ret tydeligt, at selvom resulta-
ditional four species – Black-headed Gull, Lesser    terne varierede noget fra sted til sted og fra år
Black-backed Gull, Herring Gull and Common           til år, var der flere arter, hvor ynglesuccesen var
Tern – the found breeding success values are so      så lav, at der ikke blev produceret tilstrækkeligt
fairly low that some or all of these species may     med unger til at holde bestandene i balance. For
also not reproduce sufficiently to balance mor-      tre arter – Strandskade, Klyde og Havterne – var
tality. When comparing breeding success with         reproduktionen så ringe, at de i den nuværende
the recent trends in the ten species, it can be      situation ikke synes at have nogen chance for
seen that the three species with the poorest re-     at reproducere sig selv. For yderligere fire arter
production all had a negative population trend       – Hættemåge, Sildemåge, Sølvmåge og Fjord-
recently. Low breeding success is very likely an     terne – var værdierne for deres ynglesucces så
important driver of the observed population de-      lave, at nogle af eller alle disse arter heller ikke
clines. Also two of the four species with fairly     får tilstrækkelig mange flyvefærdige unger til, at
low breeding success values in this programme        det kan balancere dødeligheden blandt de voksne
– Herring Gull and Common Tern – declined re-        fugle. Når ynglesuccesen sammenlignes med den
cently, and in these species as well low breed-      aktuelle bestandsudvikling i Vadehavet for de ti
ing success may be an important, or at least a       arter, ses det, at de tre arter med den ringeste
contributing driver of the declines, although a      ynglesucces alle har en negativ bestandsudvik-
population study found the survival to be the        ling, og sandsynligvis er den dårlige ynglesucces

                                                                                                 Breeding success in the Wadden Sea 2009-2012
6

                                   en vigtig årsag til, at arterne går tilbage. Også     we, Silbermöwe und Flussseeschwalbe erzielen
                                   to af de fire arter med ret lave værdier for deres    generell ebenfalls einen zu geringen Bruterfolg
                                   ynglesucces i dette program, sølvmåge og fjord-       (aber mit örtlich positive Ausnahmen). Auffällig
                                   terne, er gået tilbage i Vadehavet de senere år, og   ist, dass die Arten mit dem schlechtesten Bru-
                                   også for disse arter kan hovedårsagen til tilbage-    terfolg auch die Arten mit stark rückläufigen
                                   gangen være dårlig ynglesucces, eller den kan i       Beständen im internationalen Wattenmeer sind,
                                   hvert fald være en medvirkende årsag. Et nyere        wie Austernfischer, Säbelschnäbler und Küsten-
                                   populationsstudie af sølvmåge i Holland viser         seeschwalbe. Somit ist der schlechte Bruterfolg
                                   dog, at det her er de voksne fugles lave overlevel-   ein wesentlicher Grund für die beobachteten
                                   se, der er den vigtigste årsag til tilbagegangen.     Bestandsabnahmen. Literaturdaten zeigen, dass
                                      For flere af arterne var det muligt at udskille    sich bei Lachmöwe und Silbermöwe auch die
                                   klækningssuccesen og vurdere dennes betydning         jährlichen Überlebensraten verringert haben. Die
                                   for den samlede ynglesucces. Generelt klarede         in diesem Bericht präsentierten Daten decken
                                   arterne sig bedre i rugetiden end i ungeførings-      sich gut mit bereits publizierten Ergebnissen aus
                                   tiden.                                                dem niederländischen Wattenmeer ab (wo be-
                                                                                         reits seit 2005 Bruterfolgsdaten erhoben werden,
                                                     Zusammenfassung                     und 2014 eine umfassende Analyse von sowohl
                                                                                         Bruterfolg als auch Überlebensraten erfolgte).
                                   Der Parameter „Bruterfolg“ wurde 2009/2010
                                                                                             Für einige Arten konnte die Analyse auch der
                                   in das ‚Trilateral Monitoring and Assessment
                                                                                         Grund für den schlechten Bruterfolg nennen.
                                   Program‘ (TMAP) aufgenommen und ist eine
                                                                                         Generell waren die Vögel in der Nestphase er-
                                   wichtige Ergänzung zur bereits vorhandenen
                                                                                         folgreicher als in der Kükenphase, obwohl es Un-
                                   Überwachung der Bestände und Verbreitung von
                                                                                         terschiede in den Regionen gibt (an der Festland-
                                   Brutvögeln im Wattenmeer. Bruterfolgsdaten
                                                                                         küste litten mehr Nester unter Räubern als auf
                                   helfen, die Änderungen der Bestände zu verste-
                                                                                         den Inseln, wo ein engeres Spektrum an Nesträu-
                                   hen. Da die meisten Küstenvögel zu langlebigen
                                                                                         bern (Prädatoren) beheimatet ist). Prädation und
                                   Arten gehören, ermöglicht das Messen des Bru-
                                                                                         Überflutungen durch Sturmtiden waren die am
                                   terfolgs eine erheblich zeitnähere Bewertung der
                                                                                         häufigsten festgestellten Ursachen für den ge-
                                   Bestände („Early Warning“) als jährliche Zählun-
                                                                                         ringen Bruterfolg.
                                   gen bei denen sich z.B. eine Abnahme erst viel
                                   später zeigt. Die Arbeitsweise der aktuellen Bru-
                                   terfolgsüberwachung basiert auf Erfahrungen                                     Samenvatting
                                   aus einem Pilotproject der 1990-ziger Jahre. Das      In 2009-2010 werd de parameter “broedsuc-
                                   Ziel ist den Bruterfolg als Anzahl der flüggen Kü-    ces” toegevoegd aan het trilaterale monitoring
                                   ken pro Brutpaar zu erfassen. Dabei werden 10         programma van TMAP. Het vormt een belang-
                                   Vogelarten erfasst: Löffler, Eiderente, Austernfi-    rijke aanvulling op de bestaande monitoring van
                                   scher, Säbelschnäbler, Lachmöwe, Heringsmöwe,         aantallen en verspreiding omdat met behulp van
                                   Silbermöwe, Brandseeschwalbe, Flussseeschwal-         informatie over broedsucces ook achterliggende
                                   be und Küstenseeschwalbe. Auch wenn aus fi-           oorzaken voor aantalsveranderingen kunnen wor-
                                   nanziellen und praktischen Gründen weniger            den onderzocht. Bovendien fungeert het als een
                                   Geländetätigkeiten als geplant durchgeführt           “early-warning” voor op stapel staande aantals-
                                   wurden, ist insgesamt doch einen guten Über-          veranderingen, aangezien de kustbroedvogels die
                                   blick des Bruterfolgs erzielt worden. Insgesamt       in TMAP worden gevolgd doorgaans langlevende
                                   wurden 273 Datensätze zu Brut- und 161 Da-            soorten zijn, en slechte broedjaren pas jaren later
                                   tensätze zu Schlupferfolg erhoben, die sich aus       kunnen doorwerken in de aantallen. Voor de op-
                                   der Anzahl der Arten, Gebiete und Jahre ergeben.      zet van het nieuwe meetprogramma kon gebruik
                                   Darüber hinaus wurden Daten erhoben die nicht         worden gemaakt van eerdere trilaterale ervarin-
                                   rechtzeitig für diesen Bericht bereitgestellt wer-    gen in de jaren negentig. Het zwaartepunt ligt op
                                   den konnten.                                          het vaststellen van het uiteindelijke broedsucces
                                      Trotz erheblicher Fluktuationen in den Er-         (aantal vliegvlugge jongen per paar). Er worden
                                   gebnissen aus den Jahren 2009-2012 zeigt sich,        gegevens van tien soorten verzameld, elk repre-
                                   dass aktuell nur wenige Arten im internationalen      sentatief voor een bepaalde voedselgroep of een
                                   Wattenmeer erfolgreich brüten. Vornehmlich bei        bepaald broedhabitat: Lepelaar, Eider, Scholek-
                                   Austernfischer, Säbelschnäbler und Küstensee-         ster, Kluut, Kokmeeuw, Kleine Mantelmeeuw, Zil-
                                   schwalbe ist der Bruterfolg viel zu niedrig, um       vermeeuw, Grote Stern, Visdief en Noordse Stern.
                                   den Bestand zu erhalten. Lachmöwe, Heringsmö-         Hoewel de meet-inspanning niet overal de eerder

Breeding success in the Wadden Sea 2009-2012
7
voorgestelde dekking benaderde (zowel vanwege gen. Opvallend is dat de soorten met slechte
financiële als praktische beperkingen), geven de broedresultaten samenvallen met de soorten die
in dit rapport gepresenteerde gegevens voor het de sterkste afname in broedaantallen laten zien.
eerst goed inzicht in het broedsucces van kust- Het uitblijven van voldoende broedsucces kan bij
broedvogels in de internationale Waddenzee. De de meeste soorten dan ook worden gezien als
gegevens zijn gebaseerd op 273 soort x gebied x een belangrijke drijfveer voor de waargenomen
jaar combinaties gedurende de jaren 2009-2012 aantalsveranderingen. Literatuurgegevens laten
(Nederlandse Waddenzee 2010-11). Het nestsuc- zien dat Zilvermeeuw en Kokmeeuw ook worden
ces werd vastgelegd voor 161 soort x gebied x geconfronteerd met lagere overlevingscijfers. De
jaar combinaties. Deze cijfers onderschatten de situatie voor de internationale Waddenzee komt
werkelijke veldinspanning nog iets, omdat niet goed overeen met eerdere analyses die voor de
alle gegevens tijdig beschikbaar waren voor op- Nederlandse Waddenzee werden gedaan (en die
name in deze rapportage. zowel betrekking hadden op analyse van broed-
Hoewel de variatie aanzienlijk is, komt uit succes als jaarlijkse overleving).
de gegevens verzameld in 2009-2012 een beeld Voor een aantal soorten kon ook de reden van
naar voren dat veel soorten te weinig jongen mislukken worden achterhaald. In het algemeen
produceren om de populatie op peil te houden. deden soorten het gedurende de nestfase beter
Voor drie soorten is het broedsucces ver onder dan in de jongenfase, maar dit kan verschillen
de maat: Scholekster, Kluut en Noordse Stern. per gebied (doorgaans meer mislukte nesten
Kokmeeuw, Kleine Mantelmeeuw, Zilvermeeuw langs vastelandskust door groter predatierisico).
en Visdief hadden eveneens slechte reproduc- Predatie en overstromingen behoorden tot de
tiecijfers, zij het plaatselijk met uitzonderin- meest voorkomende oorzaken voor mislukking.
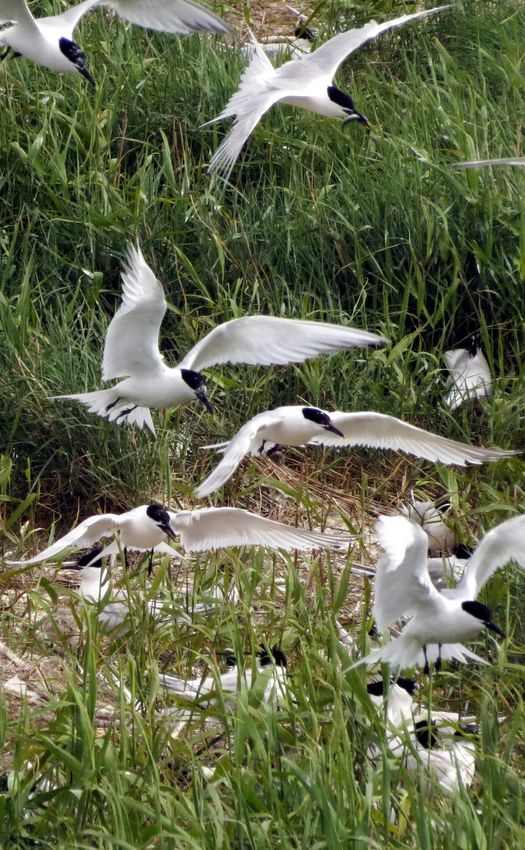
Arctic Tern, Norderoog, Schleswig-Holstein. Photo: B. Hälterlein
Breeding success in the Wadden Sea 2009-20128
Spoonbills, Vlieland, The Netherlands. Photo: Peter de Boer
Eider females with 2-3 weeks old ducklings at high tide, Vlieland, The Netherlands. Photo: Peter de Boer
Breeding success in the Wadden Sea 2009-20129
1. Introduction and background
Since 1991, breeding bird surveys in the Inter- insight in demographic processes that influence
national Wadden Sea have been carried out as population trends in Wadden Sea breeding birds,
part of the Trilateral Monitoring and Assessment especially when also linked to ringing and sur-
Program (TMAP). They have proven to be a pow- vival data (‘Integrated Population Monitoring’;
erful tool to assess status, distribution and popu- Greenwood et al. 1993; Thomas et al. 1995; van
lation changes in breeding birds in the Wadden der Jeugd et al. 2014).
Sea (e.g. Koffijberg et al. 2006; Koffijberg et al. In addition, assessment of the conservation
2015b). This is not only relevant with respect to status of birds, as requested by the EU-Bird Di-
local conservation and management issues, like rective, has been added as an aim, since a fa-
evaluation of targets in the trilateral Wadden vourable conservation status has become a guid-
Sea Plan, but the monitoring data also provide ing principle for management of bird populations
the necessary input for implementation of the in the Wadden Sea. To summarize, the targets
EU Birds- and Habitats Directives and recently that monitoring of breeding success should ad-
also the Marine Strategy Framework Directive dress are:
(MSFD). The breeding bird monitoring scheme 1. Evaluate favourable conservation status re-
is supported by numerous NGOs, governmental quested by the EU Bird Directive;
agencies and volunteer and professional bird 2. Evaluate the target ‘natural breeding success’
counters, which are responsible for coordination in the Wadden Sea Plan (1997);
and fieldwork in Denmark, Schleswig-Holstein, 3. Provide an ‘early-warning’ system to detect
Niedersachsen/Hamburg and The Netherlands. changes in the Wadden Sea ecosystem;
Results of the surveys are published annually as 4. Explain observed trends in breeding bird num-
Wadden Sea Ecosystem and reviewed regularly in bers.
the Quality Status reports.
Due to the focus on distribution and trends, Furthermore, a monitoring scheme for breed-
however, backgrounds for population changes ing success is beneficial to the assessment of the
often remain unknown, and links with manage- existing parameter ‘contaminants in bird eggs’
ment issues weak. Several breeding birds that as there is a more direct link between contami-
currently experience declines in the Wadden Sea nants and breeding performance than between
are also supposed to have a poor breeding suc- contaminants and trends in numbers (Becker et
cess (de Boer et al. 2007; Koffijberg et al. 2010), al. 1997; 1998). Thus, inclusion of breeding suc-
but trilateral data to assess its impact are scant. cess in TMAP does also support other monitoring
Most of the species dealt with in the trilateral schemes than just birds.
monitoring scheme are long-lived coastal breed- This report provides a first baseline review of
ing birds and will therefore show a delayed re- the collected breeding success data in the inter-
sponse to deteriorating environmental condi- national Wadden Sea in 2009-2012. Its aim is to
tions or human impact. The parameter ‘breeding assess the reproductive status of the 10 selected
success’ performs much better as an early-warn- species, by presenting trilateral and national data
ing system to detect changes in the ecosystem on nest success and reproductive output (number
or assess human impact, since it is more directly of fledged chicks/pair). For some species, specific
linked with changing conditions in the environ- long-term data, derived from national reports of
ment. Moreover, evaluation of the target ‘natural national research programmes have been includ-
breeding success’, as addressed in the Wadden ed to put the data collected recently in a long-
Sea Plan, is not possible with monitoring of only term perspective. Finally, some recommendations
population size and distribution. Hence, ‘breed- are made regarding the organisation and set-up
ing success’ has been recognised as an important of the monitoring scheme.
gap in the current monitoring in the Wadden Sea
and has been proposed earlier to be included in
TMAP, following a pilot project in 1996-97 (Exo
et al. 1996; Thyen et al. 1998; de Jong et al. 1999;
Essink et al. 2005). As part of a revision of TMAP,
it has been decided that from 2010 onwards,
breeding success will be included in TMAP, and
monitored for a selection of ten species. Moni-
toring of breeding success will enhance the ex-
isting census work on breeding birds. It will give
Breeding success in the Wadden Sea 2009-201210
2. Methods
Selection of species Selection of study sites and sample
The current breeding bird monitoring scheme fo- sizes
cuses on 35 characteristic species in the Wadden In order to aim for representativity the Wadden
Sea. Sea is subdivided into 7 island subregions and 8
However, to fulfil the aims described in chap- mainland subregions, and within each subregion
ter 1, it was not regarded necessary to include all it is intended to select a network of study sites
these species in a breeding success monitoring that cover those of the ten programme species
scheme. Preferably, a selection of species to be found in that subregion. For statistical reasons it
monitored for breeding success should include is aimed at achieving a sample of 60-80 clutches
a subset of species that can be used as indica- (or breeding pairs) in each subregion, wherever
tors for different habitats and feeding strate- this is possible. The subregions are the same as
gies. During the pilot project in 1996-97, JMBB those recently used to present trends within the
agreed on a list of six target species that were Wadden Sea (Koffijberg et al. 2015a).
assumed to be suitable for monitoring of breed-
ing success and match the aims of the project Field work
(Exo et al. 1996): Oystercatcher, Avocet, Red- Breeding success as it is understood within the
shank, Black-headed Gull, Herring Gull and Com- framework of TMAP concentrates on the suc-
mon Tern. In the evaluation of the pilot project, cess of breeding birds in raising their offspring
the monitoring of Redshank was considered too until fledging (BOX 1). Hence, the target value
time consuming, and that species was skipped. of monitoring breeding success is the number of
Based on the experience from a monitoring pro- fledged chicks per pair, for a given species in a
gramme for breeding success in the Dutch part given study site. For this purpose, fieldwork fo-
of the Wadden Sea (Willems et al. 2005) a fur- cuses on the assessment of two parameters:
ther five species were added to the programme. • Determine hatching success of a number of
The ten programme species which were finally clutches by following their fate over the incu-
included are: bation period;
• Spoonbill, Platalea leucorodia • Determine breeding success by following the
• Eider, Somateria mollissima hatched chicks until fledging and relate the
• Oystercatcher, Haematopus ostralegus number of fledged chicks to the number of
• Avocet, Recurvirostra avosetta breeding pairs.
• Black-headed Gull, Chroicocephalus ridibundus In Spoonbill, and in some cases in Eider, as-
• Lesser Black-backed Gull, Larus fuscus sessment of hatching success is not carried out
• Herring Gull, Larus argentatus for different reasons (risk of disturbance, practi-
• Sandwich Tern, Sterna sandvicensis cal difficulties). Inclusion of hatching success in
• Common Tern, Sterna hirundo other species is important as it gives insight in
• Arctic Tern, Sterna paradisaea the backgrounds for failure like flooding or pre-
dation rate (Tab. 1).
Tab. 1:
Suitable methods for assess- Species Study of Study of Method ‘O’ Method ‘R’ Method ‘F’
ment of breeding success hatching breeding (observation) (mark and (fencing)
(see Koffijberg et al. 2011 for success succes recapture)
details).
Spoonbill x x
Eider x x
Oystercatcher x x x x
Avocet x x x
Black-headed Gull x x x
Lesser Black-backed Gull x x x
Herring Gull x x x
Sandwich Tern x x x
Common Tern x x x
Arctic Tern x x x
Breeding success in the Wadden Sea 2009-201211
In order to facilitate consistency in data collec- Breeding success
tion, trilateral monitoring guidelines were elabo- Except Spoonbill, all species monitored in this
rated in 2010 and revised in 2011 (Koffijberg et scheme are precocial, and assessment of breed-
al. 2011). They are still provisional and will be fi- ing success is therefore not very straightforward.
nalised with the experiences collected in the first Three different methods have been used: ‘O’ for
years of the programme, especially with regard observations of chicks, juveniles and families, ‘R’
to mark and recapture techniques in colonial for capture and marking chicks and later recap-
breeding birds. tures or resighting of these and ‘F’ for fencing ei-
ther of one clutch or of groups of clutches. Table
Hatching success 1 lists appropriate methods to use for the differ-
Nests or egg clutches were searched for dur- ent species, as proposed in the trilateral manual.
ing the entire nesting season in order to attain
realistic values for hatching. The nesting period Disturbance
starts mid April in several species and lasts until Fieldwork regarding monitoring breeding success
early (several species) or mid July (Oystercatch- poses a potential risk of serious disturbance to
er). The nests or egg clutches were marked indi- the breeding birds. In order to avoid such dis-
vidually and were controlled approximately once turbance, the written guidelines have included
a week until they hatched or got lost. If possible, codes of conduct like listing in which situa-
causes of failure were recorded. tions disturbance should be avoided, limitations
Two different ways were used to monitor and of time spent in the breeding areas etc. These
to present hatching success data: the “apparent guidelines are prepared on methods, which have
hatching success” and the “calculated hatching been tested extensively and have been optimized
probability” (see Box 1), and the method used to in order to cause the lowest possible disturbance
calculate hatching success will be indicated and effect.
presented in this report.
BOX 1: Terminology
Breeding success and fledging success:
In technical reports and scientific literature the terms ‘breeding success’ and ‘fledging success’ are
regularly used indiscriminately to describe either 1) the proportion of hatched chicks that fledge or
2) the number of chicks per pair that fledge or 3) the number of chicks per initiated nest that fledge.
Furthermore, the term breeding success is sometimes used also in cases, when only data on hatching
success exist.
In this review, the terms are consistently used in the following way:
• Breeding success: the number of fledged chicks per pair
• Fledging success: the proportion of hatched chicks that fledge
Hatching success and nest success:
In this review, hatching success and nest success is used indiscriminately for the same: The proportion
of nests where at least one chick hatch.
Two different ways have been used to monitor and present the hatching success:
• Apparent hatching success (or classical hatching success): The proportion of found nests, which
eventually hatch
• Calculated hatching probability (Mayfield method): The probable hatching success of the con-
trolled nests calculated from the average daily survival of a nest
Many studies have looked at the advantages and limitations by the use of the two methods (e. g.
Johnson & Shaffer 1990). Generally, the “apparent hatching success” is working better, when most
nest/clutch mortality is taking place during catastrophic events (typically flooding or predation of
an entire colony), whereas the “Mayfield method” is performing better, when nest/clutch mortality is
relatively constant over the season.
Breeding success content:
In conclusion, three elements together generate the breeding success: hatching success, fledging suc-
cess and replacement rate. None of the study species produce more than one successful clutch per year.
Breeding success in the Wadden Sea 2009-201212
3. Breeding success of coastal breeding birds in the Wadden Sea 2009-2012
The extent of the breeding success monitoring in the table. Data from the Dutch Wadden Sea
activities in 2009-2012 is listed in Tab. 2, and the only refer to 2010-11. National reports which
study sites are demarcated on the map in Fig- cover the 2009-2012 period have been published
ure 1. For preparation of this report, not all data for the Dutch Wadden Sea (van Kleunen et al.
were available in time, so the actual number of 2012; Koffijberg et al. 2015b) and for Denmark
sites monitored is somewhat larger than shown (Bregnballe et al. 2015).
Fig. 1:
Overview of sample sites 69
where breeding succes in the
Wadden Sea was monitored.
Regions and Sites of the
DK Danish
Site names and location are TMAP Breeding Success Monitoring Wadden Sea
68
listed in Annex 1.
62
67
65 66
61
60 63 58
59 56 64 57
55
SH Nordfriesland
54
53
SH Elbe Estuary
52
51
Nds Jade-Weser 50
Estuaries 49
Nds East-Friesland 39
40
NL Eastern 37 38 42 41
44
NL Western Wadden Sea 35 36 43
19 20 45
Wadden Sea 11 14 1516
17 21
46
47
18 26 28 29 48
10 13
78 25 27 30
9 12 33
5 24 31
6 32
34
3 4 NL/NDS Ems-Dollart Estuary
2
1 23
22
Tab. 2: Species Country Hatching success Breeding success
Monitoring activities 2009-
2009 2010 2011 2012 2009 2010 2011 2012
2012. Given is the number
of monitoring sites for each Spoonbill Netherlands 0 0 0 0 0 3 2 1
species, where data on nest Spoonbill Germany Niedersachsen 0 0 0 0 0 0 1 0
success or breeding success Spoonbill Germany Schleswig-Holstein 0 0 0 0 3 4 4 4
were available for this Eider Netherlands 0 2 2 1 0 7 5 4
report. The breeding success
Oystercatcher Netherlands 0 8 7 4 0 14 9 10
monitoring scheme was fully
implemented in 2010. Oystercatcher Germany Niedersachsen 3 6 6 3 3 3 3 1
Oystercatcher Germany Schleswig-Holstein 2 2 3 5 2 2 3 5
Oystercatcher Denmark 0 1 1 0 0 1 1 0
Avocet Netherlands 0 2 1 2 0 6 5 5
Avocet Germany Niedersachsen 0 2 3 2 0 2 3 2
Avocet Germany Schleswig-Holstein 2 2 1 1 4 4 3 3
Black-headed Gull Netherlands 0 2 2 1 0 8 7 4
Black-headed Gull Germany Niedersachsen 0 1 2 1 0 1 2 1
Black-headed Gull Germany Schleswig-Holstein 0 0 1 3 0 0 1 3
Lesser Black-backed Gull Netherlands 0 3 3 3 0 4 2 0
Lesser Black-backed Gull Germany Niedersachsen 0 1 2 2 0 1 2 2
Lesser Black-backed Gull Germany Schleswig-Holstein 0 0 3 2 0 1 4 2
Lesser Black-backed Gull Denmark 1 0 0 0 1 1 1 1
Breeding success in the Wadden Sea 2009-201213
Species Country Hatching success Breeding success Tab. 2 continuation.
2009 2010 2011 2012 2009 2010 2011 2012
Herring Gull Netherlands 0 3 2 3 0 4 1 0
Herring Gull Germany Niedersachsen 0 1 2 2 0 1 2 2
Herring Gull Germany Schleswig-Holstein 0 0 3 2 0 1 4 2
Herring Gull Denmark 1 0 0 0 1 1 1 1
Lesser Black-backed/ Germany Schleswig-Holstein 0 1 1 0 0 0 0 0
Herring Gull combined
Sandwich Tern Netherlands 0 0 0 0 0 3 3 3
Sandwich Tern Denmark 1 0 0 0 0 0 0 0
Common Tern Netherlands 0 4 1 2 0 7 9 4
Common Tern Germany Niedersachsen 0 1 0 1 0 1 1 2
Common Tern Germany Schleswig-Holstein 4 1 4 3 4 3 4 3
Common Tern Denmark 1 0 0 0 0 0 0 0
Arctic Tern Netherlands 0 0 1 1 0 5 6 3
Arctic Tern Germany Schleswig-Holstein 2 0 2 2 4 2 2 2
Arctic Tern Denmark 2 0 0 0 0 0 0 0
BOX 2: Breeding success – which level is necessary to counterbalance mortality?
Breeding success is one factor out of several that determines whether a population grows, is stabile
or declines. In a closed population other determining factors are:
• adult survival
• juvenile and immature survival
• age at first breeding
In an open population, also dispersal has an effect (emigration and immigration) on growth in a given
(sub)population.
In order to be able to calculate the necessary breeding success for a given species in the Wadden Sea,
data shall be available on all the other relevant factors, including dispersal. With a changing environ-
ment also outside the breeding site, the various survival figures etc. may also change, which has an
effect on the sufficient level of breeding success.
As a guideline for when breeding success is estimated to be sufficient to keep a population in bal-
ance, we have used a set of reference values, used before in the Dutch Wadden Sea (van Kleunen et
al. 2010; Koffijberg & Smit 2013), based on demographic data from various population studies.
Species Demographic study value Guideline level value
Spoonbill
Eider 0.4 – 1
Oystercatcher 0.30-0.401 0.3 – 0.4
Avocet 0.5 – 1
Black-headed Gull 0.9 – 1.42 1
Lesser Black-backed Gull 0.6 – 1
Herring Gull 0.6 – 1
Sandwich Tern 0.6 – 1
Common Tern 0.75 3
0.65 – 0.75
Arctic Tern 0.4 – 1
1
Oosterbeek et al. 2006; 2 Bensch & Källander 1997, 3 Stienen et al. 2009
Relating to these values, the following terms are used in this review:
• too low breeding success: without doubt insufficient reproduction to counterbalance mortality,
i.e. below the lowest guideline reference value
• fairly low breeding success: the breeding success is around the lower end of the sufficient re-
production to counterbalance mortality. The breeding success may still be too low to maintain the
present population size
• fairly high breeding success: the breeding success value is within the estimated interval where it
is most likely sufficiently high to counterbalance mortality
• moderate breeding success: fairly low to fairly high breeding success
• high breeding success: without doubt sufficient reproduction to counterbalance mortality
Breeding success in the Wadden Sea 2009-201214
3.1 Spoonbill sive flooding (Lok et al. 2009; Overdijk 2012). In 2002-
2009, when the breeding numbers stabilized, the
breeding success was between 1 and 2 fledged young
Hatching success
per pair (Overdijk 2012), whereas in 2010-2012 within
Hatching success of Spoonbills was not monitored in this monitoring project the value fell to between 0.3
the Wadden Sea 2009-2012 as the species is consid- and 0.9. Lok et al. (2009) found in addition to the
ered too sensitive to regular nest checks. Hence only decreasing breeding success also a decreasing adult
data was available about the number of chicks fledged. survival in the Netherlands with increasing breeding
numbers and densities, and from these figures they
Breeding success predict that the steep increase in the Dutch Wadden
Breeding success was monitored in 2009-2012 in Sea will cease and the population become stable from
Schleswig-Holstein (4 colonies 4 years), the Nether- around 2020.
lands (1 colony 3 years, 1 colony 2 years, 1 colony 1 In the early 1990s, Spoonbill was only breeding in
year), and Niedersachsen (1 colony 1 year) (Table 3). the western (Dutch) part of the Wadden Sea. Subse-
In the Dutch colonies, the breeding success was quently, it expanded its distribution. In 1995 Spoon-
low to moderate, whereas it was high in Niedersach- bills started breeding in Niedersachsen, in 2000 for
sen and almost consistently very high in Schleswig- the first time in Schleswig-Holstein and in 2007 also
Holstein (Table 3). The un-weighted mean in the Neth- in Denmark (Rasmussen et al. 2000, Koffijberg et al.
erlands was 0.46 fledged young per pair, 1.32 in the 2010a). The observed very high breeding success in
one studied plot and year in Niedersachsen, and the the four studied Schleswig-Holstein colonies, still in
mean was 2.05 fledged young per pair in Schleswig- their establishment phase, is in line with breeding suc-
Holstein. cess values observed at the Schiermonnikoog colonies
In the colonies at Schiermonnikoog, the breeding the first ten years after the establishment. The higher
success has been studied ever since the Spoonbill es- rate of success in the eastern and northern part of
tablished a breeding population on the island in 1992. the Wadden Sea also explains that the species is still
In the establishment period with a strong population thriving in this part, whereas the population growth
increase 1992-2002, the breeding success was con- has levelled-off in the oldest colonies in the Dutch
sistently 2.0 fledged young per pair or above, except part of the Wadden Sea.
in 2001 and 2002, when the colony was hit by exten-
Tab. 3: Country Sitename Habitat Year Sample Breeding Main cause Assessment method
Breeding success of Spoon- size success of chick
bill in the Wadden Sea (juveniles mortality
2009-2012. per pair)
NL Schiermonnikoog, saltmarsh 2010 192 0.3 O Observation
Oosterkwelder
NL Schiermonnikoog, saltmarsh 2011 231 0.42 O Observation
Oosterkwelder
NL Schiermonnikoog, beach 2012 210 0.9 O Observation
Oosterkwelder & Westerplas
NL Rottumerplaat outer sand 2010 33 0.45 Flooding O Observation
NL Rottumerplaat outer sand 2011 35 0.71 O Observation
NL Balgzand saltmarsh 2010 30 0 Predation O Observation
DE-NDS Mellum dunes 2011 60 1.32 O Observation
DE-SH Trischen saltmarsh 2009 25 2.7 O Observation
DE-SH Trischen saltmarsh 2010 41 1.7 O Observation
DE-SH Trischen saltmarsh 2011 45 2.04 O Observation
DE-SH Trischen saltmarsh 2012 45 2.63 O Observation
DE-SH Südfall saltmarsh 2010 6 2.26 O Observation
DE-SH Südfall saltmarsh 2011 13 1.46 O Observation
DE-SH Südfall saltmarsh 2012 14 2.61 O Observation
DE-SH Oland saltmarsh 2009 44 1.98 O Observation
DE-SH Oland saltmarsh 2010 54 1.3 O Observation
DE-SH Oland saltmarsh 2011 62 2.08 O Observation
DE-SH Oland saltmarsh 2012 57 1.95 O Observation
DE-SH Föhr saltmarsh 2009 6 1.28 O Observation
DE-SH Föhr saltmarsh 2010 8 1.6 O Observation
DE-SH Föhr saltmarsh 2011 14 2.36 O Observation
DE-SH Föhr saltmarsh 2012 11 2.8 O Observation
Breeding success in the Wadden Sea 2009-201215
3.2 Eider ences in population size (Koffijberg et al. 2015b).
Nothing is known about the causes of failures in
chick survival.
Hatching success
On the island of Vlieland the breeding success
Hatching success is not an official TMAP moni- has been followed in a large number of years be-
toring parameter but it was studied on Vlieland tween 1944 and 2011 (BOX 3 Figure 2). In three
in the Netherlands in 2010-2012 (Tab. 4a and of the 40 years (8%) the value was above 1.0
b), as part of a specific population study on this young per pair, in another six (including the pro-
species. The hatching success was moderate to gramme year 2010; Table 5) it was between 0.4
fairly high, and the most important cause of egg and 1.0, whereas in five (21%) it was between
failures was predation, partly due to a deliberate 0.25 and 0.4. In almost two out of three years the
introduction of Red Fox to the island. In addi- fledging success was below 0.25. In 1944-2010
tion, Brown rat is an important predator. In other there were two periods with strong increases and
years in the past, breeding females have also two periods with strong decreases on Vlieland
faced a poor condition at the start of the breed- (van Kleunen et al. 2012).
ing season, possibly also affecting nest attend- Even if the data presented here are only from
ance and increasing the risk of nest-loss (de Boer one country, they provide a sample of the larg-
et al. 2007), but this an issue was not apparent in est breeding population in the Wadden Sea, and
2010-2012 (P. de Boer/Sovon). therefore are considered reflecting the situation
in the international Wadden Sea. They may not
Breeding success be representative, however, as conditions are
Breeding success was monitored on several Dutch assumed to be very different in other parts of
islands 2010-2012, by carrying out a simultane- the Wadden Sea, as is also suggested by differ-
ous count of chicks in early July (along with an ent trends in breeding numbers (Koffijberg et al.
assessment of the number of breeding females 2015a). Over the entire Wadden Sea, there has
at each island during the breeding season) (Table been a decline since 1991, mainly occurring af-
5). The observed breeding success values were ter the late 1990s. Ringing data from the Dutch
very variable from 0 to 2.17. In the small popula- Wadden Sea have pointed out that adult survival
tion on Texel the fledging success was consist- is very likely to affect population changes, with
ently high with an un-weighted mean of 1.46 periodical occurrence of so-called kill-years due
young per pair. The un-weighted mean from all to food shortage in winter and spring (Cam-
Dutch Wadden Sea islands was 0.60 young per phuysen et al. 2002; van der Jeugd et al. 2014).
pair. An analysis of data from the Dutch Wadden Food shortage in winter, may also lead to poor
Sea during 2005-2013 showed that, apart from breeding condition in breeding females (so-
2005, the number of chicks remained below 0.50 called carry-over effect), as has been observed
pairs in all years without a clear trend when us- on Vlieland in some years (see above).
ing weighted figures, accounting e.g. for differ-
Country Sitename Habitat Year Sample Apparent hatching suc- Calculated hatching Tab. 4a:
size cess (%) probability Hatching success of Eider
in the Wadden Sea 2009-
NL Vlieland, Bomenland dunes 2010 15 66 0.85
2012.
NL Vlieland, Bomenland dunes 2010 25 40 0.10
NL Vlieland, Bomenland dunes 2012 30 56 0.28
NL Vlieland, Kroon’s Polders saltmarsh 2011 20 70 0.35
NL Vlieland, Kroon’s Polders saltmarsh 2011 29 65 0.45
Country Sitename Year Cause of egg losses in % Tab. 4b:
Preda- Flooding Tram- Unfa- Food Other Un- Hatching success of Eider
tion pling vourable shortage factors known in the Wadden Sea 2009-
weather 2012. Causes of egg losses.
NL Vlieland, Bomenland 2010 60 0 0 0 0 20 20
NL Vlieland, Bomenland 2010 84 0 0 0 0 5 11
NL Vlieland, Bomenland 2012 67 0 0 0 0 33 0
NL Vlieland, Kroon’s Polders 2011 40 0 0 0 0 0 60
NL Vlieland, Kroon’s Polders 2011 87 0 0 0 0 13 0
Breeding success in the Wadden Sea 2009-201216
Tab. 5: Country Sitename Habitat Year Sample Breeding Main cause of Assessment
Breeding success of Eider in size success chick mortality method
the Wadden Sea 2009-2012. (juveniles
per pair)
NL Texel dunes/ 2010 330 1.12 O Observation
saltmarsh
NL Texel dunes/ 2011 311 1.08 O Observation
saltmarsh
NL Texel dunes/ 2012 159 2.17 O Observation
saltmarsh
NL Vlieland dunes/ 2010 1,076 0.51 O Observation
saltmarsh
NL Vlieland dunes/ 2011 946 0.2 O Observation
saltmarsh
NL Griend outer sand 2010 78 0.67 O Observation
NL Griend outer sand 2011 65 0 various causes O Observation
NL Ameland dunes/ 2010 382 1.4 O Observation
saltmarsh
NL Ameland dunes/ 2012 538 0.2 O Observation
saltmarsh
NL Schiermonnikoog dunes/ 2010 338 0.6 O Observation
saltmarsh
NL Schiermonnikoog dunes/ 2011 165 0.76 O Observation
saltmarsh
NL Schiermonnikoog dunes/ 2012 356 0.35 O Observation
saltmarsh
NL Rottumerplaat dunes/ 2010 1,736 0.06 O Observation
saltmarsh
NL Rottumeroog & Zuiderduin outer sand 2010 175 0.07 O Observation
NL Rottumeroog & Zuiderduin outer sand 2011 353 0.09 unknown O Observation
NL Rottumeroog & Zuiderduin outer sand 2012 1,165 0.34 O Observation
BOX 3: Long term trends in breeding success in Common Eider in the Dutch Wadden Sea
The Dutch Wadden Sea supports the majority of breeding Common Eider in the international Wad-
den Sea. The population of one of the core breeding sites, the island of Vlieland, showed pronounced
fluctuations throughout the past decades (Fig. 2). After initial increases, declines were observed in
the early 1960s and early 1980s. After 2000 the population seems to subject to a structural decrease.
Scarce data on breeding success show years with high productivity in the 1940s and 1960s, but
also years with very poor breeding success accumulating after 2000. It is hypothesized that the low
reproductive output is mainly caused by poor condition of breeding females prior to breeding (van
Kleunen et al. 2012).
Fig. 2: 1.6 4,500
Trend in breeding population breeding success
(right axis) and breeding 1.4 4,000
breeding pairs
success (expressed as the
population size (breeding pairs)
breeding success (chicks / pair)
3,500
number of chicks per pair/ 1.2
female) of Common Eider
3,000
on the island of Vlieland. x 1
no data. Source: Kats 2007, 2,500
Sovon Vogelonderzoek 0.8
Nederland). 2,000
0.6
1,500
0.4
1,000
0.2 500
0 0
1944 1948 1952 1956 1960 1964 1968 1972 1976 1980 1984 1988 1992 1996 2000 2004 2008 2012
Breeding success in the Wadden Sea 2009-201217
3.3 Oystercatcher On the Wadden Sea islands, hatching success
was much more variable and often high (com-
pared to the mainland coast). The un-weighted
Hatching success
mean apparent hatching success at the 27 sites
Hatching success has been monitored at several and years was 51%. At sites where both the ap-
sites in the Netherlands, Niedersachsen and parent hatching success and the hatching prob-
Schleswig-Holstein, both on the islands and on ability is known, the apparent hatching success
the mainland coast. In Denmark hatching suc- is 15% higher, so the real hatching success was
cess was monitored at one site in two years on probably around 45% at the island sites. The
an island (Tab. 6a and b). highest hatching success was found at the three
Generally, hatching success at all sites on the sites on islands in Schleswig-Holstein, where the
mainland coast was very low, and in several cas- apparent hatching success was 74%. The appar-
es there was no hatching success at all. The only ent hatching success at the island sites in Nied-
exceptions were the two Dutch sites Biltpollen in ersachsen was 54%, in the Netherlands 44% and
Noord Friesland and the Schermpier in Delfzijl (a at the only Danish site 29%.
very long harbour pier which is de facto not re- Where the dominant cause of egg losses was
ally ‘mainland’), with hatching successes around reported, predation was by far the most common
50%. In the remaining 18 sites and years moni- cause. In 23 of the 30 instances (77%) predation
tored on the mainland coast, the un-weighted was the most important cause, in the remain-
mean of the apparent hatching success was ing 7 it was flooding. In 12 sites and years with
only 5%, and in 10 of the sites and years (56%) no or very low hatching success (18
Table 6a: Country Sitename Habitat Year Sample size Apparent Calcu-
Hatching success of Oyster- hatching lated
catcher in the Wadden Sea success hatching
2009-2012. (%) prob-
ability
NL Texel, ‘t Stoar coastal wetland 2010 1 0
NL Texel, Studiegebied ‘t Stoar/Kikkert coastal wetland 2011 4 100
NL Texel, Studiegebied ‘t Stoar/Kikkert coastal wetland 2012 2 0
NL Texel, Studiegebied De Petten coastal wetland 2011 12 46
NL Texel, Studiegebied Joost Dourleinkazerne saltmarsh 2011 21 45
NL Vlieland, Vliehors, Schelpenbank beach 2011 6 0
NL Ameland, Kwelder Ferwerd Oost-West saltmarsh 2011 19 36 0.19
NL Ameland, Buurdergrie polder 2010 75 86
NL Ameland, Buurdergrie polder 2012 72 86
NL Ameland, Nieuwlandsreid Oost saltmarsh 2010 41 39
NL Ameland, Nieuwlandsreid Oost saltmarsh 2012 16 81
NL Schiermonnikoog, Hoge Kwelder 1e Slenk saltmarsh 2010 22 22
NL Schiermonnikoog Populatiestudie Oosterkwelder saltmarsh 2010 86 36
NL Noord Friesland Buitendijks, Biltpollen saltmarsh 2010 33 60 0.51
NL Groninger Kust, Emmapolder polder 2011 27 0 0.003
NL Delfzijl, Schermpier beach 2011 26 53 0.46
NL Delfzijl, Schermpier beach 2012 24 62 0.54
DE-NDS Norderney Grohdenvorland saltmarsh 2010 150 60 0.58
DE-NDS Norderney Grohdenvorland saltmarsh 2011 129 41 0.36
DE-NDS Norderney Grohdenvorland saltmarsh 2012 112 71 0.67
DE-NDS Norderney Ostheller saltmarsh/dunes 2010 32 72 0.68
DE-NDS Norderney Ostheller saltmarsh/dunes 2011 59 66 0.60
DE-NDS Norderney Ostheller saltmarsh/dunes 2012 44 71 0.64
DE-NDS Wangerooge saltmarsh 2010 44 14 0.10
DE-NDS Wangerooge saltmarsh 2011 49 0.29
DE-NDS Mellum Süddüne dunes 2012 46 39
DE-NDS Mainland coast - Norderland saltmarsh 2009 22 0 0.001
DE-NDS Mainland coast - Norderland saltmarsh 2010 9 11 0.06
DE-NDS Mainland coast - Norderland saltmarsh 2011 6 17 0.006
DE-NDS Mainland coast - Elisabeth-Außengroden saltmarsh 2009 15 0 0.008
DE-NDS Mainland coast - Elisabeth-Außengroden saltmarsh 2010 9 0 0.007
DE-NDS Mainland coast - Elisabeth-Außengroden saltmarsh 2011 3 0 0.003
DE-NDS Mainland coast - Crildumersiel saltmarsh 2009 8 0 0.001
DE-NDS Mainland coast - Crildumersiel saltmarsh 2010 6 17 0.002
DE-NDS Mainland coast - Crildumersiel saltmarsh 2011 5 0 0.002
DE-SH Hedwigenkoog-Vorland saltmarsh 2009 140 15
DE-SH Hedwigenkoog-Vorland saltmarsh 2010 142 13
DE-SH Hedwigenkoog-Vorland saltmarsh 2011 106 11
DE-SH Hedwigenkoog-Vorland saltmarsh 2012 107 2
DE-SH Westerhever-Vorland saltmarsh 2009 45 0
DE-SH Westerhever-Vorland saltmarsh 2010 36 0
DE-SH Westerhever-Vorland saltmarsh 2011 19 0
DE-SH Westerhever-Vorland saltmarsh 2012 32 6
DE-SH Langeness, Westen saltmarsh 2012 157 61 0.66
DE-SH Langeness, Honkenswarft Ost saltmarsh 2012 55 71 0.72
DE-SH Oland saltmarsh 2011 152 80 0.69
DE-SH Oland saltmarsh 2012 162 85 0.72
DK Mandø east and northeast saltmarsh 2010 109 50 0.46
DK Mandø east and northeast saltmarsh 2011 122 7 0.06
DK Mandø east (sub-sample of above data set) saltmarsh 2010 71 42 0.37
DK Mandø east (sub-sample of above data set) saltmarsh 2011 69 1 0.02
Breeding success in the Wadden Sea 2009-201219
more dominant cause of egg losses on the main- breeding success was 0.13 young per pair at the
land sites but does also occur on the islands. five monitored sites and years, and then there
Oystercatcher is also included in the TMAP are four less accurate estimates of the breeding
parameter contaminants in bird eggs, and that success at four other sites and years of which
monitoring programme has shown that estuar- two were estimated to have a ‘very low’ and two
ies of the two rivers Elbe and Ems had the high- a ‘high’ breeding success.
est concentrations of most contaminant groups In 32 of the 56 sites and years the main cause
(Becker & Dittmann 2009). Hatching success of of breeding failure was reported, in four cases
Oystercatchers was not monitored in the Elbe es- there were two main causes. Predation was the
tuary, but at the one study plot in the Ems estu- single-most important cause of breeding failure,
ary in Delfzijl, Oystercatchers had a high hatch- in 12 cases predation of chicks, in another 11
ing success (Tab. 6a). Thus there is no indication predation of eggs. Flooding was the main cause
of a relation between areas with high concen- in 11 cases, unfavourable weather in 4, starvation
trations of contaminants and lower hatching in two and trampling and disturbance was the
success. This would also not be expected as the most important cause at one site each. However,
current levels of most contaminants in bird eggs starvation and predation are hardly independent
are below the known threshold concentrations causes of failure, as starvation may cause chicks
for affecting the reproduction of birds (Becker & to behave in a way that makes them more vul-
Dittmann 2009). nerable to predation (Safriel et al. 1996).
The current data on breeding success show
Breeding success that Oystercatcher experience serious problems
Breeding success was monitored at several to reproduce successfully in most parts of the
sites and years in the Netherlands, Niedersach- Wadden Sea. Even at some island sites where
sen and Schleswig-Holstein and at one site in nest success is quite high, only few chicks are
two years in Denmark. In the Netherlands and raised. These findings fit into the observed long-
Schleswig-Holstein both sites on the islands and term trend in the Dutch Wadden Sea, where
at the mainland coast were monitored, whereas breeding success has declined with 75% in the
in Niedersachsen and Denmark only island sites past three decades (van der Jeugd et al. 2014).
were covered (Tab. 7). High predation rates are considered the main
In six out of eight mainland sites and years cause for the poor breeding performance along
(75%) in Schleswig-Holstein not one Oyster- the mainland coast, but for factors like breeding
catcher chick fledged, and in the remaining two, condition of the breeding adults and flooding it
the values were also very low. At the mainland is not clear how they affect breeding success as
sites in the Netherlands, the breeding success they are less easy to detect or (in case of flood-
varied more, with the extremes of one site with- ing) operate locally (cf. Oosterbeek et al. 2006;
out any fledging success, and the best site hav- van de Pol et al. 2010). For the island of Schier-
ing a breeding success of 0.39 fledged young per monnikoog it has been shown that the increased
pair. The un-weighted mean of the eight Dutch frequency of flooding during the breeding season
mainland sites and years was 0.21 fledged young is one of the causes for the poor reproduction
per pair. Data from the Netherlands from 2005- rates and low breeding numbers at a longer term.
2013, including a weighting routine, showed In their study on Schiermonnikoog, Ens (1992),
similar figures (Koffijberg et al. 2015b). Ens et al. (1996) and Safriel et al. (1996) found
In contrast to the hatching success, the a large variation in territory quality between so-
breeding success was not better at the island called ‘residents’, where the territory included a
sites than at the mainland sites in the Nether- feeding area, and ‘leapfrogs’ where the nesting
lands. At the 25 island sites and years the un- territory was away from the feeding site (leading
weighted mean was 0.15 fledged young per year. to lower chick survival due to food shortage). In
In Schleswig-Holstein, on the other hand, the 1984-1989, a period with stable breeding num-
breeding success was significantly higher on the bers, the un-weighted breeding success was 0.86
islands with 0.42 young per pair compared to fledged young per pair in resident territories, and
0.02 on the mainland coast. Although the breed- 0.21 fledged young per pair in leapfrog territories,
ing success was not monitored at the mainland or in the two types of territories combined 0.50
coast of Niedersachsen, the observed hatching fledged young per pair (from data in Ens 1992).
success of 5% on the nine sites and years means A breeding success of 0.50 or above was only
that also the breeding success must have been reached at four of the 52 sites and years (8%)
very low. On the islands in Niedersachsen, the within this programme in 2009-2012, and half of
Breeding success in the Wadden Sea 2009-201220
Tab. 6b: Cause of egg losses
Hatching success of Oyster-
Preda- Flood- Tram- Unfa- Food Other Un-
catcher in the Wadden Sea
tion ing pling vour- short- factors known
2009-2012. Causes of egg Country Sitename Year
(%) (%) (%) able age (%) (%)
losses
weath- (%)
er (%)
NL Texel, ‘t Stoar 2010 0
NL Texel, Studiegebied ‘t Stoar/Kikkert 2011 0
NL Texel, Studiegebied ‘t Stoar/Kikkert 2012 0
NL Texel, Studiegebied De Petten 2011 0
NL Texel, Studiegebied Joost Dourleinkazerne 2011 0
NL Vlieland, Vliehors, Schelpenbank 2011
NL Ameland, Kwelder Ferwerd Oost-West 2011 7 54 0 0 0 7 31
NL Ameland, Buurdergrie 2010 0
NL Ameland, Buurdergrie 2012 0
NL Ameland, Nieuwlandsreid Oost 2010
NL Ameland, Nieuwlandsreid Oost 2012
NL Schiermonnikoog, Hoge Kwelder 1e Slenk 2010
NL Schiermonnikoog Populatiestudie 2010
Ooster-kwelder
NL Noord Friesland Buitendijks, Biltpollen 2010 0 0 0 0 0 0 100
NL Groninger Kust, Emmapolder 2011 20 0 0 0 0 80 0
NL Delfzijl, Schermpier 2011 25 17 0 0 0 25 33
NL Delfzijl, Schermpier 2012 44 0 0 0 0 56 0
DE-NDS Norderney Grohdenvorland 2010 5 33 2 0 0 55 5
DE-NDS Norderney Grohdenvorland 2011 0 85 1 0 0 9 5
DE-NDS Norderney Grohdenvorland 2012 12 27 0 0 0 24 37
DE-NDS Norderney Ostheller 2010 67 11 0 0 0 22 0
DE-NDS Norderney Ostheller 2011 10 33 0 0 0 33 24
DE-NDS Norderney Ostheller 2012 23 0 0 0 0 38 39
DE-NDS Wangerooge 2010 45 53 0 0 0 0 3
DE-NDS Wangerooge 2011 29 43 0 0 0 26 3
DE-NDS Mellum Süddüne 2012 18 3 0 0 0 17 63
DE-NDS Mainland coast - Norderland 2009 86 9 5 0 0 0 0
DE-NDS Mainland coast - Norderland 2010 75 25 0 0 0 0 0
DE-NDS Mainland coast - Norderland 2011 100 0 0 0 0 0 0
DE-NDS Mainland coast - Elisabeth-Außengroden 2009 67 33 0 0 0 0 0
DE-NDS Mainland coast - Elisabeth-Außengroden 2010 78 11 11 0 0 0 0
DE-NDS Mainland coast - Elisabeth-Außengroden 2011 33 67 0 0 0 0 0
DE-NDS Mainland coast - Crildumersiel 2009 75 25 0 0 0 0 0
DE-NDS Mainland coast - Crildumersiel 2010 60 40 0 0 0 0 0
DE-NDS Mainland coast - Crildumersiel 2011 80 20 0 0 0 0 0
DE-SH Hedwigenkoog-Vorland 2009 69 22 2 0 0 7 0
DE-SH Hedwigenkoog-Vorland 2010 79 17 1 0 0 3 0
DE-SH Hedwigenkoog-Vorland 2011 75 17 5 0 0 3 0
DE-SH Hedwigenkoog-Vorland 2012 67 32 1 0 0 0 0
DE-SH Westerhever-Vorland 2009 89 11 0 0 0 0 0
DE-SH Westerhever-Vorland 2010 89 11 0 0 0 0 0
DE-SH Westerhever-Vorland 2011 62 38 0 0 0 0 0
DE-SH Westerhever-Vorland 2012 63 35 0 0 0 2 0
DE-SH Langeness, Westen 2012 71 0 3 0 0 26 0
DE-SH Langeness, Honkenswarft Ost 2012 56 0 0 0 0 44 0
DE-SH Oland 2011 14 0 0 0 0 53 33
DE-SH Oland 2012 26 0 0 0 0 47 27
DK Mandø east and northeast 2010 70 7 7 0 0 16 0
DK Mandø east and northeast 2011 81 17 0 0 0 1 0
DK Mandø east (sub-sample of above data set) 2010 72 2.5 10 0 0 15 0
DK Mandø east (sub-sample of above data set) 2011 93 6 0 0 0 1 0
Breeding success in the Wadden Sea 2009-201221
Country Sitename Habitat Year Sample Breeding Main cause Assessment Tab. 7:
size success of chick method Breeding success of Oyster-
(juveniles mortality catcher in the Wadden Sea
per pair) 2009-2012.
NL Texel, Studiegebied De Petten coastal wetland 2010 16 0.06
NL Texel, Studiegebied De Petten coastal wetland 2011 12 0 Unknown O Observation
NL Texel, Studiegebied Joost saltmarsh 2010 24 0.04
Dourleinkazerne
NL Texel, Studiegebied Kikkert coastal wetland 2010 2 0
NL Texel, ‘t Stoar coastal wetland 2010 2 0 Unknown O Observation
NL Texel, Studiegebied ‘t Stoar/Kikkert coastal wetland 2012 2 0 Unknown O Observation
NL Vlieland, Vliehors saltmarsh 2011 24 0 Flooding O Observation
NL Vlieland, Vliehors, Schelpenbank beach 2011 8 0 Flooding O Observation
NL Vlieland, Vliehors saltmarsh 2012 34 0.24 Disturbance O Observation
NL Vlieland, Westerseveld saltmarsh 2011 12 0.08 Trampled O Observation
NL Vlieland, Westerseveld saltmarsh 2012 14 0.57 O Observation
NL Vlieland, Strand beach 2010 10 0.1 Unknown O Observation
NL Ameland, Hollumerkwelder saltmarsh 2011 14 0 Flooding O Observation
NL Ameland, Buurdergrie polder 2010 125 0.8 O Observation
NL Ameland, Buurdergrie polder 2012 75 0.28 Starvation O Observation
NL Ameland, Nieuwlandsreid Oost saltmarsh 2010 55 0.2 Flooding O Observation
NL Ameland, Nieuwlandsreid Oost saltmarsh 2012 55 0 Predation O Observation
NL Schiermonnikoog, polder 2010 98 0.73 Unknown O Observation
Banckspolder Oost
NL Schiermonnikoog, polder 2012 98 0.18 Predation O Observation
Banckspolder Oost
NL Schiermonnikoog, saltmarsh 2010 32 0.06 Predation O Observation
Hoge Kwelder 1e Slenk
NL Schiermonnikoog saltmarsh 2010 89 0.24 Flooding O Observation
Populatiestudie Oosterkwelder
NL Rottumerplaat outer sand 2010 206 0.1 O Observation
NL Rottumerplaat outer sand 2011 232 0.03 O Observation
NL Rottumeroog outer sand 2011 95 0.02
NL Zuiderduin saltmarsh 2011 26 0 Flooding O Observation
NL Balgzand saltmarsh 2010 62 0 Predation O Observation
NL Balgzand saltmarsh 2012 73 0.05 Predation O Observation
NL Noord-Hollandse Kust, Balgzand saltmarsh 2012 87 0.39 O Observation
NL Groninger Kust, Klutenplas coastal wetland 2010 9 0.33 O Observation
NL Groninger Kust, Klutenplas coastal wetland 2011 9 0.22 Predation O Observation
NL Groninger Kust, Klutenplas coastal wetland 2012 8 0.38 Unknown O Observation
NL Delfzijl, Schermpier beach 2010 54 0.15 Flooding O Observation
NL Delfzijl, Schermpier beach 2012 60 0.18 O Observation
DE-NDS Norderney Grohdenvorland saltmarsh 2010 147 0.35 Not speci- O Observation
fied
DE-NDS Norderney Grohdenvorland saltmarsh 2011 99 0.13 Not speci- O Observation
fied
DE-NDS Norderney Grohdenvorland saltmarsh 2012 127 0.14 Flooding O Observation
DE-NDS Norderney Ostheller saltmarsh/dunes 2010 very low
DE-NDS Norderney Ostheller saltmarsh/dunes 2011 high
DE-NDS Norderney Ostheller saltmarsh/dunes 2012 high
DE-NDS Wangerooge saltmarsh 2010 44 0.3 Flooding O Observation
DE-NDS Wangerooge saltmarsh 2011 62 0 Flooding O Observation
DE-NDS Mellum Süddüne dunes 2012 very low
Breeding success in the Wadden Sea 2009-2012You can also read