WAIHEKE ISLAND LIBRARY - University of Lincoln
←
→
Page content transcription
If your browser does not render page correctly, please read the page content below
School of Architecture & the Built Environment
  The University of Lincoln

        WAIHEKE ISLAND LIBRARY
A zero-energy building and winner of the New Zealand Timber Awards (2015), with the top award
in the Commercial Architectural Excellence Category as well as the Overall Supreme Award.

                                Professor Hugh Byrd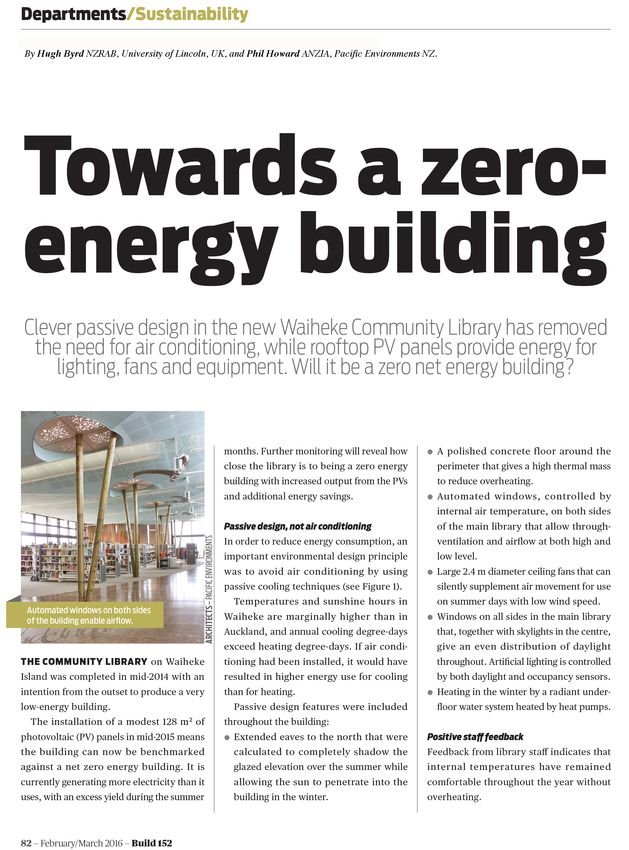
Project details

Author/designer: 			       Hugh Byrd Dip Arch, PhD

Practice: 				             Pacific Environments NZ Ltd

Title: 					               Waiheke Library

Output Type: 				Building

Function: 				             Public library

Location: 				             Oneroa, Waiheke Island

Client: 				Auckland Council

Practical completion: 		   June 2014

Budget: 				               $5.5 million

Area: 					                780 sqm

Structural Engineer: 		    Jawa Structures

Statement of research content and process

Description:                                                    Dissemination
Waiheke Island has a sub-tropical climate. Average tem-         The building has a real-time display of its energy performance
peratures are 2C warmer than Auckland where public li-          in the main library for the public to view. The initial feedback
braries are cooled by air-conditioning. The challenge set       has been published in a peer-reviewed journal. The build-
by the client for this building was to provide comfort tem-     ing and its performance has been celebrated widely through
peratures without the use of air-conditioning and to aim        professional journals and the media following architectural
for a net-zero energy building with the budget of a con-        awards given to the building.
ventional libarary.
                                                                Statement of significance:
Research questions                                              The feedback from the building some 2 years after it was
What methods of passive design are appropriate for a            completed have demonstrated its success in achieving its
public library in a sub-tropical climate where air-condition-   objectives of a free-running building that could be completely
ing is the norm?                                                off-grid. Indoor comfort has been achieved without air-condi-
To what extent can renewable energy (RE) devices be in-         tioning and the RE system has exceed its anticipated contri-
tegrated so that the performance can approach that of a         bution. All this within the budget of a standard library.
net-zero energy building?
How can the performance of the building and its RE devic-       Awards
es be simulated and monitored?                                  The building was the winner of the 2015 New Zealand Tim-
How can the building address the Te Aranga, Maori design        ber Awards taking out the top award in the Commercial Archi-
principles?                                                     tectural Excellence Category as well as the Overall Supreme
                                                                Award.
Methods
The design principles were based on published, peer-re-
viewed research by the designer.
Extensive simulation of the energy performance of the
building and RE technologies was carried out through-
out the design stages. Meters were integrated during the
construction stages to allow energy and water consuming
devices to be monitored remotely.
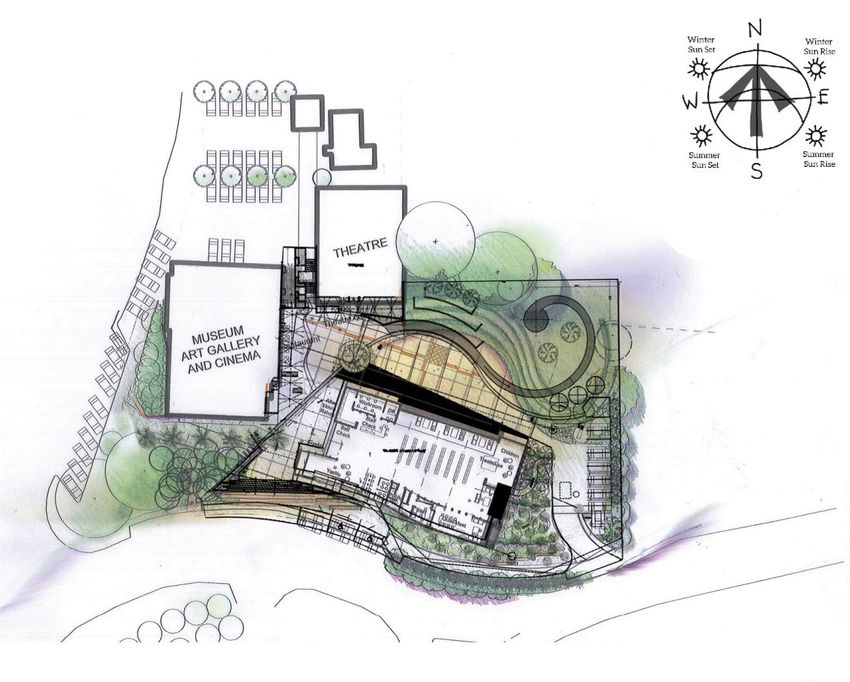
Plan & sections of
      the building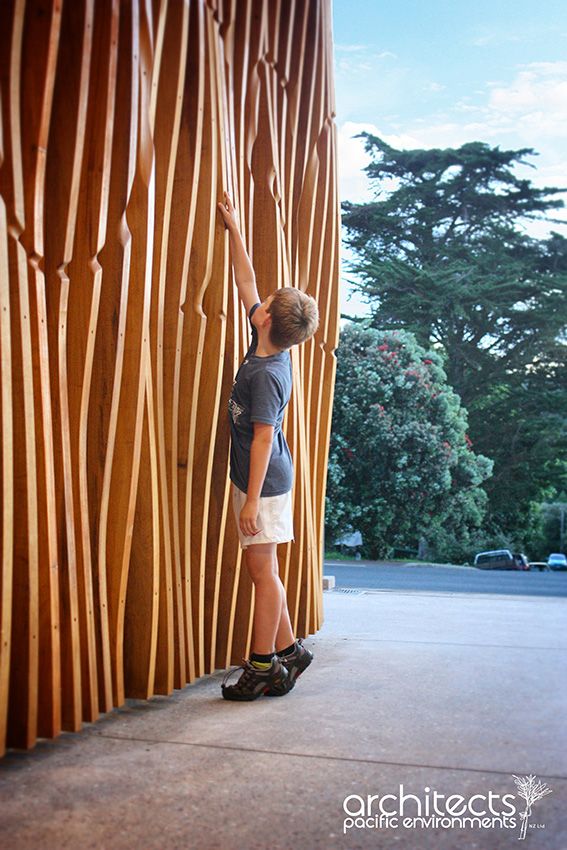
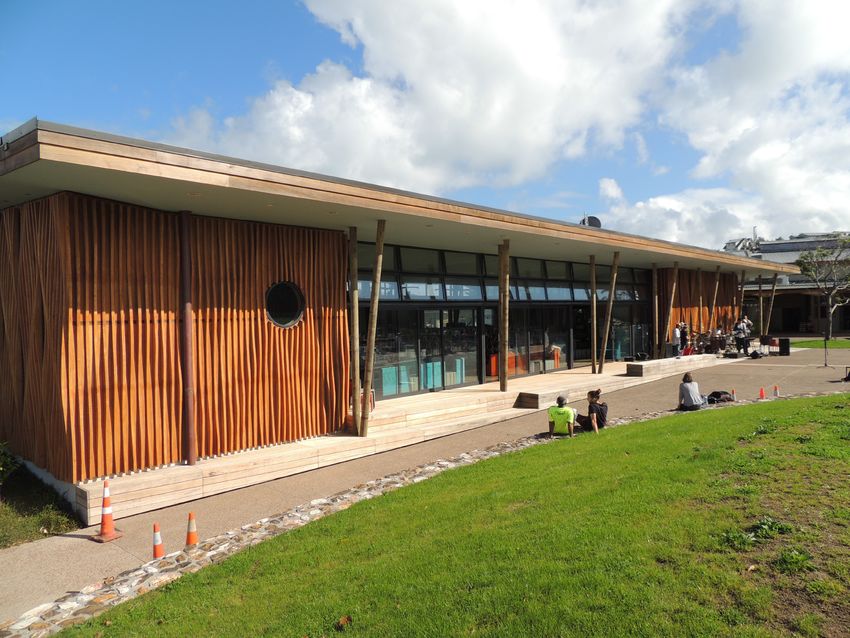
Introduction
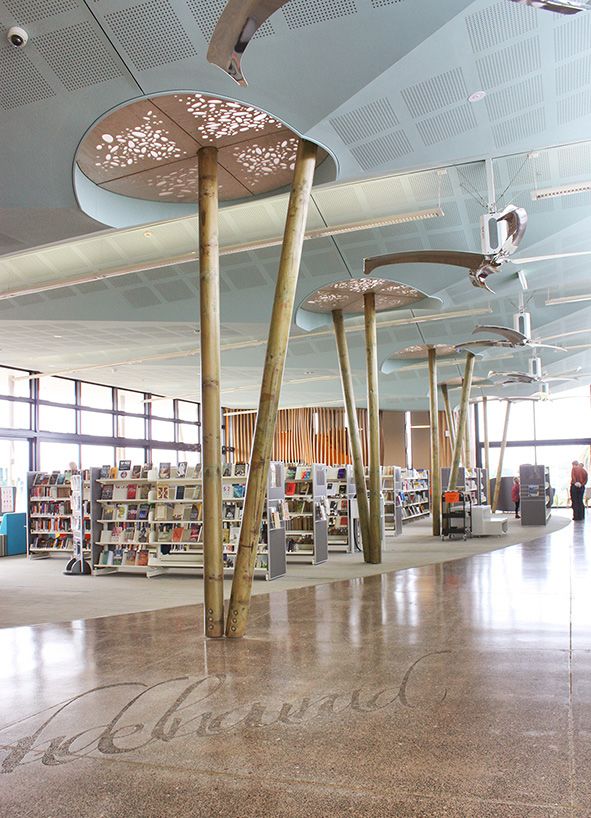
The library design draws on the imagery of books ar- ly proportioned roof overhangs providing shade in sum-
ranged under a canopy of pohutakawa trees for its mer. The height and depth of the building has also been
sculptural form. This concept is supported by simple low optimised to provide the best possible natural daylight
maintenance, low energy sustainable design initiatives to and ventilation. Windows are all automatically controlled
provide a high quality user environment of enduring value. but can still be adjusted to suit individual comfort levels.
The library is entered through a sheltered courtyard along All rain is collected of the roof, stored in three large un-
with other existing amenities such as a theatre, art gallery, derground tanks and supplies all the water needed for the
cinema and restaurant. On entering the library the simple building including a reservoir for firefighting. All windows
layout of central book shelves surrounded by a variety of are double glazed, roofs and walls highly insulated and an
seating, studying and meeting spaces is clearly apparent array of photovoltaic panels has been designed to provide
and easily navigated. A children’s reading platform rises all the energy required to run the building during summer.
above the book shelves and creates a playful environ-
ment as a pirates crow’s nest, Romeo and Juliet balco- Magnificent artwork by internationally renowned lo-
ny or any other scene that may come to the imagination. cal artist Kazu Nakagawa has been fully integrated
in to the façade, wall linings and floor of the building.
Large sliding doors open up the north side of the building
providing a seamless indoor/outdoor flow to the new court- Dialogue with Ngati Paoa iwi in regard to sensi-
yard and amphitheatre space where stories might be read, tive historical ancestral issues specific to the site
outdoor chess played or music and theatre performed. led to sightlines significant to them being incorpo-
rated in to the open space courtyard design and
Orientation of the library has been considered to provide marked by an installation of beautifully carved pou.
maximum sunlight in to the building in winter with careful-
Entrance with carved vertical fins
Main library with fans and
Carved pou
Childrens library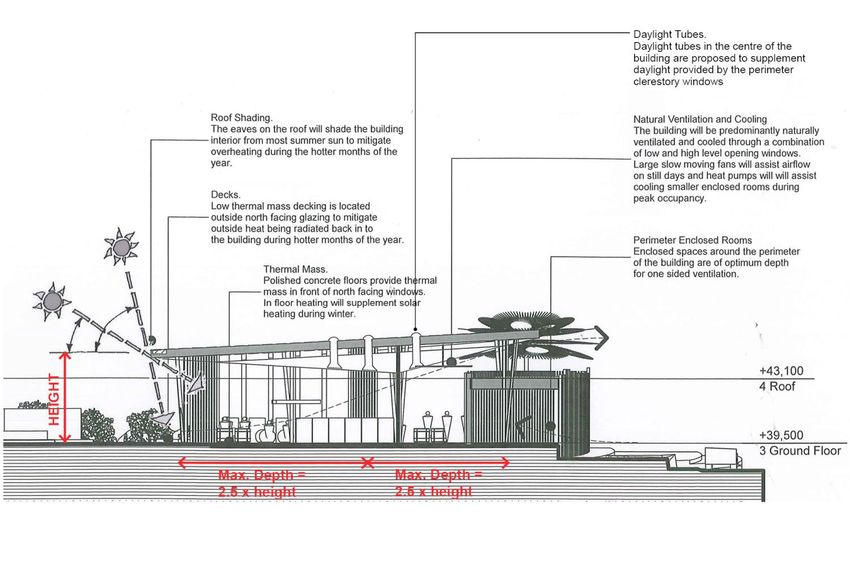
Research Methodology
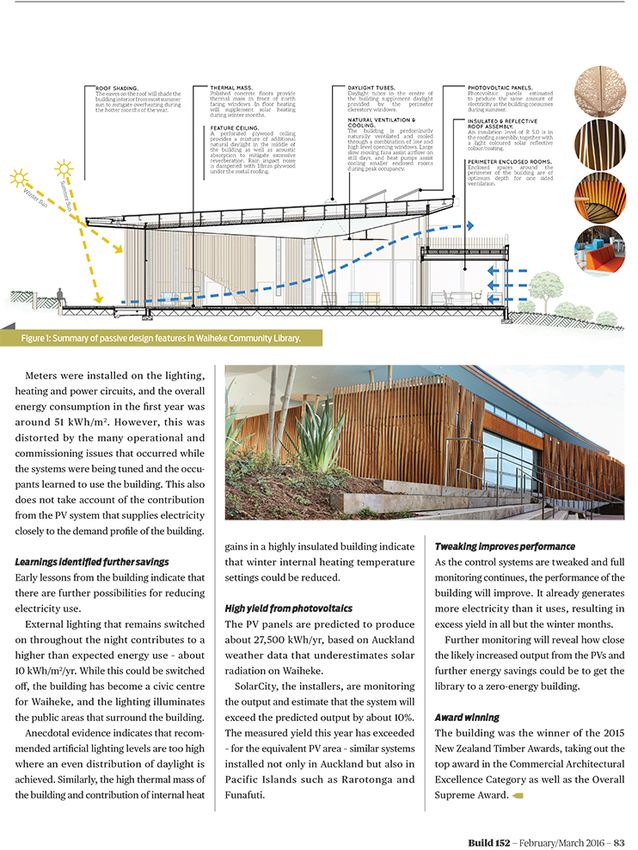
The design principles for a low energy, passive design PHOTOVOLTAIC PANELS.
were based on research carried out over several years Photovoltaic panels have been designed to generate
and published by the author. all energy required over summer and from equinox to
Byrd, Hugh (2012) Energy climate buildings: an introduc- equinox.
tion to designing future-proof buildings in New Zealand and INSULATED & REFLECTIVE ROOF ASSEMBLY.
the tropical Pacific. Transforming Cities, Auckland, New An insulation level of R 5.0 is in the roofing assembly,
Zealand. ISBN 9780992250904 together with a light coloured solar reflective colour/
coating.
The methods implemented in the design of the library are
summarised below. Simulation & MONITORING
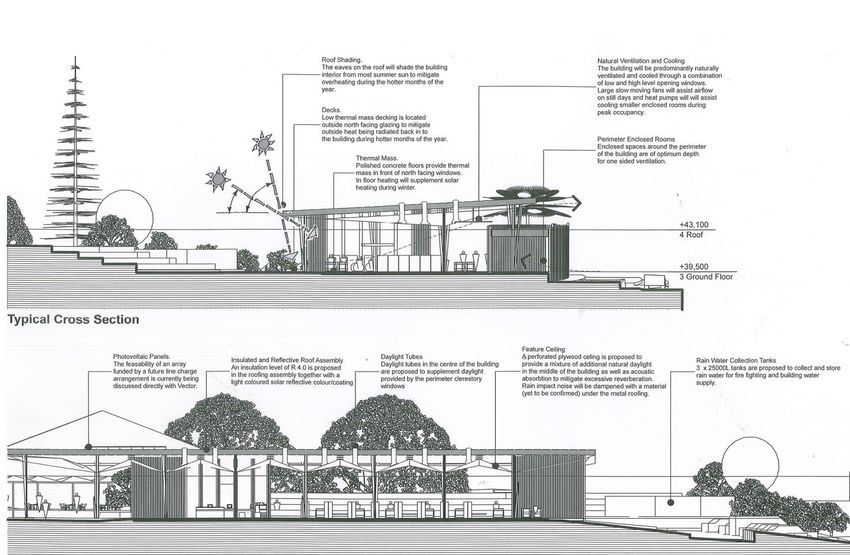
SHADING. As the design progressed its energy performance was
The eaves on the roof will shade the building interior tested using simulation methods (Eco-tect and Energy
from most summer sun to mitigate overheating during the Plus). Iterations were run and the design adjusted to
hotter months of the year. optimise performance. The detailed ‘Energy Report’ is
DECKS. attached in Appendix 1.
Low thermal mass decking is located outside north facing • An energy analysis of the building has estimat-
glazing to mitigate outside heat being radiated back into ed that about half of the annual energy required to run
the building during hotter months of the year. the building will be for equipment such as computers ,
THERMAL MASS. photocopiers and other plug in equipment or appliances.
Polished concrete floors provide thermal mass in front • The analysis estimates a further third of the an-
of north facing windows. In floor heating will supplement nual energy consumption will be for heating the building
solar heating during winter months. in winter.
DAYLIGHT TUBES. • Meters have been installed on separate light-
Daylight tubes in the centre of the building supplement ing, space heating, space cooling, water pumping, water
daylight provided by the perimeter clerestory windows. heating and plug in power circuits so that the actual en-
NATURAL VENTILATION & COOLING. ergy requirements of the building can be measured and
The building is naturally ventilated and cooled through a any un predicted energy loads identified.
combination of low and high level opening windows. Large
slow moving fans assist airflow on still days and heat
pumps assist cooling smaller enclosed rooms during peak
occupancy. Windows, controlled by temperature sensors,
are automatically opened at night for ‘night-time cooling’ in
hot weather conditions.
Daylight analysis
Energy performance of design iterations
Solatrprojection analysisDesign principles and research for energy use.
Climate throughout. Artificial lighting is controlled by both daylight
Temperatures and sunshine hours in Waiheke are margin- and occupancy sensors.
ally higher than Auckland and annual cooling degree-days
exceed heating degree-days which would result in higher Mechanical controls
energy use for cooling than for heating if air-conditioning Automated windows, controlled by internal air temper-
was installed. In order to reduce energy consumption, an ature, on both sides of the main library allow through
important environmental design principle was to avoid ventilation and airflow at both high and low level as well
air-conditioning by using passive cooling techniques. as night-time cooling. For summer days with low wind
speeds, large 8 foot (Big Ass) ceiling fans can silently sup-
Passive design plement air movement.
The main passive features are illustrated in the cross-sec-
tion. These include; extended eaves to the north which Heating in the winter is by radiant under floor water sys-
were calculated to completely shadow the glazed elevation tem heated by heat pumps (though this has never been
over the summer while allowing the sun to penetrate into required as the building has had no heating demand in
the building in the winter. The floor around the perimeter is the winter).
polished concrete giving a high thermal mass that reduces
overheating. On site renewable energy
80 photovoltaic panels (125 sqm) have been installed on
The main library has windows on all sides and together with the northerly (equitorial facing) slope of the roof.
skylights in the centre give an even distribution of daylightRainwater Harvesting & Water Treatment
There is no reticulated water on Waiheke Island. Water • Periodically the system will require the emptying of
must be collected and used carefully throughout the solids as these build up over time.
year.
• The library includes full rainwater harvesting STORM WATER TREATMENT AND DISPOSAL
by storing water collected off the roof in three, twenty • Rainwater off the roof is stored in water tanks which
two thousand litre tanks which are buried below the have an overflow to underground detention tanks.
grassed amphitheatre embankment behind the library. • This overflow function is also used as a vacuum sys-
• The stored water is first filtered and then treat- tem to reduce any sediment build up in the water tanks.
ed through ultraviolet disinfection before it is used in • Stormwater running over hard paved surfaces is
the building. It is the only water supply for the building. processed through catchpits to remove any heavy particles
• The volume of tank storage was calculated and then detained in the underground tanks which provide
based on rainfall data from the last 20 years, the avail- further settlement of particles.
able roof area and an assumed amount of water use • The surface water from the main courtyard and car
per person. Based on this data and assumptions the park areas is also treated through a filter system to remove
storage capacity is estimated to provide over 99% of major contaminants.
the water demand. • The primary roll of the underground detention tank is
• If the water level gets too low in the tanks a red to capture intense rail fall and allow its flow to be controlled
light flashes in the staff work room and an email alert prior to discharge to the local stream.
sent to the council call centre.
WATER METERING
REDUCING POTABLE WATER USE • A meter have been installed to measure the amount
• The greatest water demand in the library is ex- of water pumped from the rainwater tanks to the building.
pected to be for flushing toilets. • Another meter has also been installed to measure
• Dual flush WELS (Water Efficiency Labelling the amount of water pumped and from the waste water treat-
Scheme) Star Rated toilets(3 star) have been installed ment tanks to the local network utility waste treatment con-
• Time flow taps on wash hand basins have nection currently managed by Water Care.
been installed.
• High WELS Star Rated shower (3 star) and FIRE FIGHTING SUPPLY
sink taps (5 star)have been installed. • A hydrant connected to the water tanks has been
provided.
WASTE WATER TREATMENT AND DISPOSAL • The configuration of the tanks ensures an agreed
• Waste water is collected and processed by a minimum amount of water will always be available for fire
primary treatment system using anaerobic bacteria. fighting if required .
• Solids are separated from liquid which is then
discharged to the local network utility infrastructure
currently managed by Water Care.
Top: south facade
Bottom: north facade
(facing the sun)Te Aranga Māori Design Principles
POU WHENUA future and in the direction of the rising sun.
This Ngati Paoa initiated Pou Whenua project was a collab- “Ka pu te ruha ka hao te rangatahi”
oration between Ngati Paoa, Piritahi Marae and Waiheke
High School. These three carved totara pou stand as a The title refers to the constant cycle of change and men-
public artwork for the Waiheke community. The ideals of toring from youth to experience. The concepts of these life
Tika, Pono, Aroha - Past, Present and Future - Tapa Toru transactions are explored as young people grow and de-
are incorporated in the works. velop skills due to mentoring from older, experienced gen-
erations. This whanau concept also reinforces the value
POU NGATI PAOA and tikanga inherent in in a community working together to
Looking north east, this pou is orientated towards Tikapa achieve goals.
(Gannet Rock) after which Tikapa Moana (Hauraki Gulf)
takes its name. It was on Tikapa that karakia were made POU PIRITAHI MARAE
by those of both the Tainui and Te Arawa waka on first ar- Looking south this pou is orientated towards Piritahi Mar-
riving in Aotearoa. Paoa descends from both these waka ae and its maunga (hill) Piritaha. This pou references the
and this outlook reminds us of the sea aspect of the Ngati present.
Paoa territories and the Hauraki whakapapa of Tukutuku,
Paoa’s wife. Drawing on the concept of Pataka Matauranga (Storage
House of Knowledge), the use of the Taratara a kai notch
This pou faces towards the point on the horizon from which talks of the pataka of old. The manaakitanga of the Mar-
the star constellation of Matariki rises as it appears in mid- ae and kaitiakitanga for the islands ecology are referred to
winter marking the start of the Maori New Year. This pou while the bronze insert shows a representation of nga hau
reminds us of the past. e wha – of the four winds, the understanding that all are
welcome at Piritahi no matter from where you come.
POU WAIHEKE HIGH SCHOOL
Looking east, this pou is orientated towards the school and
its maunga (hill) Putiki o Kahu (Rangihoua) the hill that
stands at the head of Putiki inlet. This pou is looking to the
Three carved totara
pou stand as a public
artwork for the Waiheke
community.Performance, Dissemination & Awards
The performance of the building after its first year of opera- The building was the winner of the 2015 New Zealand
tion is described in the publication in Appendix 2. Timber Awards, taking out the top award in the Com-
mercial Architectural Excellence Category as well as the
Meters were installed on the lighting, heating and power Overall Supreme Award. The project was subsequently
circuits, and the overall energy consumption in the first published in all the main newspapers, professional and
year was around 51 kWh/m2. However, this was distorted trade journals.
by the many operational and commissioning issues that oc-
curred while the systems were being tuned and the occu- The energy performance was published in a peer reviewed
pants learned to use the building. Energy consumption has publication:
subsequently settled down to around 15 kWh/m2.
Byrd, Hugh and Howard, Phil (2016) Towards a zero ener-
This also does not take account of the contribution from the gy building. BRANZ Build, 152 (Feb/Mar). pp. 83-84. ISSN
PV system that supplies electricity closely to the demand 0110-4381
profile of the building.
The energy performance of the building can be seen in ‘re-
The PV panels produce on average 30,000 kWh/yr, al-time’ in the library building itself. Sensors provide data
directly to a screen so that energy use by the building and
As the control systems are tweaked and full monitoring energy supply from the photovoltaics can be observed.
continues, the performance of the building will improve. It
already generates more electricity than it uses, resulting in
excess yield in all but the winter months. Further monitor-
ing will reveal how close the likely increased output from
the PVs and further energy savings could be to get the
library to a zero-energy building.
“Waiheke library was so successful that it led the judges to comment, “This
building is a lyrical response to the idea of a timber library building, and a struc-
turally robust yet visually appealing statement.” Architecture New ZealandScreen showing energy performance in ‘real-time’ in the library.
Appendix 1 ENERGY ANALYSIS
1.0 GENERAL
The present report gives a general idea about the annual energy consumption for the project listed below:

Waiheke Island Library
131-133 Ocean View, Oneroa, Waiheke Island
Pacific Environment Architects

The analysis describes annual energy demand for heating, cooling, artificial lighting, general power, hot water and me-
chanical services. Information related to the building in the design stage has been provided by architects. When no infor-
mation related to use and consumption has been provided, assumptions have been proposed.

In broad terms and after a preliminary design analysis, it can be concluded that the building has an adequate design
from the sustainable and energy efficiency point of view. Its orientation responds properly to the north position obtaining
a good day-lighting performance as described below. The building envelope complies with the H.1 regulations and has
an adequate thermal treatment. The glazing ratio seems to be adequate to produce a good daylight factor reducing sig-
nificantly the artificial lighting. Likewise, all proposed diming, occupancy and CO2 sensor help to reduce the total energy
consumption.

2.0 METHODOLOGY
The present studio has been mainly carried out by using Ecotect software to predict energy demand by using a 3D model
and relevant input data. Assumptions respecting use and time of operation have been posed when no information is avail-
able. Ecotect is a comprehensive concept-to-detail sustainable building design tool. It offers a wide range of simulation
and building energy analysis functionality that can improve performance of existing buildings and new building designs,
such as:

 -Whole-building energy analysis—Calculate total energy use and carbon emissions of your building model on an annual,
monthly, daily, and hourly basis, using a global database of weather information.
-Thermal performance—Calculate heating and cooling loads for models and analyze effects of occupancy, internal gains,
infiltration, and equipment.
-Solar radiation—Visualize incident solar radiation on windows and surfaces, over any period.
-Daylighting—Calculate daylight factors and illuminance levels at any point in the model.
-Shadows and reflections—Display the sun’s position and path relative to the model at any date, time, and location.

In the present studio, thermal performance, solar radiation and daylighting analysis were made. Reliable input data must
be incorporated in order to have high precision on results. Meteorology data such as solar radiation, temperature range,
wind speed, etc, has been obtained through NIWA’s National Climate Centre. Likewise, information about building’s enve-
lope features: plan drawings, sections and details have been provided by the architects. In all, information provided has
been checked by author comparing it with database used in Ecotect. No greater differences were found. As the project
is a new Library building, many assumptions have been set up as no information about real use is in existence. These
assumptions will be clearly identified through the analysis. Most of these assumptions may be adjusted once the building
starts its normal operation and more is known about its use. It is important to note that due to mainly occupancy and
mechanical services assumptions, the results may have a certain level of inaccuracy. It is for this reason that the energy
analysis is to be used as a reference guide only.
3.0 HEATING AND COOLING DEMAND

Annual heating and cooling demand have been calculated using Ecotect software. An accurate 3D model had to be done
to do so. It was especially particular in modelling all those situations able to influence heat losses and internal gains.
Moreover, as Ecotect is able to simulate internal gains due to user and equipment, those related input data were analysed
in order to get as much precision as possible. These features will be detailed below.
As previously mentioned, meteorology data were selected from NIWA. Some relevant data regarding Solar Radiation,
Outside Temperature, Degree Days, Wind Speed, among others, are detailed in figure 1:

Figure 1 Meteorology Used Data Regarding Auckland Location

It is important to note that the building loses heat through two main ways:

Heat losses through the building’s envelope: Specifically concerning to conduction, this phenomenon occurs because
temperature tends to equalize when outside is warmer than inside (summer) or vice versa (winter). The thermal con-
ductivity of a material is the property that makes the heat transmitted from the side of higher temperature to the lowest
temperature. This feature can be expressed as:

U= 1/ Σ Thermal resistances of each element in the structure.

The total thermal resistance of a complex element composed by layers is calculated by adding the thermal resistance of
each layer.

The U-value for all elements in the proposed building has already been checked by using NZS4243:2007 section 1 and
were found appropriate to comply with NZBC Clause H1. This is according to a report dated 20 June, 2012 made by WSP
New Zealand Ltd. This present study has checked such information related to U-value without finding any difference which
may affect the thermal performance in Ecotect.
Figure 2 Total U-Value for Different Element of the Building Envelope
Source: WSP, report with date 20 June, 2012

Ventilation losses: ventilation is a compulsory process to keep healthy air fresh inside any building. This situation produces
heat losses as the fresh air coming into the building must be heated (winter) and vice versa (summer). As a result, it is
easy to note a higher heating and cooling demand because of a higher ACH (air change rate). Therefore, controlling the
level of ACH and reducing it to a minimum becomes vital to reduce energy consumption. However, there are National
Standards which have been established to protect the health and comfort of users staying inside a building. Regarding this
matter, NZS4303:1990 sets 8l/s/person or 15 cfm/person as minimum value for libraries. This is according to Table 2 “Out-
door Air Requirement for Ventilation, 2.2 Commercial Facilities”, page 10. The same Standard mentions 20 person/100 m2
as maximum occupancy. So, under these restrictions and considering that the study building has a total volume of 3,698
m3, the following are the maximum occupancies regarding ACH values:

1.00 ACH: 128 users
0.50 ACH: 64 users
0.25 ACH: 32 users

Because it is very difficult to set up a maximum occupancy in the study building and also considering the importance to
comply with the minimum requirements, the study building has been designed incorporating an active window control to
allow fresh air going into the building to improve CO2 concentration and also to ventilate the internal space when at a
higher temperature. While on the one hand this system can be very useful to maintain an acceptable level of indoor air
quality, at the same time it can be a factor that influences a greater demand for heating by ventilation losses. This, if the
control system were overestimated and the windows remain open for longer than necessary to recover the preset level of
indoor air quality. This is an important factor to consider during operation. On the other hand, this system can be also very
useful to reduce cooling demand because it establishes openings process when pre-adjusted temperatures are reached.

In the thermal analysis made on Ecotect, three different scenarios regarding number of ACH have been set up to show
the heating and cooling fluctuations: 1.00, 0.50 and 0.25. Therefore, the attached excel sheet shows heating and cooling
demand based on these three different scenarios. However, in the total annual energy demand, 0.5 ACH has been con-
sidered having set up two main assumptions: first, a maximum occupancy of 64 users at the same time and, second, the
CO2 sensor and system is adjusted so that the openings are adjusted to maintain a 0.5 ACH.
Internal gains:
There are various components that provide heat to a specific room and this heat is relevant in the case of requiring accu-
rate data in order to establish space heating demand. People, appliances, lighting and hot water are described as the most
important causes of internal heat gains. Standard 4243.1:2007 gives some default power densities for internal gains for
occupants and plug loads. These values are to be used for the modeling method when trying to meet minimum acceptable
energy efficiency performance requirements for the building envelope and artificial lighting for large buildings. As there is
not information related to Libraries, information related to School has been used. This information sets up 9.7 W/m2 for
occupancy and 5.4 w/m2 for plug load. According to this information and considering 70 W/person (sedentary regime),
the maximum occupancy would be 108 people. Now, this value is low when compared with the maximum occupancy
obtained after applying the ventilation minimum standard which established 128 users. Likewise, assumptions regarding
occupancy during the day have been posed. Figure 3 shows the occupancy distribution during day. This has considered a
maximum occupancy during the afternoon with 35% of 128 maximum occupancy users as described above.

Figure 3 Occupancy Proposed Schedule

Plug load may be seen as a lower rate but the incorporated daylight sensor and dimming components should be noted
which will significantly reduce artificial lighting demand. In all, after doing some simulation in Ecotect, heating decreases
between 15 and 20% and cooling increases by 50% if 10W/m2 were set up.

Solar gains:
Heat gains through solar radiation are one of the largest energy inputs in a building. The sun delivers a constant amount of
energy throughout the year, depending on the location and orientation. Concerning the specific case of Auckland, monthly
average solar radiation database has been used from NIWA. Apart from contributing to heat gains in Winter, the same
solar radiation may be an important factor for overheating in summer time. However, the building has been design such
a way that there are not too many solar gains in summer. But, the shadows display tool in Ecotec has shown that there is
an overheating possibility in summer time after 5:30pm in the south-west facade. Fortunately, Library operation hours is
to 18:00 pm so that it will not affect the normal operation cooling demand.
Figure 4 Solar Projection Afternoon in Summer Time (17:30pm)

Once all input data has been collected the thermal performance in Ecotect can be carried out. The following information
summarizes all required data to be used in the software:

Clothing (clo): 1.0
Humidity: 50%
Air Speed: 1 m/s
Lighting Level: 400 lux
Occupancy: 155 maximum people with the schedule shown in ¡Error! No se encuentra el origen de la referencia..
Internal Gains: 5.4 W/m2 (if internal gains increase up to 10 w/m2, heating may decrease between 15 and 20% and cool-
ing increase up to 50%).
Air Change Rate: 0.25, 0.50 & 1.00
Wind Sensivity: 0.50

Two heating type system have been analysed:

Mix-Mode System: A combination of air-conditioning and natural ventilation where the HVAC system shuts down when-
ever outside conditions are within the defined thermostat range. It should be noted that Ecotect assumes that either the
system continues running on supplying mechanical ventilation or the windows are opened. In either case, the air change
rate increases as described above. Note also that Ecotect does not consider energy used in the ducting of air when it
calculates heating and cooling loads - these are both given as space loads not plant loads. This seems to be the most
appropriate system for the study building as it incorporates natural ventilation and openings where interior comfort has
been achieved. Therefore, using the heating system should be according to such a situation.

Otherwise if the heating system continues to operate (albeit with lower energy load) during the pre-established tempera-
ture range, additional percentages of heating and cooling demand should be added.

Full Air Conditioning: This means that heating and refrigeration systems run as required to maintain the zone air tem-
perature between the thermostat settings at all times during the operational period. Windows are never opened so the
only ventilation and infiltration is set in the Air Change Rate settings for the zone. This system is not covered by the study
building; however, calculations have been done to show the difference between the proposed building and similar ones
with Full Air Conditioning Systems commonly used in current times.

Once the model is done and all construction elements (wall, ceiling, roof and windows) checked to comply
with the project specifications, the thermal analysis performance is made. The following diagrams show the information
obtained in the thermal analysis. Note that 3 different scenarios have been posed regarding ACH. Likewise, 3 other
scenarios have been proposed regarding thermostat range in order to get comparison charts. In turn, as the proposed
building includes 2 different floor finishes (carpet and concrete) simulations for each element have also been made to give
an idea of its implications on the calculated thermal performance.
Diagram 1 20-24° Thermostat Range
* Range according to Section C5.8.3 NZS 4243.1:2007

Diagram 2 18.5-24° Thermostat Range

Diagram 3 22-24° Thermostat Range
4.0 LIGHTING
Lighting has been analysed with the information regarding lighting luminaire schedule provided by architects. The total
load has been determined by using 10 hrs of operation for internal lights and 11hrs for external ones. An average of 400
lux base has been used for internal calculations. Ecotect is able to determine Daylight Factor (%) and Daylighting Levels
(lux). To do that, Design Sky Illuminance (lux) must be known. This value represents a lux value for the amount of light out-
put from the sky. This value is derived from a statistical analysis of outdoor illuminance levels, based on the 15th percentile
- ie: that illuminance level that is exceeded 85% of the time between the hours of 9am and 5pm throughout the working
year. This is taken from the current weather data file. But in the Auckland case, 6,400 lux External luminance has been
given in Table 1 of NZS 6703. Thus it represents a worst-case scenario to design to. After doing daylight levels calculation
in Ecotect, results show that 92% of total floor area reaches 400 lux as minimum as shown in Figure 6.

Figure 5 Daylight Analysis Waiheke Island Library

After that, two different calculations were made. Firstly, as these Daylight Levels value represent only 85% of illuminance
level over the standard, 92% of 85% is calculated resulting in 78.2%. Then, as this standard represents a calculation pe-
riod between 9am and 5pm throughout the working year, and the Library operation time is between 8am and 7pm, 92%
corresponds to 86.3% in the daytime ( 9.5 hrs has been considered as sunlight factor). So, 86.3% of 78.2% (from above
estimation) is calculated resulting in 67.48% which roughly represents the daylight contribution ratio. As the study building
incorporates occupancy sensor and automatic dimming systems, this 67.48% also represents the savings in artificial
lighting. It is important to note that these values are based on computational and mathematical calculations which widely
depend on the input data. Therefore, a margin of error ratio must be considered. Moreover, Ecotect is not as accurate
as other software concerning Lighting levels. However, this value is not far from data given by Ullah et al (1996) where
they pose that within 6 meters of the perimeter of an office, automatic dimming can save about 84% of energy required to
artificially light the space (taking as reference a light level of 500 lux).
Figure 6 Daylight Levels with 100 lux Curves of Interval

4.0 GENERAL POWER
Total annual electricity demand regarding “General Power” has been established by calculating the Library’s electrical
equipment in its normal operation. An energy efficiency performance has been used for each equipment. Likewise, the
operation time for each equipment has been considered for the Library normal operation. In some cases, assumptions
concerning use ratio has been posed based on normal consumption in reference to consumption of equipment found on
websites devoted to electricity consumption. These assumptions may be adjusted if the average of operation time for
those equipments becomes known.
Some assumptions are:
Laptop used by users: 10/day, 2 hrs each.
Mobil Phone Charging: 5/day, 4 hrs each
Electric Scooter: 1/week, 6.4 kWh/charging.
Vacuum: 45min/day
Microwave: 0.5 hrs/day
Water Boiler: 0.25 hrs/day
Printer: 2 hr/day

Split (Air Conditioning Equipment): this has been considered as part of General Power with 25 min/day as average. This
is considering nil use in winter time and a couple of hours per day in summer time.

305 days has been estimated as normal operation days throughout the year. This is considering 10 public holidays in New
Zealand and discounting on Sundays. Annex 1-3 is attached which details all electrical equipment covered by the study.
Information regarding computers has been taken from the architectural plans.

5.0 HOT WATER
Two main ways of calculating have been considered to determine hot water consumption demand. First, one shower a
day (by staff member) consuming 45 ltrs on average and 2 ltrs per person for Hand Basin washing. Now, if considering 60
users a day, 120 ltrs/day is used. Also 15 ltrs per staff in the kitchen. A total of 180 ltrs/day is achieved through this way
of calculating.
The second way of calculating is considering the proposed Hot Water Tank size of 180 ltrs which reaches the demand
described above.
The formula to determine the hot water demand is:
4.18*(60°C-15°C)*(Volume heated in litres)/3600 + 20% per losses
Where:
4.18 (kJ / kg°K): specific heat of water
60°C: hot water requirement
15°C: cold water

6.0 ELECTRICITY GENERATION POTENTIAL BY USING PVs
PVs is a great alternative to provide electricity to a building. With current technology, and especially with the grid-connect-
ed system, buildings can even provide 100% of its electricity needs on-site. Detailed below is the electricity generation
potential in the study project by using PVs. Technical information about equipment characteristics has been provided by
SolarCity. The position of PVs has been proposed in order to be free of obstructions and shadows taking into account the
shortest day in winter time. Likewise, the pitch of PVs (25°) has been proposed to get a higher efficiency. In the case of
Auckland location, 97% efficiency is reached with the current orientation and PVs pitch.

Modules Type: Panasonic MP6-230E01 230 Wp
Size: 1650x990 mm (1.63 m2)
Quantity: 264 Modules (6 Rows of 44)
Total Power: 60.72 KW
Array Pitch: 25° from Horizontal
Array Direction: 30° North-East
Electricity Generation per Module (approx.): 287.5kWh/annum (Auckland)
Total Electricity Generation per Array (approx.): 75,900kWh/annum (Auckland)
Appendix 2
You can also read