WALMART SHADOW ANCHORED RETAIL PORTFOLIO - POOL FIVE
←
→
Page content transcription
If your browser does not render page correctly, please read the page content below
CONFIDENTIAL OFFERING MEMORANDUM

WALMART SHADOW ANCHORED RETAIL PORTFOLIO

                  POOL FIVE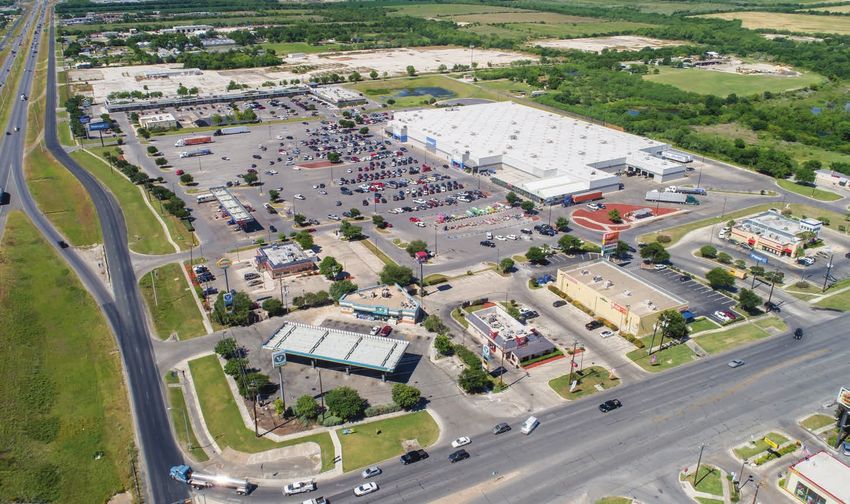
CONFIDENTIALITY AND DISCLAIMER
    The information contained in the following Marketing Brochure is proprietary and strictly confidential. It is intended
  to be reviewed only by the party receiving it from Marcus & Millichap and should not be made available to any other
       person or entity without the written consent of Marcus & Millichap. This Marketing Brochure has been prepared
     to provide summary, unverified information to prospective purchasers, and to establish only a preliminary level of
      interest in the subject property. The information contained herein is not a substitute for a thorough due diligence
     investigation. Marcus & Millichap has not made any investigation, and makes no warranty or representation, with
 respect to the income or expenses for the subject property, the future projected financial performance of the property,
the size and square footage of the property and improvements, the presence or absence of contaminating substances,
   PCB’s or asbestos, the compliance with State and Federal regulations, the physical condition of the improvements
 thereon, or the financial condition or business prospects of any tenant, or any tenant’s plans or intentions to continue
       its occupancy of the subject property. The information contained in this Marketing Brochure has been obtained
    from sources we believe to be reliable; however, Marcus & Millichap has not verified, and will not verify, any of the
   information contained herein, nor has Marcus & Millichap conducted any investigation regarding these matters and
makes no warranty or representation whatsoever regarding the accuracy or completeness of the information provided.
              All potential buyers must take appropriate measures to verify all of the information set forth herein.

                                            NON-ENDORSEMENT NOTICE

 Marcus & Millichap is not affiliated with, sponsored by, or endorsed by any commercial tenant or lessee identified in
this marketing package. The presence of any corporation’s logo or name is not intended to indicate or imply affiliation
  with, or sponsorship or endorsement by, said corporation of Marcus & Millichap, its affiliates or subsidiaries, or any
agent, product, service, or commercial listing of Marcus & Millichap, and is solely included for the purpose of providing
                         tenant lessee information about this listing to prospective customers.

                        ALL PROPERTY SHOWINGS ARE BY APPOINTMENT ONLY.
                PLEASE CONSULT YOUR MARCUS & MILLICHAP AGENT FOR MORE DETAILS.
NET LEASE DISCLAIMER

Marcus & Millichap hereby advises all prospective purchasers of Net Leased property as follows:

•   The information contained in this Marketing Brochure has been obtained from sources we believe to be reliable. However, Marcus &
    Millichap has not and will not verify any of this information, nor has Marcus & Millichap conducted any investigation regarding these
    matters. Marcus & Millichap makes no guarantee, warranty or representation whatsoever about the accuracy or completeness of any
    information provided.
•   As the Buyer of a net leased property, it is the Buyer’s responsibility to independently confirm the accuracy and completeness of all
    material information before completing any purchase. This Marketing Brochure is not a substitute for your thorough due diligence
    investigation of this investment opportunity. Marcus & Millichap expressly denies any obligation to conduct a due diligence examination of
    this Property for Buyer.
•   Any projections, opinions, assumptions or estimates used in this Marketing Brochure are for example only and do not represent the
    current or future performance of this property. The value of a net leased property to you depends on factors that should be evaluated by
    you and your tax, financial and legal advisors.
•   Buyer and Buyer’s tax, financial, legal, and construction advisors should conduct a careful, independent investigation of any net leased
    property to determine to your satisfaction with the suitability of the property for your needs.
•   Like all real estate investments, this investment carries significant risks. Buyer and Buyer’s legal and financial advisors must request
    and carefully review all legal and financial documents related to the property and tenant. While the tenant’s past performance at this
    or other locations is an important consideration, it is not a guarantee of future success. Similarly, the lease rate for some properties,
    including newly-constructed facilities or newly-acquired locations, may be set based on a tenant’s projected sales with little or no record
    of actual performance, or comparable rents for the area. Returns are not guaranteed; the tenant and any guarantors may fail to pay the
    lease rent or property taxes, or may fail to comply with other material terms of the lease; cash flow may be interrupted in part or in whole
    due to market, economic, environmental or other conditions. Regardless of tenant history and lease guarantees, Buyer is responsible
    for conducting his/her own investigation of all matters affecting the intrinsic value of the property and the value of any long-term lease,
    including the likelihood of locating a replacement tenant if the current tenant should default or abandon the property, and the lease terms
    that Buyer may be able to negotiate with a potential replacement tenant considering the location of the property, and Buyer’s legal ability
    to make alternate use of the property.
•   By accepting this Marketing Brochure you agree to release Marcus & Millichap Real Estate Investment Services and hold it harmless from
    any kind of claim, cost, expense, or liability arising out of your investigation and/or purchase of this net leased property.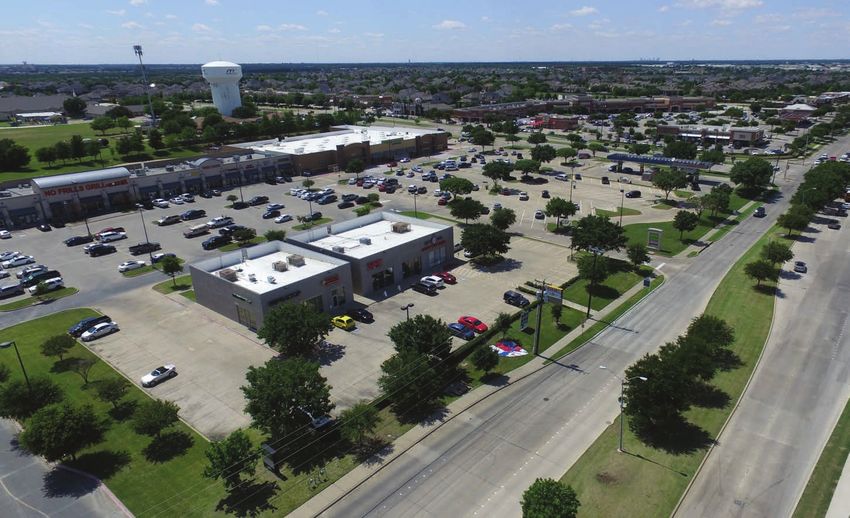
MATHES PORTFOLIO

                                                                                                                                  9
                                                                                                                             17

                                                                                         12
                                        1                                                10
                                                                                                11                       6
                                                                      2         3
                                                                                                                              5
                                                                               19   4
                                                       15
                                                                                                8
                                                                          20 22
                                                                                                     7
                                                                   18
                                                                 21
                                                            16
                                                                          14
                                                                 13

    CENTRAL POOL                SOUTHEAST POOL                    MIDWEST POOL                  TEXAS POOL                                 POOL 5
   CORTEZ, CO                      DILLON, SC                    EVANS MILLS, NY                    ALICE, TX                     BATAVIA, NY
1 215 Sligo St.                 5 517 Radford Blvd.         9 26397 Johnson Rd.               13 2611 East Main St.          17 4140 Veteran’s Memorial Dr.
   ENID, OK                        SALISBURY, NC                 MARION, IL                         BAY CITY, TX                  GATESVILLE, TX
2 5503 W. Owen K Garriott Rd.   6 1030 Freeland Dr.         10 2406 Williamson County Pkwy. 14 4500 7th St.                  18 319 TX-Business 36
   PRYOR, OK                       BREWTON, AL                   OAK GROVE, KY                      LUBBOCK, TX                   HUGO, OK
3 105-165 Steve Barry Blvd.     7 2550 - 2570 Douglas Ave. 11 200-266 Segler Dr.              15 1803 7th St.                19 1601-1623 East Jackson St.

4 MALVERN, AR                   8 SELMA, AL                 12 SALEM, IL                      16 UVALDE, TX                  20 MANSFIELD, TX
   2300 Leopard Ln.                2414 Kimble Rd.               103 Baldridge Ln.                  3250 East Main St.            SWC Debbie Lane & Matlock Rd.

                                                                                                                             21 SAN ANTONIO, TX
                                                                                                                                  NEQ 410 & Rigsby Ave.
                                                                                                                             22 SEAGOVILLE, TX
                                                                                                                                  Hwy 175 & Malloy Bridge Rd.
POOL 5

                                                                                                     1

                                                                3

                                                              4 6
                                                          2
                                                      5

17   BATAVIA, NY
     4140 Veteran’s Memorial Dr.   18   GATESVILLE, TX
                                        319 TX-Business 36          19   HUGO, OK
                                                                         1601-1623 E. Jackson St.   20   MANSFIELD, TX
                                                                                                         SWC Debbie Ln. & Matlock Rd.

     SAN ANTONIO, TX                    SEAGOVILLE, TX
21   NEQ 410 & Rigsby Ave.         22   HWY 175 & Malloy Bridge Rd.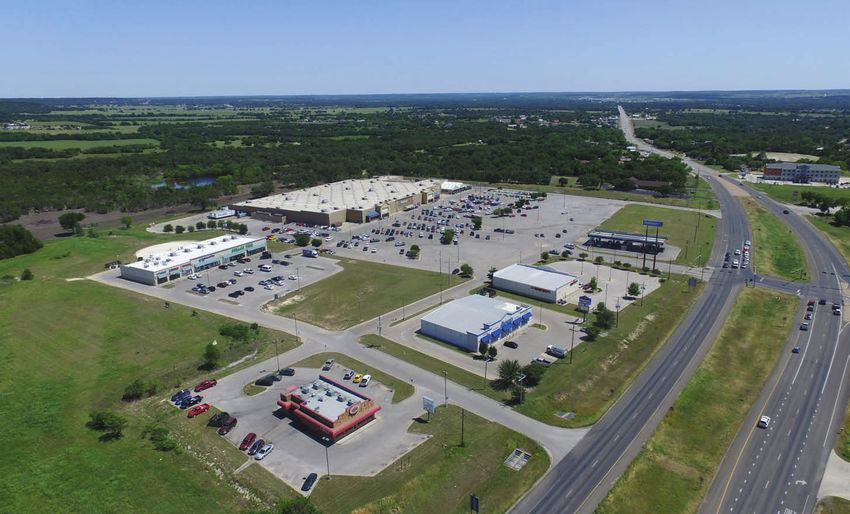
POOL FIVE HIGHLIGHTS                                                                                                                                                         EXECUTIVE SUMMARY

   BATAVIA, NY                        GATESVILLE, TX                                                           HUGO, OK                                                    MANSFIELD, TX
   100% OCCUPIED                        100% OCCUPIED                                                     95% OCCUPIED                                                      100% OCCUPIED

                                     SAN ANTONIO, TX                                                   SEAGOVILLE, TX
                                         90% OCCUPIED                                                    100% OCCUPIED

 • All but four of the Leases are Triple-Net
 • 95% Occupied – Stabilized Offering
 • Four of the six Properties are in Texas – Income Tax Free State
 • Cumulative GLA is 222,687
 • Cash on Cash – 8.29%
 • Total Return – 11.58%

                      This information has been secured from sources we believe to be reliable, but we make no representations or warranties, expressed or implied, as to the accuracy of the information. References to square
                      footage or age are approximate. Buyer must verify the information and bears all risk for any inaccuracies. Any projections, opinions, assumptions or estimates used herein are for example purposes only
                      and do not represent the current or future performance of the property. Marcus & Millichap Real Estate Investment Services is a service mark of Marcus & Millichap Real Estate Investment Services, Inc.
                       © 2017 Marcus & Millichap
POOL 5 HIGHLIGHTS                                                                                                                                                                                   EXECUTIVE SUMMARY

PROPOSED FINANCING                                                                                                            ASSUMPTION OF EXISTING NON-RECOURSE NOTE
PRICE                                                                                              $24,825,971                LOAN AMOUNT                                                                                      $15,686,971
CAP RATE                                                                                                       7.0%           LOAN TYPE                                                                                    ASSUMPTION
DOWN PAYMENT                                                                              37% / $9,139,000                    INTEREST RATE                                                                                                4.3%
LOAN AMOUNT                                                                                        $15,686,971                AMORTIZATION                                                                                        30 YEARS
LOAN TYPE                                                                                      ASSUMPTION                     ORIGINAL TERM                                                                                       10 YEARS
INTEREST /
                                                                                          4.3% / 30 YEARS                     DUE DATE                                                                                               2/1/2025
AMORTIZATION
NOI                                                                                                  $1,737,818               CURRENT MONTHLY PAYMENTS                                                                           $81,653.79
DEBT SERVICE                                                                                            $979,845              LENDER NAME                                                                                WELLS FARGO
DEBT COVERAGE RATIO                                                                                             1.77
                                                                                                                             *ESTIMATED LOAN BALANCE AS OF 11/01/17.
NET CASH FLOW                                                                                                                *BUYER WILL PAY A 1% ASSUMPTION FEE PLUS ANY LEGAL FEES.
                                                                                          8.29% / $757,973
AFTER DEBT SERVICE
PRINCIPAL REDUCTION                                                                                     $300,000
TOTAL RETURN                                                                         11.58% / $1,057,973

PROPERTY OVERVIEW
PROPERTY                               ADDRESS                                                                                CITY                                                    STATE                                                  NOI
BATVIA                                 4140 VETERAN'S MEMORIAL DRIVE                                                          BATAVIA                                                 NY                                            $297,175
GATESVILLE                             319 TEXAS 36 BUSINESS                                                                  GATESVILLE                                              TX                                            $269,754
HUGO                                   1601-1623 EAST JACKSON STREET                                                          HUGO                                                    OK                                            $245,005
MANSFIELD                              2881-2891 MATLOCK ROAD                                                                 MANSFIELD                                               TX                                            $225,850
SAN ANTONIO                            2000 SE LOOP 410                                                                       SAN ANTONIO                                             TX                                            $568,315
SEAGOVILLE                             110 N HIGHWAY 175                                                                      SEAGOVILLE                                              TX                                            $131,719
TOTAL                                                                                                                                                                                                                            $1,737,818

*Most of the leases include a capital expenditures reserve charge billed in CAM that is non-refundable to the tenants. The NOI includes the Replacement Reserve amounts collected as income.

                                             This information has been secured from sources we believe to be reliable, but we make no representations or warranties, expressed or implied, as to the accuracy of the information. References to square
                                             footage or age are approximate. Buyer must verify the information and bears all risk for any inaccuracies. Any projections, opinions, assumptions or estimates used herein are for example purposes only
                                             and do not represent the current or future performance of the property. Marcus & Millichap Real Estate Investment Services is a service mark of Marcus & Millichap Real Estate Investment Services, Inc.
                                              © 2017 Marcus & Millichap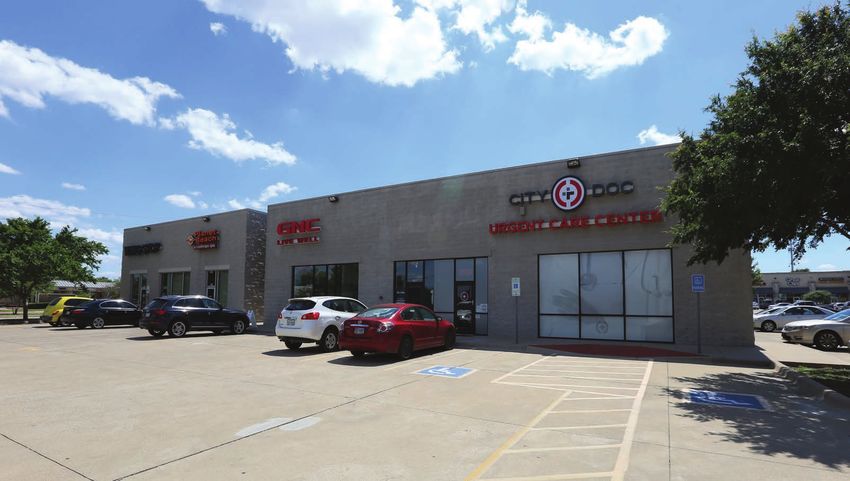
TABLE OF CONTENTS

     BATAVIA, NY
 1   4140 VETERAN’S MEMORIAL DR.

     GATESVILLE, TX
 2   319 TX BUSINESS 36

     HUGO, OK
 3   1601-1623 E. JACKSON ST.

     MANSFIELD, TX
 4   SWC DEBBIE LN. & MATLOCK RD.

     SAN ANTONIO, TX
 5   NEQ 410 & RIGSBY AVE.

     SEAGOVILLE, TX
 6   HWY 175 & MALLOY BRIDGE RD.

                                    Y0410188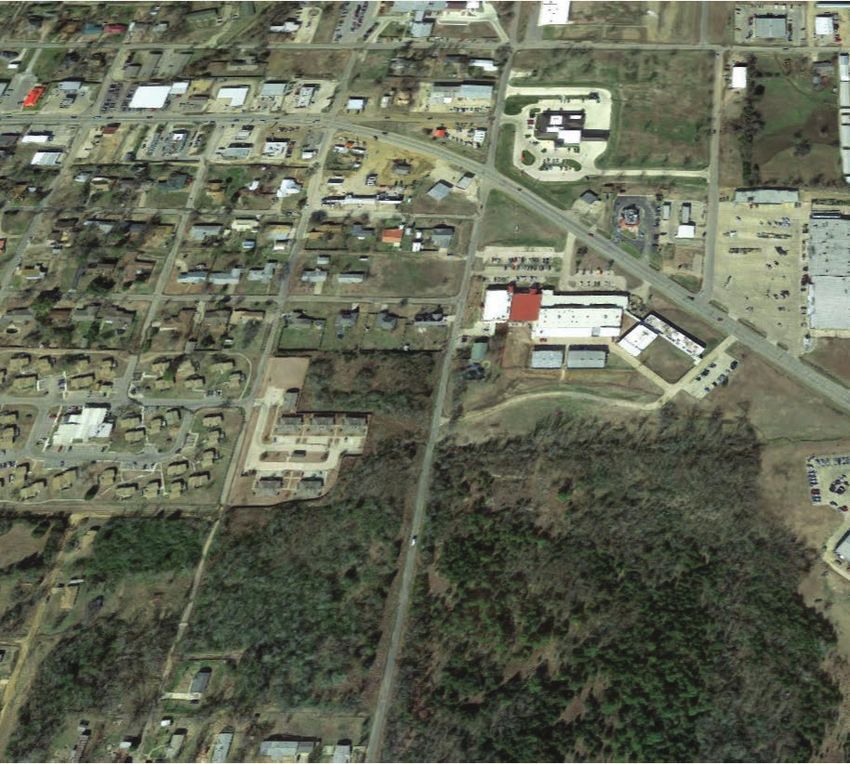
1      BATAVIA, NY
    4140 VETERANS MEMORIAL DR.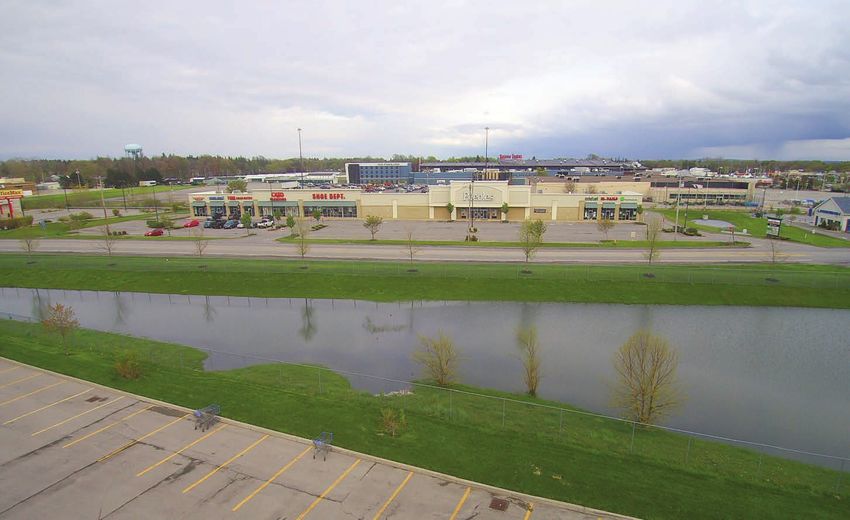
OFFERING HIGHLIGHTS: BATAVIA, NY                                                                                                                                                   EXECUTIVE SUMMARY

                                                                                                               4140 VETERANS MEMORIAL DR., BATAVIA, NY 14020

SUMMARY                                                                                              MAJOR EMPLOYERS

NOI - CURRENT                                                                  $297,175              COUNTY OF GENESEE                                                                                                       790

PERCENT OCCUPIED                                                                     100%            UNITED MEMORIAL MEDICAL CENTER                                                                                          750

GROSS LEASABLE AREA (GLA) (SQ.FT.)                                                 35,413            BYRON FAMILY HEALTH CENTER                                                                                              550

LAND AREA (ACRES)                                                                       3.70         ELLUCIAN INC                                                                                                            304

YEAR BUILT                                                                            2007           TROOP A                                                                                                                 300

                                                                                                     GENESEE COUNTY NURSING HOME                                                                                             254

                                                                                                     BATAVIA V A MEDICAL CENTER                                                                                              245

DEMOGRAPHICS                                  1-MILE           3-MILES 5-MILES                       BUREAU OF PRISONS                                                                                                       245

2014 POPULATION                                4,279            18,692            25,199             WALMART                                                                                                                 235

2019 POPULATION                                4,283            18,770            25,358             CHAPIN INTERNATIONAL INC                                                                                                225

2014 HOUSEHOLDS                                1,495             7,684            10,193             CHAPIN MANUFACTURING INC                                                                                                220

2019 HOUSEHOLDS                                1,516             7,788            10,349             GENESEE COMMUNITY COLLEGE                                                                                               200

MEDIAN HH INCOME                             $40,101           $38,233           $40,523

PER CAPITA HH INCOME                         $19,294           $21,865           $22,564

AVERAGE HH INCOME                            $52,616           $51,230           $53,547

                            This information has been secured from sources we believe to be reliable, but we make no representations or warranties, expressed or implied, as to the accuracy of the information. References to square
                            footage or age are approximate. Buyer must verify the information and bears all risk for any inaccuracies. Any projections, opinions, assumptions or estimates used herein are for example purposes only
                            and do not represent the current or future performance of the property. Marcus & Millichap Real Estate Investment Services is a service mark of Marcus & Millichap Real Estate Investment Services, Inc.
                             © 2017 Marcus & Millichap
INVESTMENT OVERVIEW: BATAVIA, NY EXECUTIVE SUMMARY
4140 VETERANS MEMORIAL DR., BATAVIA, NY 14020
The subject property is a 35,413-square foot Walmart shadow anchored multi-
tenant retail center in Batavia, New York. The center is currently 100 percent
occupied, and all leases are triple net. Anchored by Peebles, other tenants
include Jagged Edge, Pawn King, Yume Asian Bistro, CATO, Shoe Show,
Cricket Wireless, H & R Block, and a nail salon. The building was constructed
in 2007 and is situated on 3.7 acres with ample paved parking.
The subject property is located on Veterans Memorial Drive in a retail trade
area directly south of Interstate 90. Numerous national and regional retailers
are in the surrounding area, including K Mart, Office Max, Kohl’s, Marshalls,
Dick’s Sporting Goods, Michael’s, PetCo, Target, CVS, The Home Depot,
Five Below, Bed Bath & Beyond, Tops Markets, Rite Aid, Sears, BJ’s grocery,
Applebee’s, Subway, Maurice’s, UPS Store, and many others. Batavia Downs
Gaming Center is directly east of the property, consisting of a racetrack,
gaming, restaurant and hotel. • Walmart Shadow Anchored Retail Center
Batavia is the county seat of Genesee County in western New York, surrounded • 100% Occupied | All Leases are Triple Net
by the Town of Batavia, which is a separate municipality. The New York State • Anchored by Peebles Department Store
Thruway (Interstate 90) passes north of the city; other major State routes
• 82% of the GLA has National Credit Tenants
serving the Batavia area are routes 98, 33, 5, and 63. The Genesee County
Airport (GVQ) is also north of the city. For commercial flight options, the City • Located in a Dense Retail Trade Area Directly South of I-90
of Batavia is approximately 30 minutes east of Buffalo Niagara International • Batavia is Located in Western New York, Between Buffalo and
Airport, 35 minutes west of Greater Rochester International Airport, and 45 Rochester
minutes East of Niagara Falls Airport.
This information has been secured from sources we believe to be reliable, but we make no representations or warranties, expressed or implied, as to the accuracy of the information. References to square
footage or age are approximate. Buyer must verify the information and bears all risk for any inaccuracies. Any projections, opinions, assumptions or estimates used herein are for example purposes only
and do not represent the current or future performance of the property. Marcus & Millichap Real Estate Investment Services is a service mark of Marcus & Millichap Real Estate Investment Services, Inc.
© 2017 Marcus & MillichapFINANCING & EXPENSES: BATAVIA, NY FINANCIAL OVERVIEW
4140 VETERANS MEMORIAL DR., BATAVIA, NY 14020
EXPENSES CURRENT PER SF
REAL ESTATE TAXES $72,530 $2.05
INSURANCE $15,001 $0.42
CAM CURRENT PER SF
UTILITIES $7,977 $0.23
ROOF REPAIR $2,237 $0.06
LANDSCAPING $4,913 $0.14
PARKING LOT SWEEPING/LIGHTS $4,295 $0.12
FIRE ALARM MONITORING $619 $0.02
FLS TESTING & REPAIR $454 $0.01
FIRE ALARM TELEPHONE $822 $0.02
ADMINISTRATIVE FEES $2,926 $0.08
SNOW REMOVAL $14,294 $0.40
TOTAL CAM $38,537 $1.09
MANAGEMENT FEE $20,000 $0.56
TOTAL EXPENSES $146,068 $4.12
This information has been secured from sources we believe to be reliable, but we make no representations or warranties, expressed or implied, as to the accuracy of the information. References to square
footage or age are approximate. Buyer must verify the information and bears all risk for any inaccuracies. Any projections, opinions, assumptions or estimates used herein are for example purposes only
and do not represent the current or future performance of the property. Marcus & Millichap Real Estate Investment Services is a service mark of Marcus & Millichap Real Estate Investment Services, Inc.
© 2017 Marcus & MillichapINCOME & EXPENSES: BATAVIA, NY FINANCIAL OVERVIEW
4140 VETERANS MEMORIAL DR., BATAVIA, NY 14020
INCOME & EXPENSES CURRENT PER SF
BASE RENT
OCCUPIED SPACE $347,974 $9.83
GROSS POTENTIAL RENT $347,974 $9.83
EXPENSE REIMBURSEMENT
REAL ESTATE TAXES $38,329 $1.08
INSURANCE $10,920 $0.31
CAM $35,972 $1.02
MANAGEMENT FEE $12,360 $0.35
REPLACEMENT RESERVES $11,397 $0.32
TOTAL EXPENSE REIMBURSEMENTS $108,978 $3.08
GROSS POTENTIAL INCOME $456,952 $12.90
VACANCY / COLLECTION ALLOWANCE (% OF GPI) 3% / $13,709 $0.39
EFFECTIVE GROSS INCOME $443,243 $12.52
TOTAL EXPENSES $146,068 $4.12
NET OPERATING INCOME $297,175 $8.39
This information has been secured from sources we believe to be reliable, but we make no representations or warranties, expressed or implied, as to the accuracy of the information. References to square
footage or age are approximate. Buyer must verify the information and bears all risk for any inaccuracies. Any projections, opinions, assumptions or estimates used herein are for example purposes only
and do not represent the current or future performance of the property. Marcus & Millichap Real Estate Investment Services is a service mark of Marcus & Millichap Real Estate Investment Services, Inc.
© 2017 Marcus & MillichapTENANT SUMMARY: BATAVIA, NY FINANCIAL OVERVIEW
4140 VETERANS MEMORIAL DR., BATAVIA, NY 14020
LEASE TERM ANNUAL BASE RENT ESCALATIONS
TENANT GLA % OF GLA BEGIN END TOTAL PSF CHANGES TOTAL REIMBURSED OPTIONS TYPE
JAGGED EDGE
1,200 3.39% 6/01/11 8/31/19 $22,800.00 $19.00 $5,977.32 1, 3-YR NNN
HAIR SALON
PAWN KING 1,600 4.52% 7/01/10 6/30/20 $28,160.04 $17.60 $7,969.79 None NNN
YUME ASIAN
2,400 6.78% 11/22/13 11/20/23 $36,000.00 $15.00 11/01/18 $36,720.00 $10,895.85 2, 5-Yr NNN
BISTRO
11/01/19 $37,464.00
11/01/20 $38,208.00
11/01/21 $38,976.00
11/01/22 $39,744.00
*CATO 3,600 10.17% 6/01/08 1/31/18 $12,000.00 $3.33 1,1-Yr NNN
SHOE SHOW 4,480 12.65% 11/25/08 11/30/18 $49,280.04 $11.00 $18,284.56 1, 5-Yr NNN
PEEBLES 18,133 51.20% 11/13/08 1/31/19 $135,997.56 $7.50 $45,927.36 4, 5-Yr NNN
LAM NAIL SALON 1,200 3.39% 4/20/13 4/30/18 $18,000.00 $15.00 $5,977.32 2, 5-Yr NNN
CRICKET WIRELESS 1,200 3.39% 11/01/15 10/31/18 $19,800.00 $16.50 $5,977.32 None NNN
H & R BLOCK 1,600 4.52% 7/01/15 6/30/20 $25,936.00 $16.21 $7,969.76 1, 5-Yr NNN
TOTAL VACANT
TOTAL OCCUPIED 35,413 100.00% $347,973.64 $108,979.20
TOTAL 35,413 100.00% $347,973.64 $108,979.20
*CATO’s rent is an amount equal to 5% of all gross retail sales made from the Premises each month, payable within 30 days after the end of each month.
**Total Annual Rent is based on the future base rent of $347,973 as of 11/01/17.
This information has been secured from sources we believe to be reliable, but we make no representations or warranties, expressed or implied, as to the accuracy of the information. References to square
footage or age are approximate. Buyer must verify the information and bears all risk for any inaccuracies. Any projections, opinions, assumptions or estimates used herein are for example purposes only
and do not represent the current or future performance of the property. Marcus & Millichap Real Estate Investment Services is a service mark of Marcus & Millichap Real Estate Investment Services, Inc.
© 2017 Marcus & MillichapLEASE EXPIRATION SCHEDULE: BATAVIA, NY FINANCIAL OVERVIEW
4140 VETERANS MEMORIAL DR., BATAVIA, NY 14020
YEAR 1 YEAR 2 YEAR 3 YEAR 4 YEAR 5 YEAR 6 YEAR 7 YEAR 8
YEAR END 2017 2018 2019 2020 2021 2022 2023 2024
JAGGED
YUME ASIAN
TENANT NAME CATO EDGE PAWN KING
BISTRO
HAIR SALON
SHOE SHOW PEEBLES H&R BLOCK
LAM NAIL
SALON
CRICKET
WIRELESS
TOTAL NO.
4 2 2 1
OF TENANTS
TOTAL SQ. FT.
10,480 19,333 3,200 2,400
EXPIRING
TOTAL % 29.6% 54.6% 9.0% 6.8%
CUMULATIVE %
29.6% 84.2% 93.2% 100.0%
EXPIRING
This information has been secured from sources we believe to be reliable, but we make no representations or warranties, expressed or implied, as to the accuracy of the information. References to square
footage or age are approximate. Buyer must verify the information and bears all risk for any inaccuracies. Any projections, opinions, assumptions or estimates used herein are for example purposes only
and do not represent the current or future performance of the property. Marcus & Millichap Real Estate Investment Services is a service mark of Marcus & Millichap Real Estate Investment Services, Inc.
© 2017 Marcus & MillichapLOCAL MAP: BATAVIA, NY PROPERTY OVERVIEW
This information has been secured from sources we believe to be reliable, but we make no representations or warranties, expressed or implied, as to the accuracy of the information. References to square
footage or age are approximate. Buyer must verify the information and bears all risk for any inaccuracies. Any projections, opinions, assumptions or estimates used herein are for example purposes only
and do not represent the current or future performance of the property. Marcus & Millichap Real Estate Investment Services is a service mark of Marcus & Millichap Real Estate Investment Services, Inc.
© 2017 Marcus & MillichapREGIONAL MAP: BATAVIA, NY PROPERTY OVERVIEW
This information has been secured from sources we believe to be reliable, but we make no representations or warranties, expressed or implied, as to the accuracy of the information. References to square
footage or age are approximate. Buyer must verify the information and bears all risk for any inaccuracies. Any projections, opinions, assumptions or estimates used herein are for example purposes only
and do not represent the current or future performance of the property. Marcus & Millichap Real Estate Investment Services is a service mark of Marcus & Millichap Real Estate Investment Services, Inc.
© 2017 Marcus & MillichapAERIAL MAP: BATAVIA, NY PROPERTY OVERVIEW
Oak
Le
wi
sto
Stree
n Ro
t
SUBJECT PROPERTY
da
W. Main Roa
d
This information has been secured from sources we believe to be reliable, but we make no representations or warranties, expressed or implied, as to the accuracy of the information. References to square
footage or age are approximate. Buyer must verify the information and bears all risk for any inaccuracies. Any projections, opinions, assumptions or estimates used herein are for example purposes only
and do not represent the current or future performance of the property. Marcus & Millichap Real Estate Investment Services is a service mark of Marcus & Millichap Real Estate Investment Services, Inc.
© 2017 Marcus & MillichapAERIAL PHOTO: BATAVIA, NY PROPERTY OVERVIEW
This information has been secured from sources we believe to be reliable, but we make no representations or warranties, expressed or implied, as to the accuracy of the information. References to square
footage or age are approximate. Buyer must verify the information and bears all risk for any inaccuracies. Any projections, opinions, assumptions or estimates used herein are for example purposes only
and do not represent the current or future performance of the property. Marcus & Millichap Real Estate Investment Services is a service mark of Marcus & Millichap Real Estate Investment Services, Inc.
© 2017 Marcus & MillichapSITE PLAN: BATAVIA, NY PROPERTY OVERVIEW
Leased
Working LOI
Available
Jagged Edges Hair
Yume Asian
BL Nail Salon
Salon 1,200 SF
Paw N’ King
1,200 SF
2,400 SF
4,480 SF
1,600 SF
3,600 SF
Bistro
1,600 SF
1,200 SF
18,000 SF
This information has been secured from sources we believe to be reliable, but we make no representations or warranties, expressed or implied, as to the accuracy of the information. References to square
footage or age are approximate. Buyer must verify the information and bears all risk for any inaccuracies. Any projections, opinions, assumptions or estimates used herein are for example purposes only
and do not represent the current or future performance of the property. Marcus & Millichap Real Estate Investment Services is a service mark of Marcus & Millichap Real Estate Investment Services, Inc.
© 2017 Marcus & MillichapDEMOGRAPHIC DATA: BATAVIA, NY MARKET OVERVIEW
4140 VETERANS MEMORIAL DR., BATAVIA, NY 14020
POPULATION 1-MILE 3-MILES 5-MILES HOUSEHOLDS
2000 POPULATION 4,122 19,063 25,056 2000 HOUSEHOLDS 1,456 7,503 9,876
2010 POPULATION 4,288 18,726 25,205 2010 HOUSEHOLDS 1,508 7,731 10,239
2014 POPULATION 4,279 18,692 25,199 2014 HOUSEHOLDS 1,495 7,684 10,193
2019 POPULATION 4,283 18,770 25,358 2019 HOUSEHOLDS 1,516 7,788 10,349
INCOME 2014 AVERAGE HH SIZE 2.27 2.25 2.31
$0 - $14,999 16.3% 19.0% 16.8% 2014 DAYTIME POPULATION 2,276 11,790 13,582
$15,000 - $24,999 16.2% 14.7% 14.0% 2000 OWNER OCCUPIED 64.04% 55.63% 60.42%
$25,000 - $34,999 11.3% 12.6% 12.8% 2000 RENTER OCCUPIED 30.46% 37.87% 32.92%
$35,000 - $49,999 14.0% 14.8% 15.8% 2000 VACANT 5.50% 6.50% 6.66%
$50,000 - $74,999 23.0% 19.8% 20.2% 2014 OWNER OCCUPIED 60.63% 54.81% 60.90%
$75,000 - $99,999 8.6% 9.1% 9.7% 2014 RENTER OCCUPIED 39.37% 45.19% 39.10%
$100,000 - $124,999 4.5% 4.2% 4.5% 2014 VACANT 6.03% 8.02% 7.98%
$125,000 - $149,999 2.5% 2.6% 2.6% 2019 OWNER OCCUPIED 60.58% 54.60% 60.73%
$150,000 - $199,999 2.6% 2.2% 2.4% 2019 RENTER OCCUPIED 39.42% 45.40% 39.27%
$200,000 - $249,999 0.6% 0.4% 0.5% 2019 VACANT 6.17% 8.26% 8.21%
$250,000 + 0.6% 0.7% 0.8%
2014 MEDIAN HH INCOME $40,101 $38,233 $40,523
2014 PER CAPITA INCOME $19,294 $21,865 $22,564
2014 AVERAGE HH INCOME $52,616 $51,230 $53,547
This information has been secured from sources we believe to be reliable, but we make no representations or warranties, expressed or implied, as to the accuracy of the information. References to square
footage or age are approximate. Buyer must verify the information and bears all risk for any inaccuracies. Any projections, opinions, assumptions or estimates used herein are for example purposes only
and do not represent the current or future performance of the property. Marcus & Millichap Real Estate Investment Services is a service mark of Marcus & Millichap Real Estate Investment Services, Inc.
© 2017 Marcus & MillichapDEMOGRAPHIC SUMMARY: BATAVIA, NY MARKET OVERVIEW
4140 VETERANS MEMORIAL DR., BATAVIA, NY 14020
POPULATION RACE & ETHNICITY
In 2014, the population in your selected geography is 25,198. The population The current year racial makeup of your selected area is as follows: 88.73%
has changed by 0.57% since 2000. It is estimated that the population in your White, 5.79% Black, 0.01% Native American and 1.08% Asian/Pacific
area will be 25,358 five years from now, which represents a change of 0.63% Islander. Compare these to Entire US averages which are: 71.60% White,
from the current year. The current population is 49.26% male and 50.73% 12.70% Black, 0.18% Native American and 5.02% Asian/Pacific Islander.
female. The median age of the population in your area is 40.8, compare this
to the Entire US average which is 37.3. The population density in your area is People of Hispanic origin are counted independently of race. People of
320.13 people per square mile. Hispanic origin make up 3.57% of the current year population in your
selected area. Compare this to the Entire US average of 17.13%.
HOUSEHOLDS
There are currently 10,193 households in your selected geography. The HOUSING
number of households has changed by 3.21% since 2000. It is estimated In 2000, there were 6,392 owner occupied housing units in your area and
that the number of households in your area will be 10,349 five years from there were 3,483 renter occupied housing units in your area. The median
now, which represents a change of 1.52% from the current year. The average rent at the time was $438.
household size in your area is 2.31 persons.
EMPLOYMENT
INCOME In 2014, there are 13,581 employees in your selected area, this is also
In 2014, the median household income for your selected geography is known as the daytime population. The 2000 Census revealed that 54.09% of
$40,523, compare this to the Entire US average which is currently $51,972. employees are employed in white-collar occupations in this geography, and
The median household income for your area has changed by 13.47% since 45.94% are employed in blue-collar occupations. In 2014, unemployment
2000. It is estimated that the median household income in your area will be in this area is 8.55%. In 2000, the average time traveled to work was 20.8
$46,758 five years from now, which represents a change of 15.38% from the minutes.
current year.
The current year per capita income in your area is $22,564, compare this to
the Entire US average, which is $28,599. The current year average household
income in your area is $53,546, compare this to the Entire US average which
is $74,533.
This information has been secured from sources we believe to be reliable, but we make no representations or warranties, expressed or implied, as to the accuracy of the information. References to square
footage or age are approximate. Buyer must verify the information and bears all risk for any inaccuracies. Any projections, opinions, assumptions or estimates used herein are for example purposes only
and do not represent the current or future performance of the property. Marcus & Millichap Real Estate Investment Services is a service mark of Marcus & Millichap Real Estate Investment Services, Inc.
© 2017 Marcus & Millichap2 GATESVILLE, TX
319 TX-BUSINESS 36OFFERING HIGHLIGHTS: GATESVILLE, TX EXECUTIVE SUMMARY
319 TX-BUSINESS 36, GATESVILLE, TX 76528
SUMMARY MAJOR EMPLOYERS
NOI - CURRENT $269,754 MOUNTAIN VIEW UNIT 850
PERCENT OCCUPIED 100% HUGHES PRISON 800
GROSS LEASABLE AREA (GLA) (SQ.FT.) 20,561 GATESVILLE UNIT 600
LAND AREA (ACRES) 5.0 HILLTOP UNIT 350
YEAR BUILT 2007 WOODMAN STATE JAIL 296
CORYELL MEMORIAL HOSPITAL 230
COUNTY OF CORYELL 160
DEMOGRAPHICS 1-MILE 3-MILES 5-MILES MEDICAL PLASTICS LABORATORY 141
2014 POPULATION 2,904 10,875 19,815 TTG UTILITIES LP 137
2019 POPULATION 2,994 11,231 20,219 TEXAS NATIONAL GUARD 135
2014 HOUSEHOLDS 1,173 3,756 4,489 KALYN SIEBERT 125
2019 HOUSEHOLDS 1,216 3,921 4,679 HEB FOOD STORE 403 107
MEDIAN HH INCOME $46,101 $49,433 $49,309
PER CAPITA HH INCOME $23,382 $22,401 $18,435
AVERAGE HH INCOME $57,453 $57,954 $58,640
This information has been secured from sources we believe to be reliable, but we make no representations or warranties, expressed or implied, as to the accuracy of the information. References to square
footage or age are approximate. Buyer must verify the information and bears all risk for any inaccuracies. Any projections, opinions, assumptions or estimates used herein are for example purposes only
and do not represent the current or future performance of the property. Marcus & Millichap Real Estate Investment Services is a service mark of Marcus & Millichap Real Estate Investment Services, Inc.
© 2017 Marcus & MillichapINVESTMENT OVERVIEW: GATESVILLE, TX EXECUTIVE SUMMARY
319 TX-BUSINESS 36, GATESVILLE, TX 76528
The subject property is a 20,561-square foot Walmart shadow anchored multi-
tenant retail center in Gatesville, Texas. The center is 100 percent occupied,
and all leases are triple-net. Anchored by Dollar Tree, other tenants include
Baylor Scott & White, New Rodeo Restaurant, Avani Dentist, Little Caesar’s
Pizza, and Russell Cellular. Constructed in 2007, the buildings are situated
on five acres.
The subject property is located on Texas Highway 36 at the intersection with
Main Street. Neighboring national and regional retailers include Aaron’s, The
Shoe Dept., Walgreens, Burger King, Holiday Inn Express & Suites, The Last
Drive-In Picture Show, Dollar General, Higginbotham’s, Pizza Hut, Subway,
Bealls, Tractor Supply Company, and others. The five mile population is
19,815 with an average household income of $58,640.
Gatesville is the county seat of Coryell County. Gatesville is part of the • Walmart Shadow Anchored Retail Center
Killeen–Temple–Fort Hood Metropolitan Statistical Area. It is located 30 miles
from Waco, midway between Austin and Fort Worth. Gatesville is the home • 100% Occupied | All Leases are Triple Net
of several prisons operated by the Texas Department of Criminal Justice, • Anchored by Dollar Tree
employing over 2,600 people. Gatesville is located on the northern edge
• Located on Texas Highway 36 at the Intersection with Main Street
of Fort Hood, and as such is also dependent on the military for a part of its
economy. • Gatesville is Part of the Killeen-Temple-Fort Hood MSA
• Located Midway Between Austin and Fort Worth
• The City is on the Northern Edge of Fort Hood Military Base
This information has been secured from sources we believe to be reliable, but we make no representations or warranties, expressed or implied, as to the accuracy of the information. References to square
footage or age are approximate. Buyer must verify the information and bears all risk for any inaccuracies. Any projections, opinions, assumptions or estimates used herein are for example purposes only
and do not represent the current or future performance of the property. Marcus & Millichap Real Estate Investment Services is a service mark of Marcus & Millichap Real Estate Investment Services, Inc.
© 2017 Marcus & MillichapFINANCING & EXPENSES: GATESVILLE, TX FINANCIAL OVERVIEW
319 TX-BUSINESS 36, GATESVILLE, TX 76528
EXPENSES CURRENT PER SF
REAL ESTATE TAXES $53,999 $2.63
INSURANCE $4,161 $0.20
CAM CURRENT PER SF
UTILITIES $3,081 $0.15
ROOF REPAIR $963 $0.05
LANDSCAPING $6,120 $0.30
PORTER SERVICE $1,800 $0.09
FIRE ALARM MONITORING $325 $0.02
FLS TESTING & REPAIR $1,516 $0.07
FIRE ALARM TELEPHONE $1,697 $0.08
ADMINISTRATIVE FEES $2,263 $0.11
TOTAL CAM $17,765 $0.86
MANAGEMENT FEE $15,000 $0.73
TOTAL EXPENSES $90,925 $4.42
This information has been secured from sources we believe to be reliable, but we make no representations or warranties, expressed or implied, as to the accuracy of the information. References to square
footage or age are approximate. Buyer must verify the information and bears all risk for any inaccuracies. Any projections, opinions, assumptions or estimates used herein are for example purposes only
and do not represent the current or future performance of the property. Marcus & Millichap Real Estate Investment Services is a service mark of Marcus & Millichap Real Estate Investment Services, Inc.
© 2017 Marcus & MillichapINCOME & EXPENSES: GATESVILLE, TX FINANCIAL OVERVIEW
319 TX-BUSINESS 36, GATESVILLE, TX 76528
INCOME & EXPENSES CURRENT PER SF
BASE RENT
OCCUPIED SPACE $283,700 $13.80
GROSS POTENTIAL RENT $283,700 $13.80
EXPENSE REIMBURSEMENT
REAL ESTATE TAXES $53,999 $2.63
INSURANCE $3,805 $0.19
CAM $12,128 $0.59
MANAGEMENT FEE $10,068 $0.49
REPLACEMENT RESERVES $8,134 $0.40
TOTAL EXPENSE REIMBURSEMENTS $88,134 $4.29
GROSS POTENTIAL INCOME $371,834 $18.08
VACANCY / COLLECTION ALLOWANCE (% OF GPI) 3% / $11,155 $0.54
EFFECTIVE GROSS INCOME $360,679 $17.54
TOTAL EXPENSES $90,925 $4.42
NET OPERATING INCOME $269,754 $13.12
This information has been secured from sources we believe to be reliable, but we make no representations or warranties, expressed or implied, as to the accuracy of the information. References to square
footage or age are approximate. Buyer must verify the information and bears all risk for any inaccuracies. Any projections, opinions, assumptions or estimates used herein are for example purposes only
and do not represent the current or future performance of the property. Marcus & Millichap Real Estate Investment Services is a service mark of Marcus & Millichap Real Estate Investment Services, Inc.
© 2017 Marcus & MillichapTENANT SUMMARY: GATESVILLE, TX FINANCIAL OVERVIEW
319 TX-BUSINESS 36, GATESVILLE, TX 76528
LEASE TERM ANNUAL BASE RENT ESCALATIONS
% OF
TENANT GLA BEGIN END TOTAL PSF CHANGES TOTAL REIMBURSED OPTIONS TYPE
GLA
RUSSELL
1,600 7.78% 11/01/08 9/30/17 $30,880.00 $19.30 $8,256.64 None NNN
CELLULAR
LITTLE
1,600 7.78% 12/01/16 2/28/22 $19,200.00 $12.00 $8,354.07 3, 5-Yr NNN
CAESARS PIZZA
AVANI DENTIST 1,600 7.78% 5/25/13 5/31/23 $24,000.00 $15.00 6/01/21 $24,800.00 $7,712.34 2, 5-Yr NNN
DOLLAR TREE 8,000 38.91% 9/05/13 9/30/18 $62,000.04 $7.75 $29,482.54 3, 5-Yr NNN
RODEO
2,761 13.43% 3/08/11 12/31/20 $37,620.00 $13.63 $10,997.64 None NNN
RESTAURANT
BAYLOR SCOTT &
5,000 24.32% 7/01/15 10/31/25 $110,000.04 $22.00 $23,330.64 2, 5-Yr NNN
WHITE
TOTAL VACANT
TOTAL OCCUPIED 20,561 100.00% $283,700.08 $88,133.87
TOTAL 20,561 100.00% $283,700.08 $88,133.87
*Total Annual Rent is based on the future base rent of $283,700 as of 6/01/18.
This information has been secured from sources we believe to be reliable, but we make no representations or warranties, expressed or implied, as to the accuracy of the information. References to square
footage or age are approximate. Buyer must verify the information and bears all risk for any inaccuracies. Any projections, opinions, assumptions or estimates used herein are for example purposes only
and do not represent the current or future performance of the property. Marcus & Millichap Real Estate Investment Services is a service mark of Marcus & Millichap Real Estate Investment Services, Inc.
© 2017 Marcus & MillichapLEASE EXPIRATION SCHEDULE: GATESVILLE, TX FINANCIAL OVERVIEW
319 TX-BUSINESS 36, GATESVILLE, TX 76528
YEAR 1 YEAR 2 YEAR 3 YEAR 4 YEAR 5 YEAR 6 YEAR 7 YEAR 8 YEAR 9
YEAR END 2017 2018 2019 2020 2021 2022 2023 2024 2025
LITTLE BAYLOR
RUSSELL DOLLAR RODEO AVANTI
TENANT NAME CAESARS SCOTT &
CELLULAR TREE RESTAURANT DENTIST
PIZZA WHITE
TOTAL NO.
1 1 1 1 1 1
OF TENANTS
TOTAL SQ. FT.
1,600 8,000 2,761 1,600 1,600 5,000
EXPIRING
TOTAL % 7.8% 38.9% 13.4% 7.8% 7.8% 24.3%
CUMULATIVE %
7.8% 46.7% 60.1% 67.9% 75.7% 100.0%
EXPIRING
This information has been secured from sources we believe to be reliable, but we make no representations or warranties, expressed or implied, as to the accuracy of the information. References to square
footage or age are approximate. Buyer must verify the information and bears all risk for any inaccuracies. Any projections, opinions, assumptions or estimates used herein are for example purposes only
and do not represent the current or future performance of the property. Marcus & Millichap Real Estate Investment Services is a service mark of Marcus & Millichap Real Estate Investment Services, Inc.
© 2017 Marcus & MillichapLOCAL MAP: GATESVILLE, TX PROPERTY OVERVIEW
This information has been secured from sources we believe to be reliable, but we make no representations or warranties, expressed or implied, as to the accuracy of the information. References to square
footage or age are approximate. Buyer must verify the information and bears all risk for any inaccuracies. Any projections, opinions, assumptions or estimates used herein are for example purposes only
and do not represent the current or future performance of the property. Marcus & Millichap Real Estate Investment Services is a service mark of Marcus & Millichap Real Estate Investment Services, Inc.
© 2017 Marcus & MillichapREGIONAL MAP: GATESVILLE, TX PROPERTY OVERVIEW
This information has been secured from sources we believe to be reliable, but we make no representations or warranties, expressed or implied, as to the accuracy of the information. References to square
footage or age are approximate. Buyer must verify the information and bears all risk for any inaccuracies. Any projections, opinions, assumptions or estimates used herein are for example purposes only
and do not represent the current or future performance of the property. Marcus & Millichap Real Estate Investment Services is a service mark of Marcus & Millichap Real Estate Investment Services, Inc.
© 2017 Marcus & MillichapAERIAL MAP: GATESVILLE, TX PROPERTY OVERVIEW
McDonald’s
GATESVILLE
HIGH SCHOOL
36
Ma
in S
tree
t
Walgreens SUBJECT PROPERTY
This information has been secured from sources we believe to be reliable, but we make no representations or warranties, expressed or implied, as to the accuracy of the information. References to square
footage or age are approximate. Buyer must verify the information and bears all risk for any inaccuracies. Any projections, opinions, assumptions or estimates used herein are for example purposes only
and do not represent the current or future performance of the property. Marcus & Millichap Real Estate Investment Services is a service mark of Marcus & Millichap Real Estate Investment Services, Inc.
© 2017 Marcus & MillichapAERIAL PHOTO: GATESVILLE, TX PROPERTY OVERVIEW
This information has been secured from sources we believe to be reliable, but we make no representations or warranties, expressed or implied, as to the accuracy of the information. References to square
footage or age are approximate. Buyer must verify the information and bears all risk for any inaccuracies. Any projections, opinions, assumptions or estimates used herein are for example purposes only
and do not represent the current or future performance of the property. Marcus & Millichap Real Estate Investment Services is a service mark of Marcus & Millichap Real Estate Investment Services, Inc.
© 2017 Marcus & MillichapSITE PLAN: GATESVILLE, TX PROPERTY OVERVIEW
Leased
Working LOI
Available
1,600 SF
Axis Dental
Rodeo Restaurant
3,000 SF
5,000 SF
Pad Site Available
+/-35,000 SF
8,000 SF
This information has been secured from sources we believe to be reliable, but we make no representations or warranties, expressed or implied, as to the accuracy of the information. References to square
footage or age are approximate. Buyer must verify the information and bears all risk for any inaccuracies. Any projections, opinions, assumptions or estimates used herein are for example purposes only
and do not represent the current or future performance of the property. Marcus & Millichap Real Estate Investment Services is a service mark of Marcus & Millichap Real Estate Investment Services, Inc.
© 2017 Marcus & MillichapDEMOGRAPHIC DATA: GATESVILLE, TX MARKET OVERVIEW
319 TX-BUSINESS 36, GATESVILLE, TX 76528
POPULATION 1-MILE 3-MILES 5-MILES HOUSEHOLDS 1-MILE 3-MILES 5-MILES
2000 POPULATION 2,952 13,903 19,729 2000 HOUSEHOLDS 965 3,042 3,774
2010 POPULATION 2,713 10,347 19,016 2010 HOUSEHOLDS 1,092 3,539 4,216
2014 POPULATION 2,904 10,875 19,815 2014 HOUSEHOLDS 1,173 3,756 4,489
2019 POPULATION 2,994 11,231 20,219 2019 HOUSEHOLDS 1,216 3,921 4,679
INCOME 2014 AVERAGE HH SIZE 2.46 2.53 2.52
$0 - $14,999 10.9% 12.7% 11.9% 2014 DAYTIME POPULATION 1,208 4,607 8,262
$15,000 - $24,999 10.3% 10.6% 12.6% 2000 OWNER OCCUPIED 62.44% 62.28% 62.53%
$25,000 - $34,999 15.6% 12.8% 12.0% 2000 RENTER OCCUPIED 30.54% 28.16% 27.83%
$35,000 - $49,999 15.1% 14.3% 14.0% 2000 VACANT 7.02% 9.57% 9.64%
$50,000 - $74,999 26.4% 24.6% 24.3% 2014 OWNER OCCUPIED 60.77% 64.58% 65.02%
$75,000 - $99,999 11.6% 13.4% 12.8% 2014 RENTER OCCUPIED 39.23% 35.42% 34.98%
$100,000 - $124,999 6.4% 6.3% 6.3% 2014 VACANT 6.32% 8.61% 8.89%
$125,000 - $149,999 1.5% 2.7% 2.7% 2019 OWNER OCCUPIED 60.33% 64.53% 65.03%
$150,000 - $199,999 0.7% 1.3% 2.2% 2019 RENTER OCCUPIED 39.67% 35.47% 34.97%
$200,000 - $249,999 0.5% 0.5% 0.6% 2019 VACANT 6.05% 8.44% 8.75%
$250,000 + 0.9% 0.8% 0.8%
2014 MEDIAN HH INCOME $46,101 $49,433 $49,309
2014 PER CAPITA INCOME $23,382 $22,401 $18,435
2014 AVERAGE HH INCOME $57,453 $57,954 $58,640
This information has been secured from sources we believe to be reliable, but we make no representations or warranties, expressed or implied, as to the accuracy of the information. References to square
footage or age are approximate. Buyer must verify the information and bears all risk for any inaccuracies. Any projections, opinions, assumptions or estimates used herein are for example purposes only
and do not represent the current or future performance of the property. Marcus & Millichap Real Estate Investment Services is a service mark of Marcus & Millichap Real Estate Investment Services, Inc.
© 2017 Marcus & MillichapDEMOGRAPHIC SUMMARY: GATESVILLE, TX MARKET OVERVIEW
319 TX-BUSINESS 36, GATESVILLE, TX 76528
POPULATION RACE & ETHNICITY
In 2014, the population in your selected geography is 19,815. The population The current year racial makeup of your selected area is as follows: 73.64%
has changed by 0.43% since 2000. It is estimated that the population in your White, 17.08% Black, 0.02% Native American and 0.47% Asian/Pacific
area will be 20,219 five years from now, which represents a change of 2.03% Islander. Compare these to Entire US averages which are: 71.60% White,
from the current year. The current population is 43.14% male and 56.85% 12.70% Black, 0.18% Native American and 5.02% Asian/Pacific Islander.
female. The median age of the population in your area is 37.8, compare this
to the Entire US average which is 37.3. The population density in your area is People of Hispanic origin are counted independently of race. People of
252.39 people per square mile. Hispanic origin make up 17.47% of the current year population in your
selected area. Compare this to the Entire US average of 17.13%.
HOUSEHOLDS
There are currently 4,489 households in your selected geography. The number HOUSING
of households has changed by 18.94% since 2000. It is estimated that the In 2000, there were 2,611 owner occupied housing units in your area and
number of households in your area will be 4,678 five years from now, which there were 1,162 renter occupied housing units in your area. The median
represents a change of 4.22% from the current year. The average household rent at the time was $317.
size in your area is 2.52 persons.
EMPLOYMENT
INCOME In 2014, there are 8,262 employees in your selected area, this is also known
In 2014, the median household income for your selected geography is as the daytime population. The 2000 Census revealed that 49.27% of
$49,308, compare this to the Entire US average which is currently $51,972. employees are employed in white-collar occupations in this geography, and
The median household income for your area has changed by 49.66% since 49.61% are employed in blue-collar occupations. In 2014, unemployment
2000. It is estimated that the median household income in your area will be in this area is 5.77%. In 2000, the average time traveled to work was 18.3
$63,662 five years from now, which represents a change of 29.10% from the minutes.
current year.
The current year per capita income in your area is $18,434, compare this to
the Entire US average, which is $28,599. The current year average household
income in your area is $58,640, compare this to the Entire US average which
is $74,533.
This information has been secured from sources we believe to be reliable, but we make no representations or warranties, expressed or implied, as to the accuracy of the information. References to square
footage or age are approximate. Buyer must verify the information and bears all risk for any inaccuracies. Any projections, opinions, assumptions or estimates used herein are for example purposes only
and do not represent the current or future performance of the property. Marcus & Millichap Real Estate Investment Services is a service mark of Marcus & Millichap Real Estate Investment Services, Inc.
© 2017 Marcus & Millichap3 HUGO, OK
1601-1623 E. JACKSON ST.OFFERING HIGHLIGHTS: HUGO, OK EXECUTIVE SUMMARY
1601-1623 E. JACKSON ST., HUGO, OK 74743
SUMMARY MAJOR EMPLOYERS
NOI - CURRENT $245,005 WALMART 300
PERCENT OCCUPIED 95.40% CHOCTAW MFG & DEV CORP 160
GROSS LEASABLE AREA (GLA) (SQ.FT.) 87,477 CARSON & BARNES CIRCUS COMPANY 150
LAND AREA (ACRES) 5.88 CHOCTAW MEMORIAL HOSPITAL 138
YEAR BUILT 1975 BAPTIST VILLAGE COMMUNITY 100
CHOCTAW NATION FINISHING CO 100
AL G KELLY 95
DEMOGRAPHICS 1-MILE 3-MILES 5-MILES KIAMICHI RAILROAD 93
2014 POPULATION 1,399 6,209 7,401 CARSON AND BARNES CIRCUS 80
2019 POPULATION 1,382 6,080 7,268 KIAMICHI DEVELOPMENT COMPANY 78
2014 HOUSEHOLDS 685 2,609 3,086 KIAMICHI RAILROAD COMPANY 77
2019 HOUSEHOLDS 675 2,565 3,048 ARMY NATIONAL GUARD THE 70
MEDIAN HH INCOME $26,528 $26,404 $27,292
PER CAPITA HH INCOME $17,207 $15,484 $16,151
AVERAGE HH INCOME $34,814 $36,116 $38,111
This information has been secured from sources we believe to be reliable, but we make no representations or warranties, expressed or implied, as to the accuracy of the information. References to square
footage or age are approximate. Buyer must verify the information and bears all risk for any inaccuracies. Any projections, opinions, assumptions or estimates used herein are for example purposes only
and do not represent the current or future performance of the property. Marcus & Millichap Real Estate Investment Services is a service mark of Marcus & Millichap Real Estate Investment Services, Inc.
© 2017 Marcus & MillichapINVESTMENT OVERVIEW: HUGO, OK EXECUTIVE SUMMARY
1601-1623 E. JACKSON ST., HUGO, OK 74743
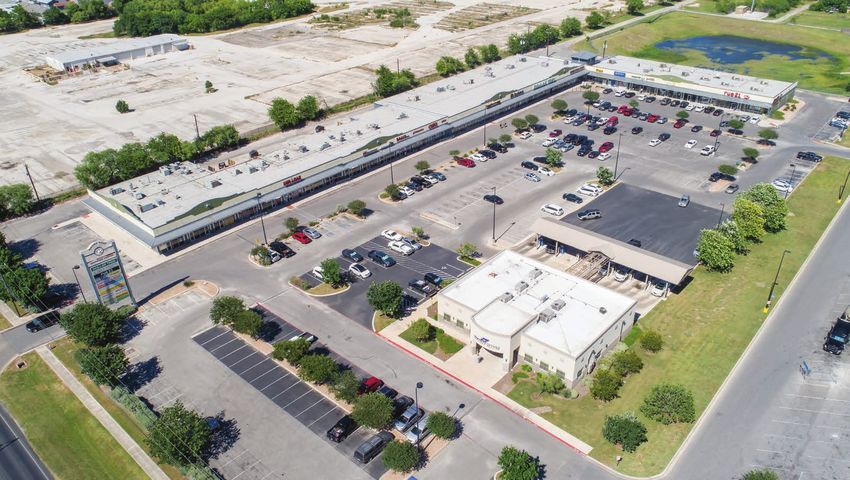
The subject property is an 87,477-square foot Walmart shadow anchored multi-
tenant retail center in Hugo, Oklahoma. The center is 95 percent occupied,
providing upside potential in leasing the vacant space. Anchored by Orscheln
Farm & Home and Save-A-Lot grocery, tenants consist of Hibbett Sports, Just
a $1.00, Physical Therapy, Hugo Tag Agency, and Shelter Insurance. The
leases are a mix of gross and triple net. Built in 1975, the center is situated
on 5.88 acres.
The subject property is located on East Jackson Street, one of the city’s
major thoroughfares. Neighboring national and regional retailers include
McDonald’s, Dollar Tree, Anytime Fitness, Stage, Factory Connection, HiWay
Inn Express, KFC, Simple Simon’s Pizza, Sonic Drive-In, Pizza Hut, O’Reilly
Auto Parts, Subway, and others. Choctaw Memorial Hospital is about half of a
mile northwest of the property.
• Walmart Shadow Anchored Retail Center
Hugo is the county seat of Choctaw County, located in southeastern Oklahoma
about nine miles north of the Texas state line. Hugo serves as the southern • 95% Occupied | Upside Potential in Leasing Vacant Space
terminating point for the Indian Nation Turnpike. U.S. Highway 70 runs west • Mix of Gross and Triple Net Leases
to east through the city and connects Hugo to Durant 53 miles to the west and
• Anchored by Orscheln Farm & Home, Save-A-Lot and Just a $1.00
Idabel 43 miles to the east. U.S. Highway 271 runs south out of the city and
leads 26 miles to Paris, Texas. • Located on East Jackson Street | Major Thoroughfare
• Hugo is in Southeastern Oklahoma, About Nine Miles North of the
Texas State Line
This information has been secured from sources we believe to be reliable, but we make no representations or warranties, expressed or implied, as to the accuracy of the information. References to square
footage or age are approximate. Buyer must verify the information and bears all risk for any inaccuracies. Any projections, opinions, assumptions or estimates used herein are for example purposes only
and do not represent the current or future performance of the property. Marcus & Millichap Real Estate Investment Services is a service mark of Marcus & Millichap Real Estate Investment Services, Inc.
© 2017 Marcus & MillichapFINANCING & EXPENSES: HUGO, OK FINANCIAL OVERVIEW
1601-1623 E. JACKSON ST., HUGO, OK 74743
EXPENSES CURRENT PER SF
REAL ESTATE TAXES $21,005 $0.24
INSURANCE $15,090 $0.17
CAM CURRENT PER SF
UTILITIES $2,636 $0.03
ROOF REPAIR $4,028 $0.05
LANDSCAPING $3,046 $0.03
PARKING LOT SWEEPING/LIGHTS $11,304 $0.13
SIGNAGE $3,952 $0.05
TOTAL CAM $24,966 $0.29
MANAGEMENT FEE $13,500 $0.15
TOTAL EXPENSES $74,561 $0.85
This information has been secured from sources we believe to be reliable, but we make no representations or warranties, expressed or implied, as to the accuracy of the information. References to square
footage or age are approximate. Buyer must verify the information and bears all risk for any inaccuracies. Any projections, opinions, assumptions or estimates used herein are for example purposes only
and do not represent the current or future performance of the property. Marcus & Millichap Real Estate Investment Services is a service mark of Marcus & Millichap Real Estate Investment Services, Inc.
© 2017 Marcus & MillichapINCOME & EXPENSES: HUGO, OK FINANCIAL OVERVIEW
1601-1623 E. JACKSON ST., HUGO, OK 74743
INCOME & EXPENSES CURRENT PER SF
BASE RENT
OCCUPIED SPACE $267,263 $3.20
GROSS POTENTIAL RENT $267,263 $3.06
EXPENSE REIMBURSEMENT
REAL ESTATE TAXES $15,187 $0.17
INSURANCE $14,043 $0.16
CAM $18,345 $0.21
MANAGEMENT FEE $4,728 $0.05
TOTAL EXPENSE REIMBURSEMENTS $52,303 $0.60
GROSS POTENTIAL INCOME $319,566 $3.65
EFFECTIVE GROSS INCOME $319,566 $3.65
TOTAL EXPENSES $74,561 $0.85
NET OPERATING INCOME $245,005 $2.80
This information has been secured from sources we believe to be reliable, but we make no representations or warranties, expressed or implied, as to the accuracy of the information. References to square
footage or age are approximate. Buyer must verify the information and bears all risk for any inaccuracies. Any projections, opinions, assumptions or estimates used herein are for example purposes only
and do not represent the current or future performance of the property. Marcus & Millichap Real Estate Investment Services is a service mark of Marcus & Millichap Real Estate Investment Services, Inc.
© 2017 Marcus & MillichapTENANT SUMMARY: HUGO, OK FINANCIAL OVERVIEW
1601-1623 E. JACKSON ST., HUGO, OK 74743
LEASE TERM ANNUAL BASE RENT ESCALATIONS
TENANT GLA % OF GLA BEGIN END TOTAL PSF CHANGES TOTAL REIMBURSED OPTIONS TYPE
PHYSICAL
2,160 2.47% 2/01/02 MTM $11,028.00 $5.11 $1,322.43 NONE GROSS
THERAPY
HUGO TAG
1,400 1.60% 11/01/07 1/31/20 $6,900.00 $4.93 NONE GROSS
AGENCY
SHELTER
648 0.74% 10/01/14 9/30/20 $7,800.00 $12.04 NONE GROSS
INSURANCE
ORSCHELN
40,832 46.68% 2/01/07 1/31/32 $119,637.84 $2.93 2/01/22 $125,762.56 $25,014.69 2, 5-YR NNN
FARM & HOME
2/01/27 $131,887.36
JUST A $1.00 13,200 15.09% 9/01/07 3/31/18 $36,300.00 $2.75 $10,654.69 NONE NNN
HIBBETT
9,217 10.54% 5/24/14 5/31/19 $52,997.76 $5.75 $6,238.71 3, 5-YR NNN
SPORTS
SAVE-A-LOT 16,000 18.29% 10/01/92 3/31/27 $27,799.20 $1.74 4/01/22 $29,120.00 $9,072.85 2, 5-YR NNN
VACANT 2,600 2.97% $0.00
VACANT 740 0.85% $0.00
VACANT 680 0.78% $0.00
RYAN RITTER 10/16/07 MTM $4,800.00
TOTAL
4,020 4.60%
VACANT
TOTAL
83,457 95.40% $267,262.80 $52,303.26
OCCUPIED
TOTAL 87,477 100.00% $267,262.80 $52,303.36
This information has been secured from sources we believe to be reliable, but we make no representations or warranties, expressed or implied, as to the accuracy of the information. References to square
footage or age are approximate. Buyer must verify the information and bears all risk for any inaccuracies. Any projections, opinions, assumptions or estimates used herein are for example purposes only
and do not represent the current or future performance of the property. Marcus & Millichap Real Estate Investment Services is a service mark of Marcus & Millichap Real Estate Investment Services, Inc.
© 2017 Marcus & MillichapLEASE EXPIRATION SCHEDULE: HUGO, OK FINANCIAL OVERVIEW
1601-1623 E. JACKSON ST., HUGO, OK 74743
YEAR 1 YEAR 2 YEAR 3 YEAR 4 YEAR 5 YEAR 6 YEAR 7 YEAR 8
YEAR END 2017 2018 2019 2020 2021 2022 2023 2024
HIBBETT HUGO TAG
TENANT NAME JUST A $1.00
SPORTS AGENCY
SHELTER
INSURANCE
TOTAL NO.
1 1 2
OF TENANTS
TOTAL SQ. FT.
13,200 9,217 2,048
EXPIRING
TOTAL % 15.1% 10.5% 2.3%
CUMULATIVE %
15.1% 25.6% 28.0%
EXPIRING
This information has been secured from sources we believe to be reliable, but we make no representations or warranties, expressed or implied, as to the accuracy of the information. References to square
footage or age are approximate. Buyer must verify the information and bears all risk for any inaccuracies. Any projections, opinions, assumptions or estimates used herein are for example purposes only
and do not represent the current or future performance of the property. Marcus & Millichap Real Estate Investment Services is a service mark of Marcus & Millichap Real Estate Investment Services, Inc.
© 2017 Marcus & MillichapLOCAL MAP: HUGO, OK PROPERTY OVERVIEW
This information has been secured from sources we believe to be reliable, but we make no representations or warranties, expressed or implied, as to the accuracy of the information. References to square
footage or age are approximate. Buyer must verify the information and bears all risk for any inaccuracies. Any projections, opinions, assumptions or estimates used herein are for example purposes only
and do not represent the current or future performance of the property. Marcus & Millichap Real Estate Investment Services is a service mark of Marcus & Millichap Real Estate Investment Services, Inc.
© 2017 Marcus & MillichapYou can also read