WATER AND SANITATION Summary - Water Outlook 2018

Page created by Randy Maldonado
 
CONTINUE READING
WATER AND SANITATION Summary - Water Outlook 2018
WATER AND SANITATION
Summary – Water Outlook 2018
WATER AND SANITATION Summary - Water Outlook 2018
SUMMARY – WATER OUTLOOK 2018                                                                                                          1                                                                                    Version 18 - updated 24 January 2018

 Getting through the drought in 2018 requires that demand be reduced. Cape Town has already used nearly 5,000 million litres more than it should have since
  1 November 2017 by not reaching the 500MLD a day target set in October. Agriculture will largely deplete their allocation by end January 2018;
 Augmentation will not add sufficient water to carry the system through to the next rainy season;
 City of Cape Town (CCT) cannot reasonably or sustainably go off-grid from the Western Cape Water Supply System (WCWSS);
 Out-flows from the system are shown below (maximum calculated evaporation, Cape Town and Agricultural allocations). Unrestricted, the system demand
  peaks in summer at over 2,500 million litres a day (MLD). Under the current restrictions the peak is at approximately 1,500MLD.

          3000                                                                                                                                  3000
                                                                              UNRESTRICTED OUTFLOWS                                                                                                                        RESTRICTED OUTFLOWS
          2500                                                                                                                                  2500
          2000                                                                                                                                  2000
    MLD

                                                                                                                                          MLD
          1500                                                                                                                                  1500
          1000                                                                                                                                  1000
           500                                                                                                                                   500
             0                                                                                                                                     0
                                            Feb-18

                                                                              May-18
                 Nov-17

                          Dec-17

                                   Jan-18

                                                                                         Jun-18
                                                                  Apr-18

                                                                                                  Jul-18

                                                                                                                             Oct-18
                                                       Mar-18

                                                                                                           Aug-18

                                                                                                                    Sep-18

                                                                                                                                                                                    Feb-18

                                                                                                                                                                                                                  May-18
                                                                                                                                                                         Jan-18

                                                                                                                                                                                                                              Jun-18
                                                                                                                                                                                                       Apr-18

                                                                                                                                                                                                                                       Jul-18

                                                                                                                                                                                                                                                                  Oct-18
                                                                                                                                                       Nov-17

                                                                                                                                                                Dec-17

                                                                                                                                                                                                                                                Aug-18

                                                                                                                                                                                                                                                         Sep-18
                                                                                                                                                                                              Mar-18
                                                Evap            CCT        Agriculture                                                                                            Evap       CCT 45%            Agriculture 60%

DEMAND MANAGEMENT has a number of components:
  CCT restriction:
   o Demand has been significantly reduced since implementation of the Water Conservation and Water
     Demand Management Programme more than a decade ago;                                                                                                                                     o Urban restriction currently at 45%;
                                                                                                                                                                                             o WCWSS covers West Coast district
                                                                                                                                                                                               municipality and local municipalities of
                                                                                                                                                                                               Drakenstein,        Stellenbosch        and
                                                                                                                                                                                               Witzenberg;
                                                                                                                                                                                             o CCT provides water to parts of
                                                                                                                                                                                               Stellenbosch         and         Drakenstein
                                                                                                                                                                                               municipalities;
                                                                                                                                                                                             o CCT also manages some of the dams in
                                                                                                                                                                                               the     WCWSS       –     Steenbras     and
                                                                                                                                                                                               Wemmershoek;
                                                                                                                                                                                             o CCT has a number of small dams in its
                                                                                                                                                                                               control, with storage capacity of ~4.4Mm 3
                                                                                                                                                                                               (as compared to the WCWSS capacity of
                                                                                                                                                                                               900Mm3);
                                                                                                                                                                                             o Domestic use = 70% of CCT use;
      o The 500MLD target (red dotted line) has not yet been achieved. It is now required that demand be
                                                                                                                                                                                             o Informal settlement use 3.6% of water for
        reduced to below 450MLD to avoid Day Zero;
                                                                                                                                                                                               approximately 15% of households.
      o Initiatives to achieve this include:
         Restrictions: Currently on Level 6, individual consumption at
WATER AND SANITATION Summary - Water Outlook 2018
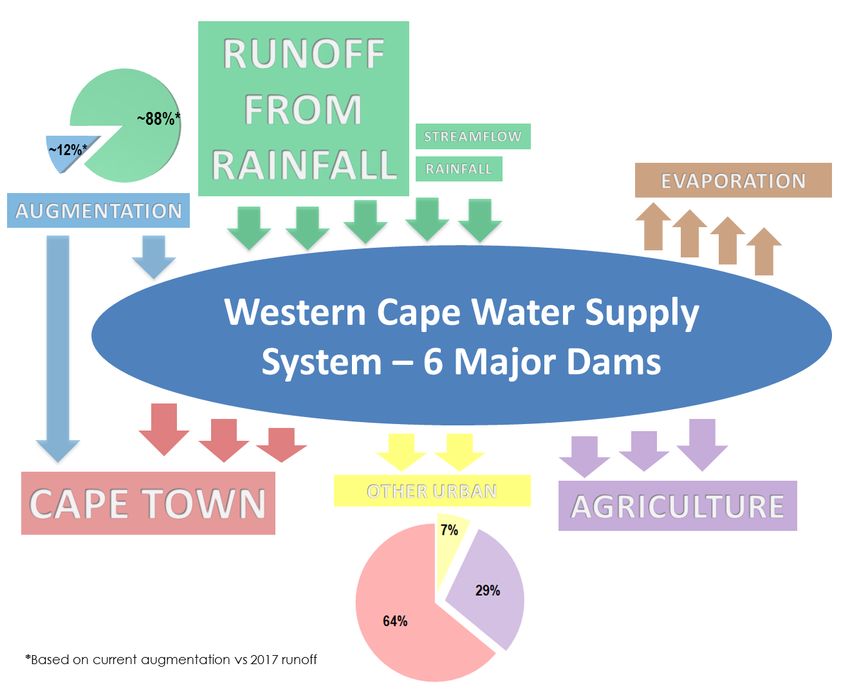
WATER OUTLOOK 2018                                                                   2                                                  Version 18 - updated 24 January 2018

                                                                                                        To get through the drought we have to ensure that dam
                                                                                                        levels do not fall below 15%. We can only extract water
                                                                                                        from the dams when they are above 10%.

                                                                                                        Dam levels rise principally from runoff from rainfall in
                                                                                                        catchment areas, and to a far lesser degree from streams
                                                                                                        flowing into the dams, and rainfall over the dams. Some
                                                                                                        augmentation will enter the system (such as groundwater
                                                                                                        from aquifers).

                                                                                                        With climate change, worldwide weather patterns have
                                                                                                        changed and our catchment area has seen the worst
                                                                                                        drought on record. The current augmentation schemes will
                                                                                                        provide only about 12% of total available supply during
                                                                                                        2018 while the poor rainfall of 2017 contributed 88%.

                                                                                                        Dam levels drop from use by:
                                                                                                         Agricultural;
                                                                                                         City of Cape Town;
                                                                                                         Other municipalities, and
                                                                                                         Through evaporation.

                                                                                                        Although we have progressed exceedingly well in curtailing
                                                                                                        our urban consumption and fast-tracking our augmentation
                                                                                                        schemes, the poor rainfall of 2017 leaves us exposed to
                                                                                                        dams emptying too quickly.

                                                                                                               DEMAND MANAGEMENT
                   CAPE TOWN’S AUGMENTATION PLANS                                 To manage daily demand requires that each person should use no more than the
 We have been working towards a diversified supply for some time,                 defined volume per day, whether they are home, at work or elsewhere. Reaching
 but due to the expense of options other than surface water, the                  the overall demand target is only possible if individual use is curtailed.
 projects progressed to pilot stage rather than production. We have a
 plan running to June 2022 to reach a diversified water supply                    What the City is doing:
 position.                                                                         Restriction Level 6B: Level 6 was enforced from 1 January 2018. Consumption
 Short term, temporary desalination (16MLD)                                         has not reduced to 500MLD (87 litres pppd) since being imposed on 1 July
  Strandfontein, 7MLD, on track for first water in February/March                  2017. Thus the target has to be reduced to 450MLD. Daily individual
    2018, reaching full production by May 2018;                                     consumption must be limited to a maximum of 50 litres pppd to be aligned
  Monwabisi, 7MLD, on track for first water in February/March 2018,                with Level 6B tariffs.
    reaching full production by May 2018;                                          Communication campaigns: Every person in the city to realise that this is a
  V&A, 2MLD, on track for first water in February/March 2018.                      crisis. The city has launched numerous communication campaigns to assist
 Groundwater abstraction (peak at 150MLD)                                           people in reducing their consumption, such as household leak detection &
  Cape Flats aquifer, on track, drilling to start beginning January,               repair and how to use 87 litres, and continues to use radio, print and social
    80MLD water (temporary maximum abstraction) into the system                     media to reach every citizen and mobilise to reduce consumption to 500MLD.
    ramping up from May/June 2018;                                                  To be amended in line with 6B restrictions.
  Atlantis aquifer, 5MLD already refurbished and into system, a                   Pressure reduction: Pressure reduction was initiated more than a decade ago
    further 20MLD to be ramped up from May to October 2018 to                       and has been accelerated to automate zones across the city to optimise the
    serve the Atlantis/Silwerstroom area;                                           system and reduce demand - especially the impact of leaks. Within zones,
  TMG aquifer, pilot drilling commenced in November, water will                    pressure is varied during the course of a day based on demand.
    enter the system ramping up from February 2018 to June 2019,                   Household flow regulators: The city has been installing water management
    yielding 40MLD sustainably;                                                     devices to manage debt for many years. The programme has been
 Springs                                                                            dramatically ramped up to households who have not reduced consumption.
  Newlands – Albion spring in operation at ~3MLD. We aim to add                    In many cases this was due to undetected leaks, but under level 6 restrictions,
    all feasible springs into the reticulation system which will increase           the city will install these where consumption is higher than 10.5kl/month. This is
    the volume;                                                                     based on a household of 4, each person using 87 litres pppd at home only. The
  Oranjezicht – routed 1MLD into the system, looking at other springs              allowance is generous in that many people spend much time at work or
    to enter into system where possible which will increase volume.                 school, and also in that the average household size in Cape Town is 3.2
 Water re-use                                                                       people. While 6B restricts to 50lcd, devices will only be fitted above 10.5kl.
  Zandvliet, 10MLD on track for June 2018, increasing to 50 in Dec                Punitive tariffs: restrictions go hand-in-hand with stepped tariffs, charging more
    2021                                                                            for water use at higher volumes. Level 4 tariffs kicked in on 1 July 2017, but the
  Cape Flats, 10MLD by June 2018, 75 by Dec 2021                                   low rainfall in 2017 requires further punitive tariffs to have an impact on
  Macassar, 20MLD by June 2019                                                     consumer behaviour. Water is still very cheap, and is supplied to every
  Potsdam, 10MLD by June 2019                                                      household, compared to any other good or service. Level 5 & 6 restriction
  Athlone, 75MLD by December 2021                                                  tariffs have been introduced in-year thanks to special dispensation from the
 Water transfers                                                                    Minister of Finance.
  Approximately 8 000Mm3 will be transferred from a large privately               Adaptation: The city has engaged with large and small business with possible
    owned dam on the Palmiet River over the season. Future transfers                solutions and is working to incentivise reduced consumption. Avenues still to be
    will depend on rainfall in respective catchments;                               evolved include usage of private boreholes in the system.
  Others under investigation.                                                     Information to drive behaviour change: we are embarking on making visually
 Permanent desalination                                                             available household consumption data to incentivise all households to stay
  Koeberg pilot underway,                                                          within usage limits (red & green dots).
 CT harbour desalination plant plans in place to implement if needed               Influence on agricultural use: The NDWS is responsible for managing releases to
 and long term desalination projects under development.                             farmers and the City is engaging at every level to ensure that restrictions are
                                                                                    adhered to.

 DAM LEVELS
 The City publishes dam levels, change in dam levels and consumption every week. Tracking urban and agriculture against allocations has recently been
 included on the dashboard. Decisions around further restrictions will be made based on how dam levels are tracking against the anticipated behaviour,
 and we will have early warning if we are not on track. Note that every day the 500 MLD target is exceeded means less water in the dams, which needs to
 be recovered by future reduced demand, thus the urgent need to move the daily target to 450 MLD.

Information compiled by the Department of Water & Sanitation, City of Cape Town
WATER AND SANITATION Summary - Water Outlook 2018
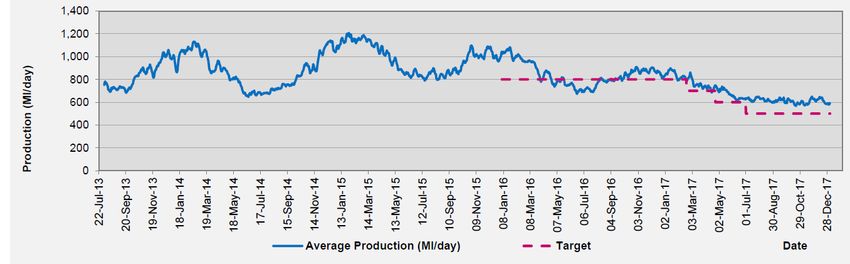
WATER OUTLOOK 2018                                                                                                                                                                                       3                                                                                                               Version 18 - updated 24 January 2018

CAPE TOWN GETS WATER FROM MAJOR DAMS IN WESTERN CAPE WATER SUPPLY SYSTEM (WCWSS)

   WC WATER SUPPLY SYSTEM FULL                                                                                                                                                                                                                                                                                                                                      Mm3
                                                                                                                                                                                                                                                                                             Cape Town (incl. own sources)                                           Water use prior to
                                                                                                                                                                                                                                                                                                                                                                    324
      CAPACITY 900 MILLION m3                                                                                                                                                                                                                                                                                                                                        onset of drought
                                                                                                                                                                                                                                                                                             Agriculture                                                            144
                                                                                                                                                                                                                                                                                             Other Urban                                                             23
                                                                                                                                                                                                                                                                                             System water yield (average year)                                      570
                                                                                                  Agriculture
                                                                                                  Other Urban
                                                                                                  Cape Town
                                                                                                                                                                              900 million cubic meters
                                                                                                                                                                              in 6 major dams

The National department of Water and Sanitation is responsible for the allocation of water from the WCWSS. Cape Town participates, and is responsible for
adhering to restrictions imposed by NDWS. NDWS has to release, manage and control water to agriculture and urban users. The capacity of existing dams is
sufficient to cover the allocation while augmentation schemes have been planned to cover growth.
                                       Equivalent annual inflow (millions of m3)
 900                                                                                                                                                                                                   AUGMENTATION
 800
 700                                                                                                                                                                                                   Augmentation schemes are a far more expensive source of water than runoff
 600                                                                                                                                                                                                   from rainfall. The volume of runoff cannot be easily augmented in short time
 500                                                                                                                                                                                                   periods and is dependent on rainfall patterns. Under poor rainfall conditions like
 400                                                                                                                                                                                                   2017 we would require augmentation of ~720MLD to match the volume of runoff.
 300                                                                                                                                                                                                   Despite all augmentation efforts, the supply scheme is vulnerable to poor rainfall.
 200
 100                                                                                                                                                                                                   As can be seen below the cost per kl of water from other sources vary
   0                                                                                                                                                                                                   considerably. The cost of bulk water, waste water and reticulation is common so
         Planned                       300MLD                       500MLD                     2017 runoff                       Average                            Wet winter                         the costs below can be compared to the cost of runoff which is R5.20/kl.
       augmentation                                                                                                               runoff                             runoff

FINANCE
As the cost of raw water is low, the cost of providing the service remains virtually
the same despite the dramatic drop in volume/sales and concomitant drop in
revenue. Water & Sanitation should operate as a trading service, i.e. revenue
should cover the cost of providing the service. A drought charge was proposed
to cover the shortfall in revenue to fund the operations of providing reticulated
water and sanitation to customers.

                                                                                                                                      Further restriction tariffs have been introduced in-year to further incentivise people to reduce
                                                                                                                                      consumption. The restriction tariffs are calculated to be as revenue neutral as possible – i.e. that
                                                                                                                                      revenue does not increase, but that consumption decreases, while ensuring a sustainable service.
                                                                                                                                      Water is still very cheap. To have impact on consumption everything used over the per person daily
                                                                                                                                      allowance must be more expensive.

                                                                                                                                                                                                                                                                                                                                 Punitive tariffs – Level 6 from 1 Februa
                                                                                                                                                                                                                                                                                                                                 Step 1 tariff was introduced in July 20
                                                                                                                                                                                                                                                                                                                                 levels – prior to this the first 6kl was
                                       Existing Restriction tariffs (Water)
                                                                                                                                    Level 5                           Level 6                                                                                                                                                    are now required to dramatically red
                                  Level 1     Level 2     Level 3      Level 4
                                                                                                                                                                                                                                                                                                                                 steps have shrunk considerably.
 Step 1 [0-6kl]                     4.00        4.00        4.00         4.00                                                        18.75                             26.25
 Step 2 [6-10.5kl]                 15.57       15.57       15.57        15.57                                                        26.25                             46.00
                                                                                                                                                                                                                                                                                                                                 The proposed Level 5 tariff is desig
 Step 3 [10.5-20kl]                18.22       20.04       21.87        22.78                                                        46.00                            100.00                                                                                                                                                     500MLD, for a household of 4, all wa
 Step 4 [20-35kl]                  26.99       32.65       36.43        38.32                                                       100.00                            300.00                                                                                                                                                     Similarly, Level 6 is designed on 50lcd
 Step 5 [35-50kl]                  33.33       45.00       61.66        99.99                                                       300.00                            800.00                                                                                                                                                     household of 4, all water above 6kl i
 Step 6 [+50kl]                    43.97       97.71      209.29       265.12                                                       800.00                            800.00                                                                                                                                                     10.5kl per month) will still be provided
 Commercial                        19.63       21.59       23.55        24.54                                                        37.50                             50.00                                                                                                                                                     5 & 6.

CONSUMPTION CONTROL: the city would have been able to manage household consumption through smart metering – similar to electricity, where one could
use pre-paid metering or remote monitoring and controlling. The reality is that water has always been too cheap for this to be viable, and although the city has
installed approximately 240,000 water management devices over the past decade, the programme has not been without problems. Household demand has
declined significantly with just over 25,000 non-indigent households exceeding 20kl/month at end November. Since acceleration in installation from beginning
October 2017, we have installed over 2,000/week, and dealt with concomitant increase in no water service requests.

       Non-indigent Households over 20kl/month                                                                                                                     30 000                                                                                                                                                    3000
                                                                                                                                                                                                                                                                                                                                    WMD "no water" notifications
                                                                                                                                       Number of WMD's installed

 120 000                                                                                                                                                           25 000                                                                                                                                                    2500
 100 000                                                                                                                                                           20 000                                                                                                                                                    2000
  80 000                                                                                                                                                           15 000                                                                                                                                                    1500                                  Weekly
  60 000                                                                                                                                                                                                                                                                                                                                                           Cumulative
                                                                                                                                                                   10 000                                                                                                                                                    1000
  40 000
                                                                                                                                                                                                                                                                                                                                                                   No Water WMD
  20 000                                                                                                                                                            5 000                                                                                                                                                    500
       0                                                                                                                                                               0                                                                                                                                                     0
                              Feb-17

                                                         May-17
                     Jan-17

                                                                  Jun-17
                                                Apr-17

                                                                           Jul-17

                                                                                                      Oct-17
            Dec-16

                                                                                    Aug-17
                                                                                             Sep-17

                                                                                                               Nov-17
                                                                                                                        Dec-17
                                       Mar-17

                                                                                                                                                                            08-Oct
                                                                                                                                                                                     15-Oct
                                                                                                                                                                                              22-Oct
                                                                                                                                                                                                        29-Oct

                                                                                                                                                                                                                                                                                                  07-Jan
                                                                                                                                                                                                                                                                                                           14-Jan
                                                                                                                                                                                                                                                                                                                    21-Jan
                                                                                                                                                                                                                 05-Nov
                                                                                                                                                                                                                          12-Nov
                                                                                                                                                                                                                                   19-Nov
                                                                                                                                                                                                                                            26-Nov
                                                                                                                                                                                                                                                     03-Dec
                                                                                                                                                                                                                                                              10-Dec
                                                                                                                                                                                                                                                                       17-Dec
                                                                                                                                                                                                                                                                                24-Dec
                                                                                                                                                                                                                                                                                         31-Dec

Information compiled by the Department of Water & Sanitation, City of Cape Town
WATER OUTLOOK 2018                                                                4                                                    Version 18 - updated 24 January 2018
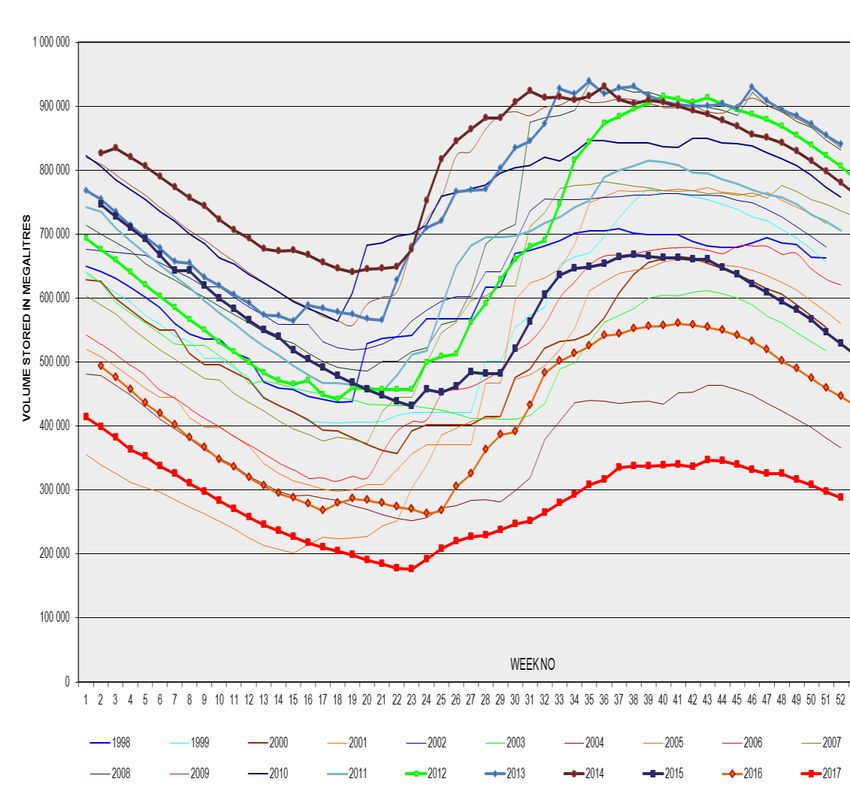
DAM MODEL
Dam levels have been tracked for many years – for the first months of
the year (summer), levels drop, and increase again once the rainy
season starts. The 2017 dam behaviour can be seen plotted against that
of the past 20 years. We continue tracking dam levels by measuring the
actual levels, and forecasting future dam levels by subtracting
evaporation, agricultural and urban use. As we are not expecting any
rain between now and May 2018, we can confidently predict dam
levels at various stages of the coming months if we adhere to the
restrictions. If we don’t adhere, then dam levels will drop too quickly and
we will not reach the rainy season. Currently, levels are dropping at
about 1% per week. In January 2017 this peaked at 1.7% per week. We
simply cannot afford such a rapid drop in level.
Assumptions in dam behaviour are conservative and assume extreme
evaporation, and rainfall mirroring that of 2017. Rainfall was
exceptionally low - and late. By varying the anticipated demands of
agriculture and urban use, the percentage reached before the impact
of the rainy season is evident can be seen below.

In simple terms some sample calculations are shown below, based on
dam levels at the start of the hydrological year, 1 November 2017:

Starting volume 1 Nov      =   percentage x total volume
                           =   38.4% x 900,000 Million cubic metres
                           =   345,600 Mm3
Starting volume 1 Dec      =   actual starting volume 35.6% of 900,000 Mm3
                           =   345,600 – Agricultural use – urban use – evaporation + rainfall + streamflow + runoff
                           =   320,400 Mm3                                                                                Providing additional water is part of the
                                                                                                                          emergency, medium and long term
                                                                                                                          planning, but the only way to protect
                                                                                                                          the supply scheme from running dry at
                                                                                                                          this stage is reducing demand.

                                                                                                                          To this end, the NDWS imposes
                                                                                                                          restrictions. The current restrictions, if
                                                                                                                          adhered to, will result in the dams
                                                                                                                          reaching a minimum of 15% before the
                                                                                                                          rainy season. Outflow is seasonal given
                                                                                                                          that more water is used in the
                                                                                                                          agricultural growing season, and in
                                                                                                                          summer for evaporation and urban. As
                                                                                                                          we do not know when the rainy season
                                                                                                                          will start, or how much rain is likely to fall
                                                                                                                          in the catchment areas, we must use
                                                                                                                          even less water than the restriction levels
                                                                                                                          demand. The currently planned and
                                                                                                                          funded augmentation is included in the
                                                                                                                          model together with 2017 runoff as
                                                                                                                          inflow volumes.

                                                                                                                          It is evident that failure will occur unless
                                                                                                                          demand is immediately curtailed to
                                                                                                                          meet the overall restrictions.

At the moment both Cape Town and Agriculture are using more water than the restrictions allow. This means that we will run out of water unless we reduce our
consumption to within the target range. The graphs below show the latest week’s progress the black line needs to track below the blue line to stay within our
respective restrictions. CCT actual usage is tracking slightly above where we should be but it translates to having used nearly 5,000 millions of litres more than
we should have at 24 December. This translates to more than 7 days’ use at 500MLD over an 12 week period. Cape Town now needs to reduce to a daily
target 450MLD to compensate for having overused our restricted allowance.

                                                                                                                       We must make up the shortfall immediately by
                                                                                                                       limiting consumption to 50lcd under Level 6B
                                                                                                                       restrictions, while we continue physically
                                                                                                                       restricting above 10.5kl/household. We need
                                                                                                                       to publish, track and adhere to the weekly
                                                                                                                       water budget. While it requires every
                                                                                                                       individual, household and business to make
                                                                                                                       up the shortfall, the City will progressively
                                                                                                                       reduce pressure in zones which will result in
                                                                                                                       water not being available at all households all
                                                                                                                       the time. We have fast-tracked automating
                                                                                                                       pressure control and obtaining integrity of all
                                                                                                                       zones which will enable such reduction, and
                                                                                                                       will reduce aggressively as each zone allows.

At the rate of agricultural release, the restricted allocation will be depleted in January 2018. At present, Agriculture is drawing more out of the system than
urban users which further indicates that their allocation will be depleted soon.

Limiting individual and household consumption is far preferable than the Day 0 scenario of households collecting water from points of distribution (PODs) and
risk failure of the sewerage network. The department is committed to ensuring that demand is driven down sufficiently to defeat Day Zero.

Information compiled by the Department of Water & Sanitation, City of Cape Town
23 January 2018

Cape Town is experiencing the worst drought in recorded history. It is now likely that the dams
will run dry before the winter rains come. Although some residents have worked hard to reduce
consumption - many have not. Cape Town is still using in excess of 600 million litres of water per
day. That is 100 million litres per day above the target of 500 million litres per day. In order to
avoid Day Zero we now have to drastically reduce demand to 450 million litres per day.

Dam levels currently stand at 27.2% and are dropping at a rate in excess of 1% per week. This
means that if we continue to consume water at our current rate we only have 10 weeks of
water left before we reach Day Zero. On Day Zero the water reticulation network will be turned
off to 75% of the City and residents will only be able to get water from designated Points of
Distribution or “PODs”. This scenario is almost too awful to consider.

The City of Cape Town (residential and commercial) uses approximately 64% of the total water
supply, agriculture uses approximately 29%, while other urban areas such as the West Coast,
Stellenbosch and Drakenstein use about 7%. The largest users of water in Cape Town are
suburban households – this is where you can help.

You can reduce your daily water use by:
 Collecting grey water from your bathroom and washing machine
 Turning off your cisterns and only using grey water to flush your toilet
 Taking (very) short showers or washing every second day (standing in a tub)
 Googling your make of washing machine and choosing the most water-efficient wash
   cycle.

Although the City of Cape Town is working to increase the supply of water through the use of
ground water, reuse, and desalination, these new water supplies will only make a meaningful
contribution to supply in the longer term. They will not prevent Day Zero.

Cape Town will ONLY get through the drought if we reduce demand immediately. This will
require significant sacrifice from residents – many of whom have already done a great deal.
Cape Town has reduced its demand from a peak of 1200 Ml/day in 2015 to around 600 Ml/day.
This is a phenomenal reduction, in line with the best in the world, but we can and stil need to
reduce demand further if we are to avoid Day Zero.

In order to avoid Day Zero the City is putting further measures in place to reduce demand.
These include:
 The introduction of punitive tariffs from 1 February 2018 to target water abusers
 Further demand management devices & flow restrictors
 More aggressive pressure management that may result in disrupted supply

The City is also working with the Provincial Department of Agriculture to target agricultural users
who are not adhering to restrictions. All water users need to adhere to restrictions imposed on
the system or we will not have sufficient water to avoid Day Zero.

   Information compiled by the Department of Water & Sanitation, City of Cape Town
You can also read