Water and Wastewater: Treatment/Volume Reduction Manual - Brewers Association
←
→
Page content transcription
If your browser does not render page correctly, please read the page content below
Energy Usage, GHG Reduction, Efficiency and Load Management Manual

Brewers Association

Water and Wastewater:
Treatment/Volume
Reduction Manual

                            Water and Wastewater: Treatment/Volume Reduction Manual   1
2 BrewersAssociation.org
table of contents
Acknowledgements . . . . . . . . . . . . . . . . . . . . . . . . . . . . . . . . . . . . . . . . 4                 3.5 Food Service . . . . . . . . . . . . . . . . . . . . . . . . . . . . . . . . . . . . . . . . 32
Introduction . . . . . . . . . . . . . . . . . . . . . . . . . . . . . . . . . . . . . . . . . . . . . . . 5           Best Practices - Dishwashing . . . . . . . . . . . . . . . . . . . . . . . . . . 32
Section 1 – Segment Profile: Water Usage &                                                                             Best Practices – Refrigeration . . . . . . . . . . . . . . . . . . . . . . . . . . 33
Wastewater Generated by Craft Brewers . . . . . . . . . . . . . . . . . . . . . . 6                                    Best Practices - Grease Traps . . . . . . . . . . . . . . . . . . . . . . . . . . 33
    1.1 Overview of Current Water Usage &                                                                              Best Practices – Dining area . . . . . . . . . . . . . . . . . . . . . . . . . . . 33
        Wastewater Performance Trends . . . . . . . . . . . . . . . . . . . . . . . 7                                  Best Practices - Restrooms . . . . . . . . . . . . . . . . . . . . . . . . . . . . 34
    1.2 Regulatory Drivers . . . . . . . . . . . . . . . . . . . . . . . . . . . . . . . . . . . . 9                   Best Practices – Parking Lot/Landscape . . . . . . . . . . . . . . . . 34
    1.3 Non-Regulatory Drivers: Image/Brand, Community Ties . . . 10                                               3.6 Concerts/Events . . . . . . . . . . . . . . . . . . . . . . . . . . . . . . . . . . . . 35
    1.4 Risks and Opportunities: Water Use Reduction and                                                       Section 4: On-Site Wastewater Treatment . . . . . . . . . . . . . . . . . . . . . 36
        Wastewater Management . . . . . . . . . . . . . . . . . . . . . . . . . . . . 12                           4.1 pH Neutralization . . . . . . . . . . . . . . . . . . . . . . . . . . . . . . . . . . . . 36
Section 2: Data Management . . . . . . . . . . . . . . . . . . . . . . . . . . . . . . . 14                        4.2 Solids Removal . . . . . . . . . . . . . . . . . . . . . . . . . . . . . . . . . . . . . . 37
    2.1 Data Collection . . . . . . . . . . . . . . . . . . . . . . . . . . . . . . . . . . . . . 14               4.3 Biological Treatment . . . . . . . . . . . . . . . . . . . . . . . . . . . . . . . . . 37
    2.2 Ensuring Accuracy . . . . . . . . . . . . . . . . . . . . . . . . . . . . . . . . . . . 18             Section 5: Brewery Case Studies . . . . . . . . . . . . . . . . . . . . . . . . . . . . . 40
    2.3 Benchmarking: Key Performance Indicators (KPIs). . . . . . . . 18                                          5.1 Water Reduction . . . . . . . . . . . . . . . . . . . . . . . . . . . . . . . . . . . . 40
    2.4 Guidelines for Setting Measurable Goals and Objectives . . 19                                                  Bell’s Brewery – Kalamazoo, Michigan . . . . . . . . . . . . . . . . . . 40
Section 3: Usage & Reduction Best Practices . . . . . . . . . . . . . . . . . . 20                                     Long Trail Brewing Company – Bridgewater Corners, Vermont. . 40
    3.1 Brewing . . . . . . . . . . . . . . . . . . . . . . . . . . . . . . . . . . . . . . . . . . . . 22             New Belgium Brewing Company – Fort Collins, Colorado. . 40
        Best Practices - Mash Cooker, Lauter Tun, Boiling                                                              Sierra Nevada – Chico, California . . . . . . . . . . . . . . . . . . . . . . 40
        Kettle and Whirlpool . . . . . . . . . . . . . . . . . . . . . . . . . . . . . . . . . 23                      Standing Stone Brewery – Ashland, Oregon . . . . . . . . . . . . . 40
        Best Practices - Heat Exchangers . . . . . . . . . . . . . . . . . . . . . . 24                            5.2 Wastewater Pre-treatment . . . . . . . . . . . . . . . . . . . . . . . . . . . . 41
        Best Practices – Fermentation Vessels . . . . . . . . . . . . . . . . . . . 24                                 Bluetongue Brewery – Warnervale, Australia . . . . . . . . . . . . . 41
        Best Practices - Yeast Disposal . . . . . . . . . . . . . . . . . . . . . . . . . 25                           City Brewing Company, La Crosse, Wisconsin. . . . . . . . . . . . 41
        Best Practices - Filtration . . . . . . . . . . . . . . . . . . . . . . . . . . . . . . 25                     Long Trail Brewing Company - Bridgewater Corners, Vermont . . 41
        Best Practices - CIP System . . . . . . . . . . . . . . . . . . . . . . . . . . . . 26                         Sierra Nevada – Chico, California . . . . . . . . . . . . . . . . . . . . . . 41
        Best Practices - Vacuum Pumps . . . . . . . . . . . . . . . . . . . . . . . 27                                 Stone Brewing Company – Escondido, California . . . . . . . . 42
        Best Practices - Good Process Sesign . . . . . . . . . . . . . . . . . . . 27                              5.3 Community Outreach . . . . . . . . . . . . . . . . . . . . . . . . . . . . . . . . 42
        Best Practices - Chase Water . . . . . . . . . . . . . . . . . . . . . . . . . . 27                            Founders Brewing Company – Grand Rapids, Michigan . . 42
    3.2 Packaging. . . . . . . . . . . . . . . . . . . . . . . . . . . . . . . . . . . . . . . . . . 27                New Belgium Brewing Company – Fort Collins, Colorado. . 42
        Best Practices - Cask and Keg Washing . . . . . . . . . . . . . . . . . 28                             Appendix A: Tool Box . . . . . . . . . . . . . . . . . . . . . . . . . . . . . . . . . . . . . . 43
        Best Practices - Cask and Keg Filling. . . . . . . . . . . . . . . . . . . . 29                            Guidance and Checklists . . . . . . . . . . . . . . . . . . . . . . . . . . . . . . . . 43
        Best Practices - Glass Bottle Washing and Pasteurizing . . . . 29                                          On-Line Excel-Based Tools . . . . . . . . . . . . . . . . . . . . . . . . . . . . . . . . 43
    3.3 Warehousing . . . . . . . . . . . . . . . . . . . . . . . . . . . . . . . . . . . . . . . . 30         References . . . . . . . . . . . . . . . . . . . . . . . . . . . . . . . . . . . . . . . . . . . . . . . 44
    3.4 Support Systems (Utilities) . . . . . . . . . . . . . . . . . . . . . . . . . . . . . 30               Selected Web Links. . . . . . . . . . . . . . . . . . . . . . . . . . . . . . . . . . . . . . . . 46
        Best Practices - Cooling towers . . . . . . . . . . . . . . . . . . . . . . . . 30
        Best Practices – Steam generation . . . . . . . . . . . . . . . . . . . . . 31
        Best Practices - Compressors . . . . . . . . . . . . . . . . . . . . . . . . . . 31

      Cover photos © Shutterstock, LLC. Interior photos provided by Antea Group unless otherwise noted.

                                                                                                                    Water and Wastewater: Treatment/Volume Reduction Manual                                                  3
acknowledgements

                      This project would not have been possible without the support of many Brewers
                      Association members. The case studies they provided illustrate the creativity and
                            application of sustainability best practices in the craft brewing sector.

                    Our particular thanks go to the following core review team members, who provided
                     invaluable insight and direction throughout the development of this document:

                                     Cheri Chastain, Sierra Nevada Brewing Company

                                    Steve Crandall, Devils Backbone Brewing Company

                                             Daniel Del Grande, Bison Brewing

                                                  Tom Flores, Brewers Alley

                                      Matty Gilliland, New Belgium Brewing Company

                                               Larry Horwitz, Iron Hill Brewery

                                               Chris Opela, Brewmaster, Inc.

                                             Chris Swersey, Brewers Association

                                           Mike Utz, Boulevard Brewing Company

                    We would also like to thank the sustainability management consulting team from
                    Antea® Group who developed this manual and related tools, and in particular
                    acknowledge Antea Group’s Project Leader John Stier.

4   BrewersAssociation.org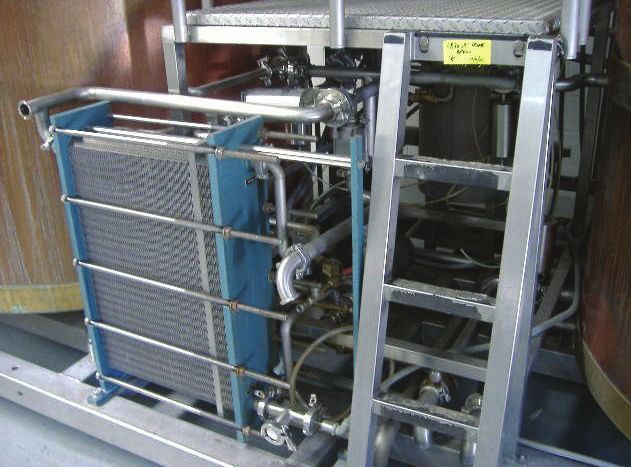
introduction
Craft brewers are innovative leaders in the beverage sector.      best practices in this manual will help provide tools needed
The breweries take pride in developing new products and           to work towards optimal efficiency, as well as to ease
processes that give both brewery employees and customers          potential future risks and enhance community value.
options for sustainable living. Despite significant improvement
over the last 20 years, water consumption and wastewater     This manual is a consolidated resource for effective water
disposal remain environmental and economic hurdles           and wastewater management solutions in the craft brewer
that directly affect breweries and the brewing process. It   segment. Solutions outlined can apply to all breweries,
is no surprise that many breweries have found innovative     regardless of location and operational size. It will provide
solutions for water and wastewater management. These         guidance for small brewers that are just beginning to
solutions go beyond facility water conservation programs to  explore water and wastewater reduction programs, as well
find collaborative, sustainable solutions for the community  as provide new ideas for brewers that are looking to improve
and for the environment.                                                           a well-established program or build
                                                                                   improved efficiency into expansions
The abundance of clean, affordable
                                            I am convinced that, under             or new facilities. Brewers will also find
water in the United States has created      present conditions and with the        tools they can easily incorporate to
complacency among users and the             way water is being managed,            integrate water use reduction and
public. Businesses, municipalities and      we will run out of water long          conservation measures into everyday
academia all agree that the current                                                operations and to identify on-site
usage rate with future population
                                            before we run out of fuel.             wastewater treatment opportunities.
growth may create an unsustainable
                                                         - Peter Brabeck-Letmathe,
pattern.                                                                              In addition, there are checklists,
                                                       Chairman Nestlé Corporation
                                                                                      resource lists, and other visual tools
Given these pressing concerns,                                                        throughout the manual and in
brewers need to be mindful of the future risks of cost and        Appendix A to help breweries make informed decisions
supply, which are key staples of a growing business. While        about water usage and wastewater reduction opportunities.
the average water use ratio for a brewery is around seven
barrels of water to one barrel of beer, many craft brewers        Disclaimer: the following information provided constitute
are world leaders with ratios below three to one. Although        suggestions that may or may not fit the need of each
the payback for reducing water usage is typically longer          brewery specifically. Brewers should proceed with caution
than recommended using standard financial calculators,            when implementing any new programs. It is not guaranteed
the long-term sustainability and growth of a business may         that operating under the guidance of this manual will lead to
depend on the ability to efficiently use water resources. The     any particular outcome or result.

        The information presented is a pathway to effective and sustainable water and wastewater management
        from start to finish. This information is organized into five sections:

        1.   Segment Profile: A discussion of water usage          3.    Best Practices: Guidance on best practices to
             and wastewater effluent trends, where to find               reduce water usage and wastewater generation
             information on regulatory drivers, examples                 focusing on opportunities in the brewing process,
             of non-regulatory drivers, and risks and                    including packaging, warehousing, utilities, and
             opportunities for cost savings.                             food service/events.

        2.   Data Management: A guide to identifying               4.    Onsite Wastewater Treatment: An overview of
             the components of water and wastewater                      drivers for onsite wastewater treatment and
             information, establishing key performance                   example technologies.
             indicators and goals, managing water and
             wastewater data, and benchmarking progress            5.    Case Studies: Selected brewery examples which
             toward goals.                                               provide more detail of water and wastewater
                                                                         reduction programs.

                                                                        Water and Wastewater: Treatment/Volume Reduction Manual   5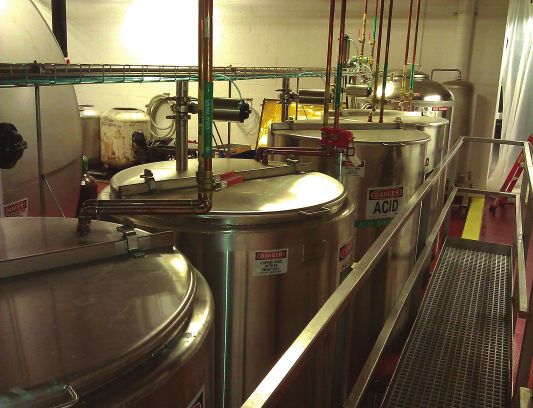
section one
    Segment Profile – Water Usage &
    Wastewater Generated by Craft Brewers

    Beer is about 95% water in composition; however, the amount           Water awareness and conservation practices provide
    of water used to produce a container of beer is far greater           an effective mechanism for brewers to reach out into
    than the amount of water contained in the beer that is                communities. Outreach efforts have a number of benefits,
    actually packaged and shipped out. Although water usage               including building brand image and being recognized as
    varies widely among breweries and is dependent upon                   an important part of the community.
    specific processes and locations, the U.S. average is about
    seven barrels of water for every barrel of beer produced. Most
    craft brewers receive their water from municipal suppliers,              Community Benefits
    while a few use well water as an alternative source.
                                                                             Economic:
    In addition to the water used in production, wastewater generation       • Helps sustain community growth and business
    and disposal presents another improvement opportunity for                   investment.
    brewers. Most breweries discharge 70% of their incoming water as         • Results in better bond ratings that help
    effluent. Effluent is defined as wastewater that is generated and           communities in need of financing.
    flows to the sewer system. In most cases, brewery effluent disposal      • Helps cities and communities showcase their
    costs are much higher than water supply costs.                              waterfront areas and commitment to clean
                                                                                water, thereby supporting new development
    In many communities, breweries may be the largest                           and encouraging related commerce.
    consumer of water and the largest source of organic effluent
    that must be treated by the municipal treatment plant. This              Environmental:
    presents unique supply and cost concerns. In the U.S., the               • Helps decrease the pollution in waterways that
    cost of incoming water from a municipal supplier (tap fee)                    harms wildlife and the ecosystem.
    is relatively inexpensive compared to other brewery utilities.           • Reduces water and energy usage, leading to a
    When combining that cost with treatment (physical and                         decrease in greenhouse gas emissions and less
    chemical) and effluent disposal costs, brewers are presented                  strain on natural resources.
    with a reflection of the true or full cost of water. Establishing        • Ensures that community natural resources and
    this concept of full cost of water is an important factor in cost/            wildlife will be protected.
    benefit analyses and will be discussed later in this document.

6    BrewersAssociation.org
Segment Profile: Water Usage & Wastewater Generated by Craft Brewers

Within a brewery, there are four main areas where water             BIER Brewery Water Use Ratios1
is used: brewhouse, cellars, packaging and utilities. In
                                                                                               N=211
addition, ancillary operations such as food service and
                                                                                               Range (2010) - 3.26 - 7.44 L/L
restrooms contribute to water usage.                                                           Improvement = 10%

Typical Brewery Water Use Per Area                                                                     4.74
                                                                                                                         4.52               4.28

                                                                      Water Use Ration (L/L)
           Water Use Per Department
             h1 Water/Total Beer

                                  Utilities
                                   20%
                Packaging
                   38%                                                                                 2008               2009              2010
                                Brewhouse
                                   25%
                                                                    This reduction over time seen in the brewing sector can
                        Cellars                                     be attributed to a number of factors, including: efficiency
                         17%                                        improvement, cost reduction, risk minimization, brand marketing
                                                                    and image enhancement. Several factors influence this ratio,
                                                                    such as packaging mix, pasteurization and volume brewed.
This section will identify the primary uses of water at craft
breweries. It will show trends in water usage and discuss
regulatory implications associated with water use. It will also                   Conclusions Drawn From The Bier Study
cover non-regulatory drivers as well as risks and opportunities
for cost savings.                                                                 •              The type of packaging used has a significant
                                                                                                 influence on water use ratios. Smaller packages
                                                                                                 (like 12 oz. bottles) tend to require more water use
1.1     Overview of Current Water Usage &                                                        than larger packages (like kegs).
        Wastewater Performance Trends                                             •              The size of the facility has a major influence
                                                                                                 on a brewery’s water efficiency. Facilities with
In 2011, the Beverage Industry Environmental Roundtable                                          larger production volumes tend to have lower
(BIER) performed a study to benchmark water use in the                                           water use ratios.
beverage industry and identify trends. In the graph below,                        •              Reducing water use reduces effluent load.
brewery data shows a consistent improvement in the                                               Focusing on water conservation will positively
industry-wide water use ratio. Although BIER members are                                         affect both water and wastewater reduction in
usually larger brewers, this trend and the conclusions can be                                    the brewery.
replicated as an example for craft brewers.

                                                                         Water and Wastewater: Treatment/Volume Reduction Manual                        7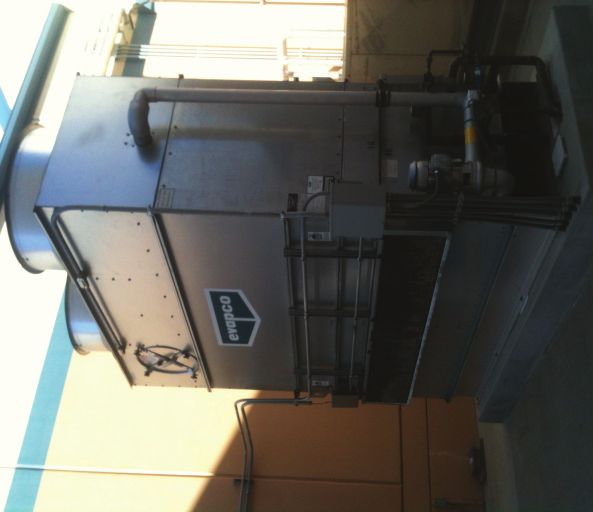
While specific risks vary among facilities, common examples of           A recent survey of craft brewers was conducted to identify
    water-related risks include water shortages and reliability, water       the current status of wastewater treatment or effluent
    quality issues that require additional water treatment, increasing       discharges. The main questions focused on current costs
    water costs, and supply chain interruptions. In regions where            and regulations around effluent and wastewater treatment.
    water is scarce, it can be challenging to meet basic human
    needs for clean water and sanitation. Intense competition for
    scarce water resources can occur among public water supplies,                Distribution Of 76 Breweries Included In Survey
    agriculture, industry, and fisheries. In the United States, the aging
    infrastructures for water supply will likely drive costs higher in the       Present in bar chart?
    future. Municipal water suppliers will soon be forced to find new            • 19 Breweries 0-1000 Bbls
    sources of capital to fund these initiatives.                                • 18 Breweries 1001-5000 Bbls
                                                                                 •    9 Breweries 5001-15,000 Bbls
    Climate change is predicted to magnify many of these                         • 10 Breweries 15,001-50,000 Bbls
    water risks. Increasing global temperatures will likely                      •    9 Breweries 50,001- 100,000 Bbls
    lead to increases in water demand, water scarcity, more                      • 11 Breweries 100,001 + Bbls
    vulnerable ecosystems, and more frequent extreme
    weather events.
                                                                             Relevant key results of this survey included:
    Map Of Water Short States2                                                   • Not many breweries have a dedicated onsite
                                                                                    wastewater treatment system. Most discharge their
                                                                                    effluent to a municipal treatment center.
                                                                                 • Some operations have some special collection of
                                                                                    high strength waste.
                                                                                 • About half did not have any pre-treatment installed
                                                                                    at their facility to treat the effluent prior to the
                                                                                    municipal discharge. Those who had some pre-
                                                                                    treatment mainly adjusted the pH and settled and
                                                                                    removed the solids.
                                                                                 • Wastewater costs are mainly determined based
                                                                                    on the incoming water purchased - only a few
                                                                                    brewers’ costs were based on the real flow of
                                                                                    effluent discharged (based on metering); the rest
                                                                                    were based on a formula or sampling.
                                                                                 • Approximately one third paid an extra surcharge
                                                                                    based on the effluent strength (BOD and TSS).

                                                                                 Survey Insight
    Today, a small craft brewer may not be the focus of regulatory
    restrictions in drought-prone regions. With increasing                       •   From a cost perspective, it is important to reduce
    population and demand for water, brewers can expect to                           water usage, not only to purchase less water,
    experience increased scrutiny and water-related business risk                    but to reduce wastewater costs based on the
    in the near future.                                                              amount of incoming water purchased.
                                                                                 •   Onsite pre-treatment will reduce the strength
    When looking at wastewater and effluent discharges                               of the effluent being discharged and may be
    in craft breweries, there is also a trend towards a more                         required by local authorities through ordinance or
    regulated (from local authorities) and more controlled                           permit. Discharge limits are being applied more
    system. Craft brewers in different states and cities are                         often to brewers because of the high organic
    increasingly questioned about wastewater or need to                              load untreated brewery effluent may contain.
    provide flow and chemical sampling data.

8    BrewersAssociation.org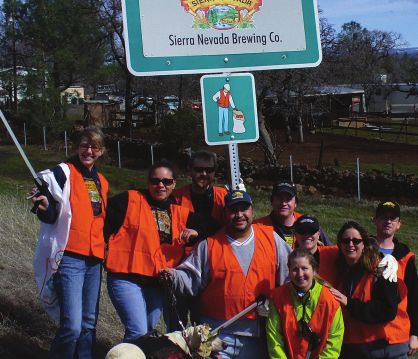
Segment Profile: Water Usage & Wastewater Generated by Craft Brewers

This manual focuses on reducing water and effluent first,         various stakeholders involved. These are often extended
and then reducing the strength of the effluent.                   legal proceedings around state and local water rights. In
                                                                  most cases, the craft brewer will not be directly involved
                                                                  or aware of these activities; however, these actions
1.2       Regulatory Drivers                                      will drive decisions that will impact the availability and
                                                                  cost of water and wastewater services provided to the
                                                                  brewer. Due to increasing populations and technology,
Demand for water in the U. S. more than tripled between           more resources are constantly needed to match lifestyle
1950 and 2000. This increase in demand has put further stress     expectations. With so many different needs for this scarce
on water supplies.                                                resource, priorities must be established. How much water
                                                                  should be used to extract natural gas, produce electricity,
Experts believe that in 2013, more than 70% of the United         irrigate agricultural crops, or used for human consumption
States is experiencing or will experience some type of local,     in the form of packaged beverages?
regional or statewide water shortage. By 2025, four billion
people - about half of the world’s population - will live in      Congress has passed legislation and the U.S. EPA has
‘severe water stress’ conditions.                                 introduced rulemaking to protect surface water bodies from
                                                                  pollution. The Clean Water Act regulates the discharge of
                                                                  pollutants into U.S. waters and establishes quality standards for
      Environmental Drivers                                       surface waters. Under the Clean Water Act, the following rules
                                                                  may directly or indirectly impact craft brewers operations.
      •   Stress on water supplies
      •   Risk of (local) water shortage                          Common legal drivers under the Clean Water Act
      •   Risk of (local) water pollution
                                                                      •    Effluent Limitations Guidelines: national standards
                                                                           for industrial wastewater discharges to surface
In addition to human needs, protection of endangered                       waters and publicly owned treatment works.
species and ecosystems will compete with available water              •    Pre-treatment Streamlining Rule: pre-treatment
supply. It is likely that the U. S. Environmental Protection               programs for the control of industrial discharges into
Agency (U. S. EPA) will introduce new laws and regulations                 sewage collection systems.
that keep water “in-stream” for species protection.                   •    NPDES Permit Program: regulating point sources
The ongoing debate of water for human consumption,                         (single, identifiable sources of pollution such as pipes
economic development, species protection, recreation,                      or man-made ditches) that discharge pollutants
tourism and flood control will continue into the future.                   into U.S. waters.
                                                                      •    Sewage Sludge (Biosolids) Rule: requirements for
Excessive water pollution can impact ecosystems. The high                  the final use or disposal of sewage sludge.
organic nature of brewery wastewater causes oxygen in                 •    Total Maximum Daily Load (TMDL) and Impaired
a surface water to be depleted at a rapid rate, which                      Waters Rules: states, territories, and authorized tribes
negatively impacts living species and biodiversity. A                      are required to develop lists of impaired waters that
number of water bodies in the United States remain above                   are too polluted or degraded to meet set water
pollution levels considered safe for ecosystems. Additional                quality standards.
regulatory restrictions are expected in the near future to
address this problem.                                             In addition, the Safe Drinking Water Act (SDWA) sets legal
                                                                  limits on levels of certain contaminants in drinking water.
An impaired waterway is a river, lake, stream, pond, bay, or
estuary that does not meet the water quality standards of the     In addition to these regulatory guidelines, there are
Clean Water Act and the state. The graphic below illustrates      also regional compacts that can govern water use and
the extent of impaired waterways in the United States.            wastewater effluent. There are groups (i.e., The Great Lakes
                                                                  Compact) working together to protect local watersheds. It
As a result of shortages, water allocation issues are             requires all water-intensive businesses within the watershed
escalating between political subdivisions because of the          to implement water conservation practices.

                                                                     Water and Wastewater: Treatment/Volume Reduction Manual          9
Photo Of Community Clean Up3
           Great Lakes Compact

           The Great Lakes—St. Lawrence River Basin Water
           Resources Compact is a legally binding interstate
           compact among the U.S. states of Illinois, Indiana,
           Michigan, Minnesota, New York, Ohio, Pennsylvania
           and Wisconsin. The compact details how the states
           manage the use of the Great Lakes Basin’s water
           supply and builds on the 1985 Great Lakes Charter
           and its 2001 Annex. The compact is the means
           by which the states implement the governors’
           commitments under the Great Lakes-St. Lawrence
           River Basin Sustainable Water Resources Agreement
           that also includes the premiers of Ontario and
           Quebec. The interstate compact seeks to ban the
           diversion of Great Lakes water, with some limited
           exceptions, and set responsible standards for water
           use and conservation within the basin.

     There are also general prohibitions for discharge to
     publicly owned treatment works (POTW). For example,            Some breweries partner with community members and
     in most local ordinances, there is a prohibition on pass       local organizations to conduct projects that improve water
     through or interference (“A User may not introduce into        use, water quality, and/or water management resources.
     a POTW any pollutant(s) which cause Pass Through or            Consider using Lean methods—such as a wastewater walk
     Interference”).                                                (to identify leaks and unnecessary drainage), kaizen event,
                                                                    or even a Lean design event—to rapidly brainstorm and test
     From a practical standpoint, this suggests that brewery        improvement ideas for projects, and include community
     wastewater must be screened for large particles (like bottle   stakeholders in those efforts.
     caps, broken glass, grains, etc.) and chemically pretreated
     for pH, temperature, and organic concentration.
                                                                        Key Efforts

     1.3      Non-Regulatory Drivers: Image/Brand,                      World Water Day - Every year on March 22, the UN-
              Community Ties                                            Water Partnership, comprised of 28 different UN
                                                                        organizations, celebrates World Water Day. World
     In addition to regulatory drivers, brand image and                 Water Day focuses public attention on water-
     positioning will drive many water and wastewater                   related issues and on sustainable management
     improvement programs at craft breweries. These efforts start       of freshwater resources. There are events held all
     with employees and can extend into the community.                  around the world, providing great opportunities for
                                                                        brewers to communicate efforts to help conserve
     Many breweries educate and engage employees in                     this precious resource.
     water-efficiency efforts at the facility and encourage
     them to adopt similar practices at home (e.g., check for           The Clean Water Act 40th Anniversary - The Clean
     leaks, use efficient appliances and faucets, turn off water        Water Act is one of the landmark environmental
     when not in use, etc.). Changing the water use culture in a        laws in the U. S. The year 2012 marked its 40th
     brewery can often be a challenge. Incentives, in the form          anniversary.
     of monetary or visual recognition, can play an important
     role in this effort.

10    BrewersAssociation.org
Segment Profile: Water Usage & Wastewater Generated by Craft Brewers
Along with the value of community engagement, these and employees alike see proactive efforts to improve the
strategies can improve the impact the facility has on local environment as an important and desirable attribute. This
water resources. Some leading global beverage companies increases customer loyalty and improves a brewery’s ability
have set goals to replenish the local water supply with at to attract and retain employees.
least the amount of water consumed.
People around the world view water issues as a key sustainability
challenge. For example, more than 90% of the 32,000 people
TCCC Water Stewardship Campaign polled for a GlobeScan and Circle of Blue survey in 2009
perceived “water pollution” and “freshwater shortage” to be
The Coca-Cola Company set three water stewardship serious problems (70% considered them very serious problems).
goals for its global operations. These goals are: Some companies can tap into significant market niches by
1. Reduce: By 2012, improve water efficiency by offering cus¬tomers water-efficient choices and solutions.
20% compared with a 2004 baseline. In essence,
this is an efficiency target not unlike many other
beverage companies have set. It is measured as Summary of Circle of Blue Survey
water use ratio, the amount of all water needed
to make one liter of beverage. General concerns
2. Recycle: By 2010, return to the environment – at a • 96% agree that it is important for all people to
level that supports aquatic life –the water used in have adequate, affordable drinking water.
the system operations through comprehensive • 88% worry that fresh water shortages will become
wastewater treatment. This is a water treatment an increasingly severe problem worldwide.
standard, whereby the company strives to clean
all wastewater from its operations to a very high Particular concerns
standard of cleanliness, often exceeding local • 57% is primarily concerned around water pollution
requirements. The goal is called recycle because the • 56% is concerned about the lack of safe
resultant discharge is clean enough to be recycled drinking water
in nature’s water cycles without harming aquatic life. • 47% is concerned about the lack of water for
3. Replenish: By 2020, safely return to nature and agriculture
to communities an amount of water equal to • 35% is concerned about the cost of water
what is used in the finished beverages and their
production. This goal depends on successful Who should be held responsible ensuring clean water
community water partnership programs and in communities?
eco-systems projects to be reached. For each • 44% water companies
can of Coca-Cola beverage an equivalent • 41% the government
can of water has to be given back, either to • 39% large companies (Note: 79% think that
communities in the form of potable water companies need to be a part of the solution)
(where this was not available before) or as clean • 30% individual citizens
water back to an eco-system. The latter can be • Little responsibility is placed on farmers and NGOs
achieved in a myriad of ways. For example,
replanting with native vegetation can increase Last, a majority (60%) of Americans believes that
the retention of water in the basin. Increasing individuals have the ability to contribute to the
groundwater recharge through reforestation solution when addressing water shortages, and 75%
or artificial aquifer recharge could also be indicate they need more information before they
considered as a replenishment activity. Coca- would feel able to help protect water.
Cola depends on external and independent
validation of the amount of replenishment
water they can claim for replenishment. Community ties give breweries the opportunity to promote
water conservation outside the four walls of the facility,
further supporting the brand and image. Saving water
Reducing water use and improving management processes and educating employees can be demonstrated through
can provide a competitive marketing advantage. Customers projects like rainwater harvesting.
Water and Wastewater: Treatment/Volume Reduction Manual 115 Seasons Brewery Rainwater Harvesting Water Cost Considerations
Not only were the folks behind this microbrew Common Costs Associated with Water Use (Box 7)
looking to save water, they want to educate
people. According to Randy Kauk, President of • Raw Material Costs:
RainHarvest Systems: ° Water purchased from utilities; marginal costs
of purchasing additional water versus costs
“We are extremely excited with our new of conservation
partnership with 5 Seasons Brewery. We believe ° Cost of water treatment, filtering, and
it uniquely demonstrates the broad array of softening before use
applications where rainwater can be used ° Costs for chemicals needed to treat and
instead of chemically treated drinking water; plus manage water
it is a great way to create public awareness of • Energy Costs:
rainwater harvesting. ” ° Cost of energy to heat water
° Cost of energy to pump water from its source,
or within the facility itself
Addressing water and wastewater issues should be critical ° Energy and labor costs for operating and
elements on any brewery’s agenda. Linking local efforts maintaining water-using equipment
to larger national and global events is one effective • Pollution Control Costs:
approach to raising awareness among employees and in ° Wastewater and stormwater service rates,
the community. including surcharges
° Total cost of treating wastewater for
disposal, including labor, energy, chemicals,
1.4 Risks and Opportunities: Water Use Reduction equipment, and residual disposal
and Wastewater Management ° Marginal costs of increasing effluent
treatment capacity when water demand
Water supply and wastewater discharges present a number increases
of risks and opportunities for craft brewers. As with any • Regulatory Compliance Costs:
business investment, a cost benefit analysis should support ° Labor costs for regulatory compliance
any decision to expend resources in these areas. activities such as completing permit
applications, monitoring compliance,
Historically, capital to support water usage reductions has and reporting wastewater discharges to
been difficult to justify due to the low tap fees associated regulatory agencies
with municipal water supplies in the United States. Even using
the full cost of water accounting methods, water reduction
and re-use projects often do not meet brewery hurdle rates It requires a lot of energy to move and use water, so water
for expenditures. Many craft brewers have justified these savings result in cost savings. Approximately 20% of all the
projects based on image and community drivers alone. energy used in the state of California is used to move,
12 BrewersAssociation.orgSegment Profile: Water Usage & Wastewater Generated by Craft Brewers
use, and treat water. Although water savings projects are The price of water continues to increase. This increase has
often not cost effective due to the low price of water in the affected the cost of utilities in many municipalities.
US, when the electricity savings are also included, it adds
another layer of savings. Increase In Municipal Utility Costs
The largest driver to date has been wastewater
$150 $150 $150 $150 $150 $150
$100 $100 $100 $100 $100 $100
compliance. In order to meet wastewater effluent $50
$0
$50
$0
$50
$0
$50
$0
$50
$0
$50
$0
2010 2011 2012 2010 2011 2012 2010 2011 2012 2010 2011 2012 2010 2011 2012 2010 2011 2012
regulatory requirements, many craft brewers have initiated San Diego Santa Fe San Antonio Milwaukee New York Philadelphia
reduction projects. Most breweries are charged for their
2010 2011 2012
wastewater based on the incoming water purchases as 50 Gallons/Person/Day 50 Gallons/Person/Day 50 Gallons/Person/Day
well on the strength of the effluent. 100 Gallons/Person/Day
150 Gallons/Person/Day
100 Gallons/Person/Day
150 Gallons/Person/Day
100 Gallons/Person/Day
150 Gallons/Person/Day
There are many incentives that focus on water use and Trends in consumer prices (CPI) for utilities
wastewater reduction. Reducing the effluent load and 400
decreasing water use will reduce bottom line costs. Brewers
should recognize that reduced water usage will result in 360
lower wastewater discharges; however, the concentrations
320
of pollutants in this case may be higher. It is important to
check this potential increase in concentration against 280
regulatory limitations.
240
The following graphic illustrates typical annual wastewater 200
surcharges for different sized breweries.
160
Example Of Typical Annual Wastewater Surcharges
120
Annual Beer 2bbl ww/bbl 4bbl ww/bbl 10bbl ww/bbl 80
Production beer beer beer
40
(bbl)
1978
1980
1982
1984
1986
1988
1990
1992
1994
1996
1998
2000
2002
2004
2006
2008
2010
1,000 - 15,000 $550 - $8,200 $1,100 - $16,400 $2,800 - $41,000
15,000 - 100,000 $8,200 - $54,700 $16,400 - $110,000 $41,000 - $274,000
1000,000 - 600,000 $54,700 - $328,000 $110,000 - $656,000 $274,000 - $1,700,00 When considering the above items, it becomes clear that
6,000,000 - 2,000,000 $328,000 - $1,100,000 $656,000 - $2,200,000 $1,700,000 - $5,500,000 water management and wastewater minimization efforts
>2,000,000 >$1,1,00,000 >$2,200,000 >$5,500,000 make good business sense from both a cost savings and
from a business continuity perspective.
Water and Wastewater: Treatment/Volume Reduction Manual 13section two
Data Management
Data management is more than just a component of a well as installing water meters on processes that use large
successful program – it is a necessity for a successful business amounts of water and have a history of inconsistency.
strategy. As discussed previously, there are both risks and Understanding water use is critical to starting an effective
opportunities in water and wastewater management. conservation program.
Making informed business decisions to minimize risk and
maximize opportunity requires effective data management. Where to start?
Effective Data Management System 1. Where is the water going?
2. How much water is used? What are typical values?
3. How much water is discharged?
GATHERING 4. What’s in the water discharge? What are typical
EVIDENCE
values?
5. How can water use and discharge be managed?
TARGET WORKING Brewery Size Versus Wastewater Generation
SETTING WITH DATA
Annual Beer Production ww @ 2bbl ww/bbl beer ww @ 4bbl ww/bbl beer ww @ 10bbl ww/bbl beer
gallons/ gallons/ gallons/
bbl gallons bbl/year bbl/year bbl/year
day day day
READING AND 5,000 155,000 10,000 850 20,000 1,700 50,000 4,200
ANALYSING DATA
1,500 465,000 30,000 2,550 60,000 5,100 150,000 12,700
300,000 9,300,000 800,000 51,000 1,200,000 102,000 3,000,000 255,000
1,000,000 2,000,000 170,000 4,000,000 340,000 10,000,000 850,000
This section covers best practices in data management,
from establishing a data collection routine and ensuring the The ability to collect or estimate water consumption
data is accurate, to creating key performance indicators data by process step can lead to more effective water
and setting goals. conservation practices.
The previous section identified five main uses of water in a
2.1 Data Collection brewery or brewpub:
1. Brewhouse
2. Cellars
Successful data management enables cost-effective 3. Packaging
decisions to be made. Data management often goes 4. Utilities
beyond collecting usage and cost data from a monthly 5. Ancillary
utility invoice. It includes identifying process areas, support
functions, and facility operations that have the greatest A third party utility bill will often provide usage and cost
opportunities for improvement. Strategies include tracking data for the main water meter only. Creating a formal mass
water metrics as part of process improvement activi-ties, as balance of water and wastewater in the brewery is often
14 BrewersAssociation.orgData Management
costly and resource intensive; however, there are some data Installing sub-meters at key locations is the best way
management steps that can be completed early in a water to quantify and segregate water usage. Pulse output
conservation program using a survey checklist. mechanical meters allow for automatic data collection,
reducing measuring errors, and eliminating manual reading
of the meters.
Survey Checklist Example
1. Map the brewery’s water distribution network Using Water Meters To Identify Opportunities
and mark the routes of major pipes and drains on
the site plan. Are the drawings up to date? Revised procedures help brewery to reduce hot
2. Identify the major points at which water is used. liquor waste
3. Identify the major of wastewater discharge.
4. Identify the content of the effluent (yeast, trub, The Brewery operated by Hardys & Hansons had a
etc.), if possible. single, cold liquor tank, situated outside the Brewery
5. Estimate the amount of water used and on the South side. A second tank, twice the size of
discharged at each major point. the first, was subsequently installed to meet authority
6. Identify the water quality and availability at each storage requirements. Flow into and out of the tanks is
[major] point. controlled from the brew-house using actuated valves.
7. Include designations for hot, cold and
drainage systems. During hot weather, the temperature of the cold
8. Check water use in different areas of the brewery liquor rose from 12°C to 20°C. This, combined with
when production has ceased. If liquid is flowing an outdated heat exchanger, produced an excess
through pipes or drains, either there is a leak or of low quality hot liquor which had to be diverted to
equipment has been left switched on (potential drain. The wort also required further cooling in the
energy savings). fermenters before a brew could begin.
9. Label pipework, valves and manholes for easy
identification. Installing water meters helped to identify these
problems. Procedures have been revised to
allow the brewer to bypass one of the cold liquor
This task and checklist is often helpful for a new employee to tanks, depending on demand and the ambient
fully and quickly understand the brewery and its processes. temperature. Cold liquor storage time is now
These checklists are also a good opportunity to partner with minimized and temperature gain reduced. A further
interns from a local university or trade program. reduction in hot liquor waste has been achieved by
automating flow through the heat exchanger and
Keep in mind that a detailed water balance can be difficult to adding a chilled water section. In addition, the hot
do because of evaporation losses. Evaporation, particularly liquor retained is of a higher quality and processing
from refrigeration plants, can account for as much as 25% has been speeded up.
of incoming water usage. Wastewater treatment also has a
high rate of evaporation.
A single meter isn’t capable of providing enough details on
water usage in different process steps, so installing additional
Common Survey Findings meters is highly recommended. If installing sub-meters is not
possible, there are several other ways of estimating water
• Unidentified and cross connections volume. In places where water is transported in a constant
• Broken and incorrectly set valves flow, read the pump capacity and multiply this flow by the
• Leaks operating hours. Be careful when using this method and
• Excessive, unnecessary and unknown use don’t assume that the equipment is actually doing what
• Clean water discharges directly to effluent (e.g., it says on the nameplate. Be sure to check the numbers
cooling water) against expected outputs.
• Unauthorized discharges to effluent
• Surface water drainage from potentially
contaminated areas
Water and Wastewater: Treatment/Volume Reduction Manual 15Flow Measurement Considerations Wastewater Flume
• How accurate does the data have to be? A flume is an open artificial water channel, in the form
• Does the data need to be trended or will a one- of a gravity chute that leads water from a diversion
off measurement suffice? dam or weir completely aside a natural flow. A flume
• What is the size and material of the pipe? can be used to measure the rate of flow. Specific
• What is the operating pressure and temperature? designs include the Venturi, Parshall, Palmer-Bowlus,
• What is the expected flow range (min to max)? trapezoidal, and H-Flume.
• Are there any existing meters that can be
connected to a data logger or transmitter?
• When a tank is filled on demand, which is based Unlike incoming water, it is important to sample other parameters
on low-level/high-level switches, count the besides volume on a regular basis, since most utilities have a
number of filling cycles. Determine the time it surcharge cost for brewers based on organic and solids sent
takes to fill one gallon in a bucket. This can help to the municipal treatment system. A surcharge is established
estimate the water flow. to recover the cost of transporting and processing wastewater
that exceeds levels normally associated with typical household
(domestic) wastewater levels.
As described in the previous section, many utility
companies estimate wastewater effluent volume based
on a percentage of incoming water billings. There Typical Domestic Wastewater Levels
are allowances for domestic use and calculating the
amount of water leaving the site in the product and Biochemical Oxygen Demand – less than 400 ppm
through evaporation. This method requires assumptions Total Suspended Solids – less than 400 ppm
on the amounts of water used in flush toilets, wash basins, Oil & Grease – less than 100 ppm
canteens, etc. When using this method, inform the utility
of any changes in staff numbers or modifications to staff
facilities. These changes may affect water consumption A surcharge by a municipality is typically determined by using
and the allowance for domestic use. laboratory test results from wastewater samples taken from the
discharge of the brewery where it enters the municipal system.
Determine if rainwater is discharged to the same sewer The current water consumption and established municipal
system as process effluent. It may be beneficial to separate surcharge rates are used to calculate additional fees beyond
these flows, especially when there is an onsite pre-treatment those required of domestic wastewater discharges.
facility.
Before contacting your municipal water agency, an effective
first step for a responsible brewer involves contacting a private
Labeling Process And Storm Drains laboratory to analyze a composite wastewater sample. This
knowledge can help to establish the most effective strategy
A simple way to separate for approaching the water agency.
sewage water (effluent) DUMPI
NO
NG
and surface water (rain water) Samples can be taken either by the brewery or by the
is to label or color-code all utility and can be either spot samples or 24-hour composite
drains. This will allow easy samples. The choice will depend on the utility requirements.
KE
DR
AI
identification of the N S T O LA
different pipes.
Composite Wastewater Sampling
Installing a wastewater meter or demonstrating a different A 24-hour sample will generally give a more reliable
ratio may be beneficial for a craft brewer; however, flow measurement, since any peaks due to the variations
measurement becomes quite inaccurate when solids are in the brewery process are leveled. A flow-weighted
present in the effluent, as is the case with brewing effluent. composite sample can be taken, which is the most
The most accurate flow measurements can be obtained accurate measurement, as it compensates for the
using a flume, although it is usually not easy to find the right flow variations of the effluent during the day.
conditions for installation.
16 BrewersAssociation.orgData Management
Be aware that brewery effluent is highly degradable and Typical Ranges Of Brewery Pre-Treated “End-Of-Pipe”
thus samples need to be stored properly. Samples must be Wastewater Effluent
kept at the proper temperature and measurements should PARAMETER TYPICAL RANGES
be performed as soon as possible. Any pH measurements BOD 100 - 400 ppm
should be performed immediately, since the result will vary
pH 6-9
after a few hours.
TSS 50-500 ppm
Each brewery will have different wastewater concentrations;
however, there are typical values and ranges of key Although each brewery is different, breweries can generally
components that have been associated with untreated achieve an effluent discharge of 3 to 5 liter/liter (considered
brewery effluent. an industry best practice goal) of sold beer (exclusive of
cooling waters).
Typical Ranges Of Brewery Untreated “End-Of-Pipe”
Wastewater Effluent Effluent from individual process steps is variable. For example,
PARAMETER TYPICAL RANGE washing bottles produces a large volume of effluent that
Water to beer ratio 4 - 10 liter/liter
contains only a minor amount of the discharged organics
from the brewery. Effluent from fermentation and filtering are
Wastewater to beer ratio 1. 3 - 2 liter/liter lower than
water to beer ratio high in BOD and low in volume, accounting for about 3% of
total wastewater volume but 97% of BOD. The average pH
Biochemical Oxygen Demand (BOD) 600 - 5,000 ppm of combined effluent is around 7. But this can fluctuate from
Chemical Oxygen Demand (COD) 1,800 – 5,500 ppm 3 to 12 depending on the use of acid and alkaline cleaning
Nitrogen 30 - 100 ppm agents. The pH of waste beer usually ranges between 4 and
Phosphorus 30 - 100 ppm 5. CIP effluent temperatures average about 86°F.
pH 3 - 12
Most brewers discharge over 70% of their incoming water
Total Suspended Solids (TSS) 200 – 1,500 ppm
as effluent.
Main Areas Of Wastewater Generation
SOURCE OPERATION CHARACTERISTICS
Mash Tun Rinsing Cellulose, sugars, amino acids. ~3,000 ppm BOD
Lauter Tun Rinsing Cellulose, sugars, spent grain. SS ~3,000 ppm, BOD ~10,000 ppm
Spent Grain Last running and washing Cellulose, nitrogenous material. Very high in SS (~30,000 ppm).
Up to 100,000 ppm BOD
Boil Kettle Dewatering Nitrogenous residue. BOD ~2,000 ppm
Whirlpool Rinsing spent hops and hot trub Proteins, sludge and wort. High in SS (~35,000 ppm). BOD ~85,000
ppm
Fermenters Rinsing Yeast SS ~6,000 ppm, BOD up to 100,000 ppm
Storage tanks Rinsing Beer, yeast, protein. High SS (~4,000 ppm). BOD ~80,000 ppm
Filtration Cleaning, start up, end of filtration, leaks during Excessive SS (up to 60,000 ppm). Beer, yeast, proteins. BOD up
filtration to 135,000 ppm
Beer spills Waste, flushing etc 1,000 ppm BOD
Bottle washer Discharges from bottle washer operation High pH due to chemical used. Also high SS and BOD, especially
thru load of paper pulp.
Keg washer Discharges from keg washing operations Low in SS (~400 ppm). Higher BOD.
Miscellaneous Discharged cleaning and sanitation materials. Floor Relatively low on SS and BOD. Problem is pH due to chemicals
washing, flushing water, boiler blow-down etc. being used.
Water and Wastewater: Treatment/Volume Reduction Manual 172.2 Ensuring Accuracy
Typical KPIs for Water
After data measures for water usage and wastewater Facility-Wide Metrics
are identified and quantified, the information should be • Volume of water used each month or other
reviewed for accuracy. Without reliable data, especially as appropriate time period (e.g., gallons/month or
the starting point, it will be difficult to track progress. Having gallons/shift)
accurate initial data is also important to monitor for new • Volume of wastewater (e.g., gallons/month or
water usage and wastewater generation, identify mid-point gallons/shift)
goal milestones, and cost savings. To verify the data, three • Water used for specific end uses (e.g., gallons/
key questions are: per month for outdoor irrigation, cooling water
evaporation, heated process water, bathrooms
• Does the volume of water used and wastewater and kitchens, etc.)*
generated appear reasonable based on the
amount of beer produced? Metrics Normalized to Production
• Is the volume of water used and wastewater • Volume of water used per product (e.g., gallons/
discharged consistent with historical volumes (e.g., pound of product, gallons/product)
last month and the same time last year)? • Volume of wastewater discharged per product
• Is there any missing data that should be included (e.g., gallons/pound of product or gallons/product)
(e.g., new wastewater stream, or one-time beer
dump due to quality issues)?
KPIs are often used internally to manage a water reduction
After the data is verified and approved, the information program by encouraging comparison over time. Initially, there
should be shared with team members, such as brewery may only be one or two KPIs that focus on basic water streams.
employees and management. Breweries that have As the water management program matures, KPIs may
collected information for several years can report progress change or new KPIs may be created to encourage continuous
toward water reduction goals and overall cost savings. It is improvement, especially in areas that may be lagging behind.
always important to openly communicate both the starting
point and the ultimate goals and targets that the brewery is Once KPIs have been defined, breweries should establish an
aiming to achieve. annual internal benchmarking plan. Assign data management
roles to brewery personnel so that the data set can be built
up throughout the year. Repeat the benchmarking exercise
2.3 Benchmarking: Key Performance each year and report progress on goals.
Indicators (KPIs)
When there is confidence in the accuracy and performance
Key Performance Indicators (KPIs) are defined by breweries of the brewery water data set, consider sharing benchmarking
to measure the effectiveness of a reduction program over results with external stakeholders, customers, and peers.
time. Defined KPIs are standard points of reference that Sharing this information could be as simple as including statistics
provide valuable insight into a program’s performance. on a brewery tour, including performance information on the
KPIs are usually defined as a rate or ratio (e.g., total water brewery website or social media outlets, such as blogs or Twitter
use ratio) instead of a quantitative total, such as total feeds, or producing a basic sustainability report document. As
water used. facility benchmarking continues to mature, the brewery may
also consider reporting performance to external stakeholders.
18 BrewersAssociation.orgData Management
Data Flow Progression
Considerations For Goal Setting
Data verification • Prioritize opportunities: What is most important for
the brewery in the short term? What opportunities
are good for the brewery, but could wait a few
years for implementation?
• Set meaningful targets and align goals with a
philosophy: Make sure goals are meaningful
and realistic – building the brewery’s philosophy
Set internal goals
into water reduction goals will boost interest
and enthusiasm for the program. Set attainable
performance targets to ensure the brewery is
Assign data management effectively working toward goals.
responsibilities to • Establish a benchmarking plan: A benchmarking
employees
plan will ensure continuous improvement over
time. Plans will vary based on brewery size and
program maturity.
• Look at the big picture: Think beyond primary
goals to larger objectives (e.g., employee
Gather monthly data report
engagement in water reduction, expanding the
understanding of water across the entire brewery
lifecycle, from supplier to consumer).
Verify accuracy of data Targets are designed to be more stringent and specific than
goals. Often, targets are set in response to goals. For example,
the brewery may set a goal of 6 liters of water per liter of
beer produced by 2020, and set targets for a continuous
Analyze data and track improvement of 20% water reduction every two years. While
progress with respect to goals goals should align with the brewery’s philosophies and may
be more aspirational, targets should be more realistic and
attainable.
Review KPIs and set new goals What are good targets?
• Have a set deadline
• Are ambitious, yet attainable
Once the water management program is established • Are quantifiable
and KPIs have been calculated for several periods, • Are relevant to program improvement
benchmarking the brewery to peer companies and sector • Can be reassessed and enhanced after original
averages will help gauge the effectiveness of the program. target is met
2.4 Guidelines for Setting Measureable Goals New Belgium Brewing Company Water Target
and Objectives
New Belgium Brewing Company has defined water
Establishing goals and objectives to reach a desired future stewardship as responsible consumption through
state will drive continuous improvement in the water minimizing waste and protecting watersheds. They
reduction program. Several important things to consider have set a water use target of 3.5:1.0 ratio by 2015.
when defining objectives and setting goals:
Water and Wastewater: Treatment/Volume Reduction Manual 19section three
Usage & Reduction Best Practices
Increasing yield and reducing beer loss should always be more attractive, especially if future price increases are
the first priority in any resource efficiency program. Reducing taken into account and value is put on business continuity
the amount of beer being spilled and wasted saves water, and water reliability.
energy and ultimately, provides an immediate cost return.
Full Cost of Water
Water reduction programs usually follow beer loss programs.
There are usually some quick fixes for brewers just starting Costs Price of Sewer Cost of energy and Labor and other
Associated = incoming Service chemicals needed to costs associated
water reduction programs. The costs of even minor leakage
with water water Charge process water with water
use processing and
is often overlooked or underestimated.
treatment
The “price on the water bill”
As previously discussed, water reduction projects have been
The cost of water use at a facility can be much
difficult to justify based on the cost of water; however, if the greater than the amount on the water bill.
full cost of water is calculated, some projects may become
Cost of Water Leaks
Leak detection is cost-effective. The Eagle Brewery operated by Charles Well Ltd has a comprehensive utility monitoring
system that covers the water supply to the main process areas. Since it was installed, the system has paid for itself
many times through rapid identification of leaks. Continuous metering allows the brewery to identify changes in
normal water use due to leakage from a single component, like a valve, as well as identifying major leaks. Example
faults and the estimated potential hourly costs are listed below
FAULT ESTIMATED POTENTIAL COSTS (U.S.$/HOUR)
Hose left on 14.00
Bottle pasteurizer rinse jets left switched on 14.00
Bottle rinser left switched on 6.10
Leaking float valve on the cooling tower 4.10
Leaking ball valve on the bottle pasteurizer 2.00
Leaking ball valve in the keg plant 1.90
Pasteurizer header tank top-up valve jammed 1.65
20 BrewersAssociation.orgUsage & Reduction Best Practices
When calculating the potential savings from a particular It is important to challenge the status quo (“this is the way
measure, there may be savings in the cost of: it has always been done”) when looking for water and
wastewater reductions. The following questions can be
• Water use useful when starting a water reduction initiative or when
• Onsite water pumping and associated maintenance reviewing a mature program on a regular basis:
• Water treatment (chemicals, filter backwash, etc.)
• Water heating or cooling Is the process or activity necessary?
• Effluent pumping • Is it necessary to use water?
• Effluent treatment • Why does the process use so much water?
• Effluent discharge • Can the amount of water be reduced?
• Can lower quality water be used?
Example Of Total Unit Costs • Can water be recovered elsewhere?
• Is the process authorized and legal?
Table 3: Costs Associated with Water Used in an Industrial Process • Is it necessary to produce wastewater or effluent?
Activity Unit Cost ($/1000 Gallons)
• Is clean water going down the drain?
• Is the discharge authorized and legal?
City Water Purchase $3.55
• Would it be cost effective to treat wastewater or
effluent onsite for re-use?
Sewer Rate $3.99
Deionized using reverse osmosis
Equipment $0.57 Ways to reduce water use range from simple strategies, such
Energy $1.20 as adjusting flow or install¬ing water-conserving equipment,
Labor $1.43
to more involved options, such as reusing water or switching
to a low-water or waterless process.
Total Deionized water $2.31
Deionized water (flexible cost)* 40% x $2.31 = $0.92
Impact – Difficulty Matrix
Wastewater treatment
Sludge disposal $3.46
Treatment chemicals $2.44
Energy $0.32
High
In
Labor $6.25 cr
ea
Total wastewater treatment $12.47 sin
Wastewater treatment (flexible cost)* 40% x $12.47/gallon = $4.98 g
De
Total cost of water $13.44 sir
* Flexible cost savings of conserved water is estimated to be 40 percent of total investment cost
a bi
Low lit
y
Besides these total costs, some additional cost savings may
be calculated from: Low High
• Increased beer production
• Greater recovery of materials suitable for sale as Difficulty
animal feedstock
• A delayed requirement of additional water storage
capacity There are five general types of water-saving strategies,
• Increased production without having to upgrade ranging from easy to more difficult implementation, but also
the water supply system moving to a bigger impact. Consider these strategies when
• Lower capital expenditures on a planned or future brainstorming ideas in cross-functional team meetings and
effluent treatment system other improvement efforts.
Water and Wastewater: Treatment/Volume Reduction Manual 21You can also read