Water surface and velocity measurement-river and flume
←
→
Page content transcription
If your browser does not render page correctly, please read the page content below
Loughborough University
          Institutional Repository

Water surface and velocity
 measurement-river and
         flume
This item was submitted to Loughborough University’s Institutional Repository
by the/an author.

Citation: CHANDLER, J.H. ... et al, 2014. Water surface and velocity
measurement-river and flume. The International Archives of the Photogram-
metry, Remote Sensing and Spatial Information Sciences, Volume XL-5. ISPRS
Technical Commission V Symposium, 23rd-25th June 2014, Riva del Garda,
Italy. Copernicus Publications, pp. 151-156.

Additional Information:

   • This is a conference paper.

Metadata Record: https://dspace.lboro.ac.uk/2134/15724

Version: Published

Publisher: Copernicus GmbH on behalf of the ISPRS

Rights: This work is made available according to the conditions of the Creative
Commons Attribution 3.0 Unported (CC BY 3.0) licence. Full details of this
licence are available at: http://creativecommons.org/licenses/by/3.0/

Please cite the published version.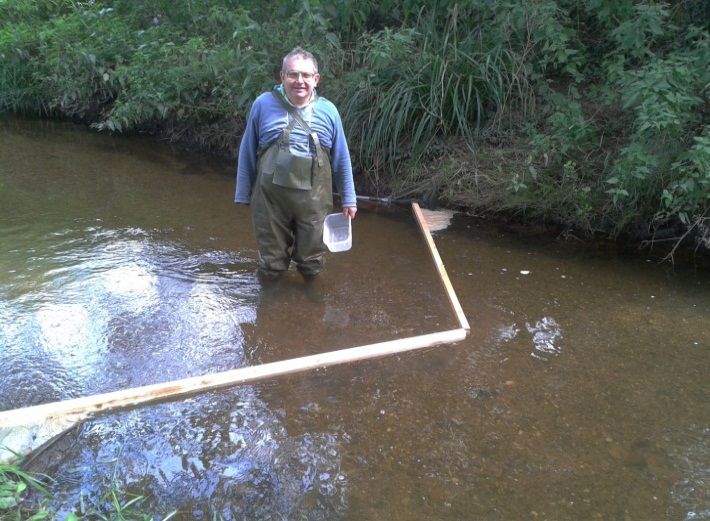
The International Archives of the Photogrammetry, Remote Sensing and Spatial Information Sciences, Volume XL-5, 2014
                        ISPRS Technical Commission V Symposium, 23 – 25 June 2014, Riva del Garda, Italy

        WATER SURFACE AND VELOCITY MEASUREMENT- RIVER AND FLUME

                                      J.H. Chandlera * , E. Ferreiraa, R. Wackrowa and K Shionoa
                        a
                            Dept. Civil and Building Engineering, Loughborough University, LE11 3TU, UK–
                                                      J.H.Chandler@lboro.ac.uk

                                                      Commission V, WG V5

 KEY WORDS: Hydrology, Change Detection, Automation, Sequences, Multisensor

 ABSTRACT:
 Understanding the flow of water in natural watercourses has become increasingly important as climate change increases the
 incidence of extreme rainfall events which cause flooding. Vegetation in rivers and streams reduce water conveyance and natural
 vegetation plays a critical role in flood events which needs to be understood more fully. A funded project at Loughborough
 University is therefore examining the influence of vegetation upon water flow, requiring measurement of both the 3-D water
 surface and flow velocities. Experimental work therefore requires the measurement of water surface morphology and velocity (i.e.
 speed and direction) in a controlled laboratory environment using a flume but also needs to be adaptable to work in a real river.

 Measuring the 3D topographic characteristics and velocity field of a flowing water surface is difficult and the purpose of this
 paper is to describe recent experimental work to achieve this. After reviewing past work in this area, the use of close range digital
 photogrammetry for capturing both the 3D water surface and surface velocity is described. The selected approach uses either two
 or three synchronised digital SLR cameras in combination with PhotoModeler for data processing, a commercial close range
 photogrammetric package. One critical aspect is the selection and distribution of appropriate floating marker points, which are
 critical if automated and appropriate measurement methods are to be used. Two distinct targeting approaches are available: either
 large and distinct specific floating markers or some fine material capable of providing appropriate texture. Initial work described
 in this paper uses specific marker points, which also provide the potential measuring surface velocity. The paper demonstrates that
 a high degree of measurement and marking automation is possible in a flume environment, where lighting influences can be
 highly controlled. When applied to a real river it is apparent that only lower degrees of automation are practicable. The study has
 demonstrated that although some automation is possible for point measurement, point matching needs to be manually guided in a
 natural environment where lighting cannot be controlled.
                                                                      single point through time, normally for providing flood
                    1. INTRODUCTION                                   warnings. Measuring the true water surface therefore requires
                                                                      sampling elevations at multiple locations in space, at an
The modelling of water flow in natural watercourses by                appropriate density and, ideally captured at an instant in time.
computational fluid dynamics (CFD) incorporates several               The scientific literature reveals only a few instances where this
uncertainties due to the great complexity of the phenomena            has been achieved.
involved at assorted scales. An overlooked factor reducing
water conveyance and therefore increasing flooding incidence is       Thomson et al. (1999) generated elevation maps representing
natural waterborne vegetation, which varies both temporally and       the water surface of a reach of the North Saint Vrain Creek,
spatially. A funded project at Loughborough University is             Colorado at a range of discharges. Their data appear to have
therefore examining the influence of such riparian vegetation         been collected by level and staff using a series of cross-sectional
upon water flow, requiring detailed measurement of both the 3D        surveys, typically adopted at the time. The availability of total
water surface and surface flow field velocities. A laboratory         stations and terrain modelling software subsequently helped to
flume provides the ideal environment to capture detailed              improve the ease of data collection, by removing the need to
empirical data in a controlled environment. However, there is a       measure along a linear line. However, such approaches still
concern that real processes and interactions can be overlooked        required the manual movement of the prism and consequently a
unless limited experimental work is conducted on a real river to      surface which strictly was not captured at an instant in time.
avoid issues relating to scale.
                                                                      The ability of the camera to freeze motion has long been
This paper reports on the use of close range digital                  recognised. Fraser and McGee (1995) used synchronised large
photogrammetry, to measure both the topographic surface               format CRC-1 cameras to capture 71 floating targets during the
created by a dynamic and flowing water and surface velocity           filling of a lock in the USA. Quoted accuracy was 2 cm,
vectors representing the surface flow field. A key aspect was to      achieved at a frequency of 8 Hz during the eight minutes
develop a technique that could be used in both a laboratory           required for a 26m to lift cycle. Chandler et al. (1996) also used
flume environment but could also be applied on a real river.          two synchronized analogue cameras in an oblique perspective.
Access to just inexpensive hardware and software is required,         Two Hasselblad ELX cameras, modified to include a reseau
through the use of a pair of synchronised digital SLR cameras         plate, were used to measure the confluence of a pro-glacial
and proprietary close range photogrammetric software.                 meltwater channel, immediately downstream of the Upper
                                                                      Arolla glacier in Switzerland. They used 60 polystyrene fishing
                                                                      floats as marker points, constrained by six fishing lines. Images
         2. WATER SURFACE AND VELOCITY                                were scanned and off–the-shelf image processing software was
            MEASUREMENT- PAST WORK                                    used to measure the centroids of each target. A self-calibrating
                                                                      bundle adjustment was then used to derive XYZ coordinates
Water elevation or “stage” is routinely measured at many river        and consequent digital elevation models (DEMs).
locations but is always restricted to recording elevation at a

                                               This contribution has been peer-reviewed.
                                               doi:10.5194/isprsarchives-XL-5-151-2014                                          151
The International Archives of the Photogrammetry, Remote Sensing and Spatial Information Sciences, Volume XL-5, 2014
                         ISPRS Technical Commission V Symposium, 23 – 25 June 2014, Riva del Garda, Italy

Stereo image sequences have been used to capture the dynamics        Chandler et al., 1996) then it is possible to determine both
of waves in a range of studies. Piepmeir and Waters (2004)           surface morphology and velocity, if a sequence of images is
review the use of stereopairs methods for measuring water            required. However, the number and distribution of points is
waves created in laboratory flumes. In particular, they describe     critical if a dense surface representation is to be created.
the problem of creating texture on the surface, which is             Automation in the measurement chain can be challenging,
sufficiently distinct and unique to facilitate measurement. They     particularly if the frequency of an image sequence is
note how various authors have “polluted” the water, utilizing        incompatible with the predicted flow velocity. Alternatively, if a
specialized lighting to provide suitable texture that can be         measurable surface texture can be distributed evenly that
measured. This is a key problem for measuring a material that is     generates image patches which are consistent from different
generally reflective and transparent. Their own solution             camera positions and not affected by random spectral
involved generating a fine mist to provide an appropriate texture    reflections, then there is the potential of creating a dense
and minimize reflections, but do not provide the details             morphological representation fully automatically, using either
necessary to achieve this.                                           stereo (e.g. Han and Endreny, 2014) or even perhaps MVS
                                                                     DEM generation methods. Surface water velocities could also
Both Santel et al. (2004) and de Vries et al. (2010) apply stereo    be potentially possible using a PIV-based approach, although
methods to capture breaking surf waves in the more challenging       discrete targets could not be tracked individually.
outdoor coastal environment. Both studies used comparatively
simple point matching methods to generate digital surface            The work conducted so far has used the former targeting
models. Santel (2004) achieved this in an area of 200×200 m2,        solution, involving the sourcing of appropriate floating marker
represented by 20,000 conjugate points generated from 200            points. Selection of such markers has always been challenging
manually measured seed locations. Accuracies were difficult to       and there are a range of requirements, which are often mutually
estimate because of the lack of control but comparisons with a       exclusive. To allow full automation in the measurement process
tide gauge suggested differences of 5 cm were typical. de Vries      targets need to appear sufficiently distinct and spherical in an
et al. (2010) applied stereo photogrammetry also, but in both the    image sequence. If working in a river, then ideally they need to
flume and field environment; taking advantage of a pier to           be biodegradable or at least collectable to avoid polluting the
support the two synchronised cameras. They fully describe the        natural environment. This is not such an issue when working on
use of a standard normalised correlation method to achieve           a laboratory flume, but any material must be retrievable and
image correspondences. Accuracies were also assessed by              must not damage expensive infrastructure such as filters or
comparing elevations with the tidal gauging station, but by          pumps. After trying a range of materials, including
averaging elevation across time and space. A more useful             biodegradable packing chips (Chandler et al, 2008), translucent
comparison was possible in the flume study, through the use of       plastic spheres originally manufactured for roller ball-based
a pressure sensor mounted on the flume bed. Water depth              deodorants were selected. These are mass manufactured and
comparisons through time revealed good correspondences and           therefore reasonably cost-effective. They are also available in a
an overall RMSE error of 34mm. The authors stressed the              range of sizes and approximately 200 spheres of both 20 mm
importance of illumination and visual texture also. In particular,   and 10 mm diameter were purchased from Weener Plastics, UK
the benefits of an overcast sky creating naturally diffuse           Ltd for less than £100. The spheres also had an unexpected but
illumination of the sea surface. Examining the images acquired       very desirable quality when imaged using a standard SLR with
by Santel et al. (2004), it can be also seen that overcast           Flash. The translucent and spherical shape appears to generate a
conditions were prevalent.                                           small bright spot from the reflected flashlight (Figure 1). This is
                                                                     located at the centre of the sphere and at a fixed distance above
Of perhaps increased relevance, Han and Endreny (2014)               the actual water surface and critically is independent of viewing
describe recent work in which they were able to use automated        direction. This allows the image point measured on multiple
DEM extraction using a synchronised pair of digital images to        synchronised frames to represent a true point in 3-D space.
measure the water surface. This was achieved using fine wax
powder particles (0.3-0.8 mm diameter), which appears to
create an appropriate texture under normal lighting conditions.
The technique has been applied to a flume environment and
they report excellent accuracies of 0.3 mm using cameras
mounted just 1.3 m above the water surface. However,
distributing non-biodegradable wax particles does not appear
appropriate when working in the field environment.

              3. THE MEASURING SYSTEM

Examination of the literature and indeed past work conducted
by the first author suggested that a viable system based on
digital photogrammetry could be developed. A key issue
controlling the photogrammetry design is the type of targeting
or more correctly “seeding particles” to be used. The overall
adopted methodology is described in the subsequent section.

3.1 Targeting/seeding particles
                                                                          Figure 1 Sharp target complete with bright central spot
Two distinct targeting approaches appear to be viable, each
having their own strengths and weaknesses. If large and visually
distinct targets are adopted (e.g. Fraser and McGee, 1995;

                                               This contribution has been peer-reviewed.
                                               doi:10.5194/isprsarchives-XL-5-151-2014                                         152
The International Archives of the Photogrammetry, Remote Sensing and Spatial Information Sciences, Volume XL-5, 2014
                         ISPRS Technical Commission V Symposium, 23 – 25 June 2014, Riva del Garda, Italy

3.2 Imaging                                                           of the channel mounted temporarily on stakes hammered into
                                                                      the bank.
Two Nikon D80 digital cameras were available for basic image
acquisition, with a third Nikon D7000 potentially available.          For the flume work, two control bars each with 10 RAD targets
These are moderately priced digital SLR type cameras (10 and          were placed upon the flume sides and again coordinated using
15 MP) and were equipped with either a 24 or 28 mm fixed              the total station (Figure 4). The control survey then provides a
focus lens. Cameras can be mounted either vertically or               real world coordinate system, where the z-axis is oriented to
obliquely on standard camera tripods. These provide the               local gravity at a known scale.
flexibility to achieve a convergent configuration for either flume
or field application, with a desired base to distance ratio of
approximately 1:7. The flowing water clearly creates a dynamic
measurement problem, so obtaining synchronisation between
the two exposures is critical. This has been achieved by
constructing an electronically controlled triggering mechanism
that creates a coincident electronic pulse along two standard
Nikon MC-DC1 cables. Tests revealed that coincident
exposures can be achieved to up to 1/1000th of a second,
although all automated features (focus/exposure etc.) must be
disabled. In addition, all other camera settings must be identical
otherwise synchronisation accuracies drop to 1/300th of a
second.

Two exposure and imaging strategies have been adopted so far.
Primary data acquisition has involved using the inbuilt flash in
“standard mode”, which achieves a distinct sharp image of the
sphere frozen in space (Figure 1 and Figure 4). Typical
exposure settings for the darker and more demanding laboratory
application include: shutter priority, f-16, 1/60th second, ISO:
1000. The alternative has created a deliberate blur by using         Figure 3 Control survey and general layout for field application
“SLOW flash synchronisation”. Typical exposure settings
include: aperture priority, f-11, 1/10th second, ISO: 1600. This
creates a sharp image of the sphere at the initial instant of
exposure, but then a noticeable and measurable trail which is a
function of the exposure time and sphere velocity (Figure 2). It
was found necessary to vary the ISO setting to achieve a trail of
an appropriate length, which can then allow determination of
surface water speed and direction of flow at a point.

                                                                       Figure 4 Control layout for laboratory application with evenly
                                                                                         distributed “sharp” targets

                                                                      3.4 Seeding distribution/collection

                                                                      One of the challenges that had to be overcome was to distribute
                                                                      the floating marker points evenly across the water surface
                                                                      during photo acquisition. Initial attempts that involved simply
                                                                      throwing the spheres manually proved unsatisfactory.
                                                                      Distribution was uneven and once wet, spheres tended to stick
                                                                      together or conglomerate. The difficulty was eased by
Figure 2 Deliberateley blurred targets for velocity determination
                                                                      constructing four narrow wooden “strip containers” which could
                                                                      be preloaded with spheres just prior to the test. These straddled
                                                                      the flume and could be tipped to provide a consistently spaced
3.3 Control                                                           row of spheres. By repeating this sequentially using all
Although control is not essential for the photogrammetry,             preloaded strip containers, an even distribution down the
obtaining appropriate scaled and oriented data is critical for        channel could be achieved with practice (Figure 4).
relating measurements to gravity induced flows. Control could
be achieved using PhotoModeler “Ringed Automatically                  The plastic spheres are non-biodegradable and it is therefore
Detected” or RAD targets of appropriate size, each easily             unethical to allow them to escape into the natural environment.
coordinated using a standard reflectorless Total Station (Figure      Spheres could be easily collected in both the flume and field by
3). For the river application, targets were located on both sides     using two wooden and hinged spars which straddled the river.

                                               This contribution has been peer-reviewed.
                                               doi:10.5194/isprsarchives-XL-5-151-2014                                         153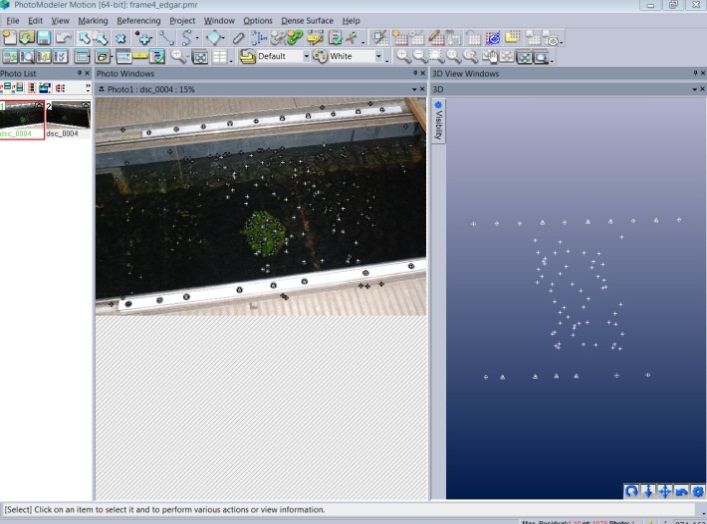
The International Archives of the Photogrammetry, Remote Sensing and Spatial Information Sciences, Volume XL-5, 2014
ISPRS Technical Commission V Symposium, 23 – 25 June 2014, Riva del Garda, Italy
The spars guided the spheres into two fishing nets and proved 9. Data was then “exported” and a fixed vertical offset was
both portable and effective (Figure 5). subtracted to account for the difference between the bright
measured spot and the actual water surface (4mm for the
20 mm diameter spheres).
Figure 5 Two hinged wooden spas used for collecting spheres
Figure 6. Automated measurement using PhotoModeler
3.5 Water surface data-processing
Although some manual interaction was required, it was found
The PhotoModeler scanner software was available and chosen that user assisted automatic processing methods could typically
for all photogrammetric data processing and attempts were generate 30 to 40 water surface points in approximately 10 to 20
made to automate as many of the required data processing minutes. However, it was found that lighting played a critical
stages as possible. The two cameras were calibrated using the control (Section 4.1). If automated methods were not viable or
PhotoModeler camera calibration option, simply by acquiring became too time consuming, then manual marking and
convergent imagery of a RAD-based control field at the referencing provided a workable alternative.
required fixed focusing distance. This is a fully automated
process and recovers all of the elements of inner orientation 3.6 Surface velocity data-processing
necessary to model the internal camera geometry.
The measurement necessary for detecting surface velocity was
The processing necessary for water surface determination, broadly similar, but required greater manual intervention. Initial
required the following key stages: stages necessary to detect and determine the three-dimensional
1. identifying appropriate synchronised pair, key criteria positions of the bright spots was identical. These represented the
including: accurate synchronisation, even distribution of positions of the spheres at the instant of the flash (Figure 2).
seed points across the flume/river and targets located The end of the trail then had to be estimated and measured
within areas of interest (i.e. in the vicinity of vegetative manually. The length of this 3-D vector divided by the exposure
elements); time (recorded in the jpeg EXIF header) then provides the
2. An “Automated Smart Points” project was used to load in velocity of the sphere. The assumption then has to be made that
the required image pair and establish an initial orientation. the sphere is moving at the same velocity of the water, which
3. Automatically measure “RAD” targets and process to appears appropriate.
confirm that these have been measured and detected
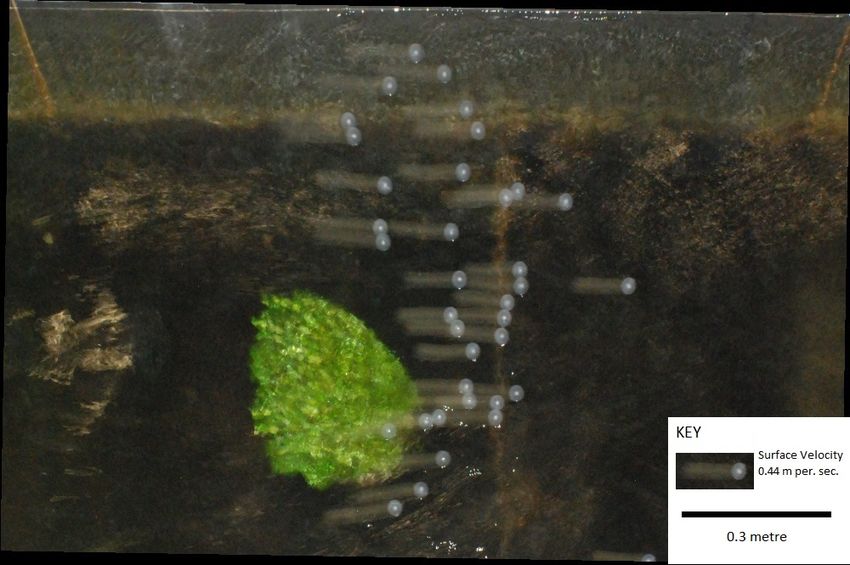
correctly. It was decided to convey the length and orientation of these
4. Introduce the desired datum using “External Geometry velocity vectors by simply generating an orthophoto in the XY
Explorer” by loading and an appropriate “Coded Target plane from the oblique imagery (Figure 7).
Definition File” containing the control coordinates.
5. Automatically marks positions of the seed points using
“Automatic Target Marking”. Critical parameters included: 4. DISCUSSION
diameter range in pixels and circularity or “Fit Error”.
(Typical parameters: White Dots, Fit Error: 0.4, Diameter: Although the previous section describes the targeting solution
5-20 pixels). and key processing stages adopted, there are a range of critical
6. Three water surface points were then manually controls which need to be discussed. In addition, an
“Referenced” across the pair to obtain three 3-D understanding of how the derived morphological and superficial
coordinates to define an approximate plane representing velocity data will be used in modelling of the flow, before
the water surface. For convenience, these points were planned future work is identified.
placed on a new layer named: “wsurf”.
7. The remaining surface points were then “Automatically 4.1 Critical controls
Referenced”, guided using the approximate plane defined
by the three “wsurf” points. One of the main reasons why measuring a water surface
8. The project was then “Processed” and consequent 3-D presents challenges is the naturally reflective properties of
model and residuals examined (Figure 6) to ensure no water. The water surface acts as a dynamic and multifaceted
gross errors had been introduced. mirror, which creates an infinite number of reflections which
vary continually, both spatially and temporally.
This contribution has been peer-reviewed.
doi:10.5194/isprsarchives-XL-5-151-2014 154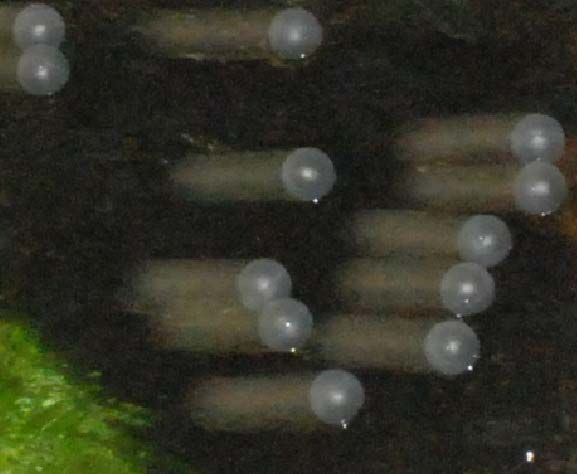
The International Archives of the Photogrammetry, Remote Sensing and Spatial Information Sciences, Volume XL-5, 2014
                        ISPRS Technical Commission V Symposium, 23 – 25 June 2014, Riva del Garda, Italy

                      Figure 7 Scaled orthophoto showing velocity vectors in the XY plane, flume application
It also has to be recognised that a different pattern of reflected using diverse living vegetation specimens with different
points is captured by each image in a synchronised pair. If        biomechanical properties and under both submerged and
manual measurement approaches are adopted then the human           emergent conditions. It is thus expected to enhance, through
brain can interpret and identify the required target floating      empirical evidence, the current knowledge regarding the
marker points. However, if automation is sought, then spurious     turbulent flow field in natural watercourses and riparian
bright spots created by the reflected light
and areas of reduced contrast due to
“flair”, need to be avoided. In the flume
environment this was achieved by setting
up a plastic canopy (e.g. a garden gazebo
proved effective!) was positioned and
placed over the top of the test area so that
it prevented the multiple ceiling lights
being reflected into the lens. This
approach was not practicable in the
outdoor field environment, where the scale
of application was much larger. Although
initial fieldwork tests proved successful,
two other approaches are recommended
and will be tested. Measurements could be                          corridors and at the same time to derive improved parameters in
restricted to days where the conditions are both Figure 8. Exaggerated water surface profile in downstream direction (left)- real river
overcast but bright. The alternative and more                      a variety of simulations tools and conceptual models.
versatile option will be to use plane polarising filters to
hopefully reduce unwanted reflections.                             Spatial measurement is challenging and the major details and
                                                                    problems faced during data acquisition and processing has been
4.2 Flow modelling                                                  given in previous sections. It is apparent that independently of
                                                                    the degree of automation achieved, such techniques are feasible
As stated in the introduction, the key aim of the funded research   to apply in both flume and field conditions. It is desirable to
project is to consider the role of vegetation on river flooding.    somehow strengthen the linkage between what is in its essence a
Specifically, to quantify the impact of riparian vegetation on      remote sensing technology and hydraulic real world
fluid flow in terms of turbulence, bed friction and water surface   applications by enhancing and/or combining methods. In fact,
variation. One objective is to further develop existing three-      there is a wide range of potential applications where the
dimensional numerical flow models to simulate flow, which           developed techniques can be applied, including: stage and
currently rarely take into account the frictional effects of        discharge measurements for river basin management plans,
vegetative elements. In this context, a comprehensive data set      CFD model validation or even more fundamental aquatic
comprising point velocities, boundary shear stresses and the free   studies, among others.
surface deformation and velocity is presently being acquired

                                              This contribution has been peer-reviewed.
                                              doi:10.5194/isprsarchives-XL-5-151-2014                                       155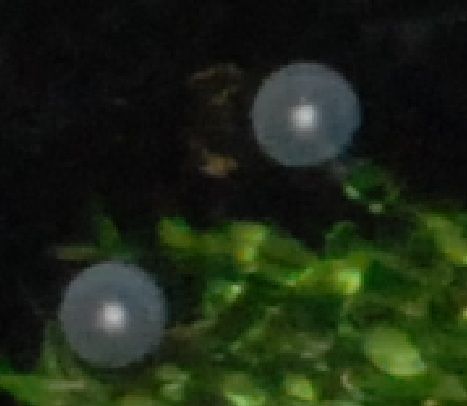
The International Archives of the Photogrammetry, Remote Sensing and Spatial Information Sciences, Volume XL-5, 2014
                         ISPRS Technical Commission V Symposium, 23 – 25 June 2014, Riva del Garda, Italy

Figures 7 and 8 show some initial outcomes. By surfacing the         both seeding and lighting, which consequently impact upon
three-dimensional morphological data using conventional              image quality, appears to play a critical control on the level of
Delaunay triangulation, it is possible to generate water surface     automation that can be achieved. Future proposed work will
profiles through any desirable plane. For river flows, the           attempt to further automate the measurement procedures.
principal direction of the plane needs obviously to be oriented      Options include examining the potential of Multi-View Stereo
towards the downstream direction. Figure 8 represents a              by acquiring synchronised image triplets, but this will require
downstream cross-sectional view which dissects a bush                identification and sourcing of an appropriate surface seeding
introduced into the flow in the river channel. (Note: Pixel value    material.
= elevation). It is apparent that surface elevation increases just
before the bush at a distance of 2.5 m. This is a direct                             6. ACKNOWLEDGEMENTS
consequence of flow blockage caused by the vegetation which
produces a local increase of the pressure field in the vicinity of   None of the work described could have been possible without
the bush. There is also a depression as the flow dissipates          the financial support provided by EPSRC Grant:
around and behind the vegetation at a distance of approximately      EP/K004891/1. Further details of the project can be found:
0.7 m, which is consistent with the expected flow field created      http://floods.lboro.ac.uk/
by such an obstacle.
                                                                                           7. REFERENCES
Figure 7 represents the speed and direction of flow at the water
surface, for one of the flume based image sets. The orthophoto       Chandler, J.H., Lane, S.N. and Richards, K.S., 1996. The
suggest that the magnitude of these flow velocities do not vary      determination of water surface morphology at river channel
spatially across and around the vegetation, at least for this        conferences using automated digital photogrammetry and their
particular test. This might indicate the presence of some            consequent use in numerical flow modelling, International
structures on the water surface. Furthermore, independent            Archives of Photogrammetry and Remote Sensing, Vienna,
velocity measurements derived using a 2D/3D side looking             Austria, Vol. XXXI Part B7, pp. 99-104.
Acoustic Doppler Velocimetry (ADV) system (Vectrino),
demonstrate that when compared to the approaching flow,              Chandler, J.H., Wackrow, R., Sun, X., Shiono, K.and
longitudinal velocities increase outside the wake zone, and are      Rameshwaran, P., 2008. Measuring a dynamic and flooding
compatible with the photogrammetric estimate.                        river surface by close range digital photogrammetry.
                                                                     International Archives of the Photogrammetry, Remote Sensing
4.3 Proposed future work                                             and Spatial Information Sciences, 37(B8): 211–216 (on CD-
                                                                     ROM). http://www.isprs.org/proceedings/XXXVII/
The measurement system described in this paper is evolving and       congress/tc8.aspx accessed, 18th November 2013.
further experimental work will hopefully refine procedures.
Currently, use is just being made of two synchronised cameras        de Vries, S., Hill, D.F., de Schipper, M.A. and Stive, M.J.F.,
but it has always been recognised that a third camera would          2011. Remote sensing of surf zone waves using stereo imaging.
provide valuable additional redundancy. A new triggering             Coastal Engineering, 58(3), pp.239–250.
mechanism has been constructed to allow a third camera, a            http://linkinghub.elsevier.com/retrieve/pii/S0378383910001444
Nikon D7000. It is hoped that this should improve accuracy and       accessed 22nd November 2013.
allow processes to be further automated. However, achieving
perfect synchronisation appears challenging, probably because        Fraser, C. and McGee, R.G., 1995. Dynamic measurement of
slightly differing electronic systems associated with the two        undulating water surfaces in a lock fill. Photogrammetric
camera types, create differential time delays.                       Engineering and Remote Sensing, 61(1): 83-87.

                                                                     Lane, S. N., Richards, K. S. and Chandler, J. H., 1993.
As discussed in Section 3.1, large and visually distinct seeds
                                                                     Developments in photogrammetry- the geomorphological
have been used in tests conducted to date. Utilising automated
                                                                     potential. Progress in Physical Geography, 17(3): 306-328.
DEM generation methods have not proved practicable because
of the lack of texture on the surface. Santel (2004) and de Vries    PhotoModeler Scanner, 2013. Eos Systems Inc.
et al., (2011) have reported success with automated DEM              http://www.photomodeler.com/, accessed 18th October 2013.
generation but it is probable that lighting conditions were
uniquely suited. Han and Endreny (2014) describe the use of          Piepmeir, J.A. and Waters, J., 2004. Analysis of stereo vision
fine wax powder to create surface texture, which could be of use     based measurements of laboratory water waves. Geoscience and
in the laboratory. This is an approach which could yield             Remote Sensing Symposium, IGARSS '04. Proceedings. IEEE
excellent results, particularly if Multi-View Stereo (MVS) DEM       International 5: 3588-91.
generation methods are utilised. This exact seeding material
appears difficult to obtain currently, and so the search remains     Santel, F., Linder, W., Heipke, C., 2004. Stereoscopic 3-D
for a cheap, lightweight and easily distributable seeding            image sequence analysis of sea surfaces. International Archives
material, which is also biodegradable. As this paper is published    of the Photogrammetry, Remote Sensing and Spatial
we are currently trying cork particles. Any other suggestions?       Information Sciences, 35(5): 643-649. http://www.isprs.org/
                                                                     proceedings/XXXV/congress/comm5/papers/643.pdf accessed,
                      5. CONCLUSION                                  6th December 2013.

This paper has demonstrated the practicalities of deriving the       Han, B. and Endreny, T.A., 2014. River surface water
three-dimensional surface topography and water surface               topography mapping at the sub Melanie to resolution and
velocity of a dynamic and flowing water surface. The technique       precision with close range photogrammetry: laboratory scale
is flexible and can be applied in both the flume and field           application. IEEE Journal of Selected Topics in Applied Earth
environment. Commercial software appears able to automate            Observations and Remote Sensing, 7(2): 602–608.
many aspects of the photogrammetry-based solution, although

                                               This contribution has been peer-reviewed.
                                               doi:10.5194/isprsarchives-XL-5-151-2014                                       156
You can also read