Waters: Appendix 1 - Data sources - across the North Sea and Atlantic areas of Scottish Regional baselines for marine mammal knowledge
←
→
Page content transcription
If your browser does not render page correctly, please read the page content below
Regional baselines for marine mammal knowledge
across the North Sea and Atlantic areas of Scottish
waters: Appendix 1 - Data sources
Scottish Marine and Freshwater Science Vol 11 No 12
Appendix 1: Data Sources

Contents
Appendix 1: Data Sources .................................................................................... 1
Anderwald and Evans (2010): Cetaceans of the east Grampian region ............... 3
APEM and Marine Scotland: Strategic aerial surveys .......................................... 3
Atlas of Cetacean Distribution: Reid et al. (2003)................................................. 3
Booth et al. (2013): Porpoise in the Hebrides ....................................................... 4
Cetaceans of the Atlantic Frontier: (Weir et al. 2001) ........................................... 6
Clyde Porpoise CIC .............................................................................................. 7
CODA: Cetacean Offshore Distribution and Abundance in European and Atlantic8
COMPASS: Collaborative Oceanography and Monitoring for Protected Areas and
Species .............................................................................................................. 10
CRRU: Cetacean Research and Rescue Unit .................................................... 12
ECOMMAS: East Coast Marine Mammal Acoustic Study .................................. 13
Embling (2007): Cetaceans in West Scotland .................................................... 14
Evans et al. (2011): Cetaceans in the Pentland Firth and Orkney waters .......... 15
FSC Millport ....................................................................................................... 16
HWDT: Hebridean Whale and Dolphin Trust ...................................................... 16
HiDef Ltd (2015): Strategic surveys in Scotland ................................................. 18
Heinänen and Skov (2015): Harbour Porpoise modelling to inform SAC designation
    19
IAMMWG (2015): Harbour porpoise density to inform SAC designation ............ 20
Irish Whale and Dolphin Group .......................................................................... 21
Joint Cetacean Protocol data analysis: Paxton et al. (2016) .............................. 22
   Joint Cetacean Data Programme (JCDP) ............................................................. 23
Lighthouse Field Station (University of Aberdeen): Bottlenose dolphin surveys . 24
Macleod et al. (2003): Cetacean surveys off north west Scotland ...................... 25
MacLeod et al. (2008): White-beaked and short-beaked common dolphins in UK
waters................................................................................................................. 27
MARINELife ....................................................................................................... 28
MarPAMM: Marine Protected Area Management & Monitoring .......................... 29

                                                              1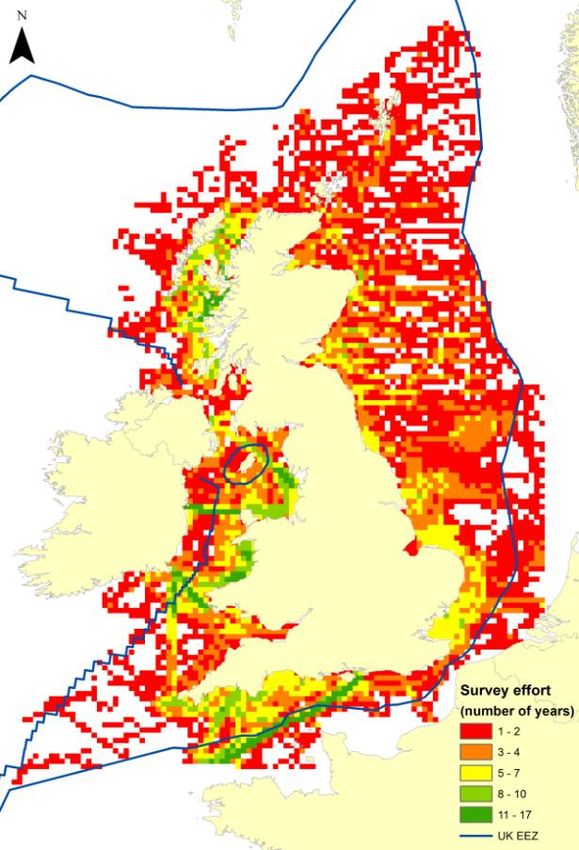
MERP Project: Cetacean species distribution maps: Waggitt et al. (2020) ........ 31
NAMMCO ........................................................................................................... 32
Northern North Sea Cetacean Ferry Surveys (NORCET) .................................. 34
Offshore Developments...................................................................................... 35
   Moray Firth Offshore Developments: baseline marine mammal surveys .............. 35
   Forth and Tay Offshore windfarms ....................................................................... 39
   EMEC Wildlife Observation Programme ............................................................... 44
ORCA ................................................................................................................. 46
Paxton et al. (2014): Distribution of minke whales, Risso’s dolphins and white-
beaked dolphins to inform MPA designation ...................................................... 47
Publicly Available Data repositories ................................................................... 49
Rogan et al. (2017): Deep diving cetaceans in the North-East Atlantic .............. 49
Russell et al. (2017): Seal at-sea usage maps ................................................... 50
SCANS: Small Cetacean Abundance in the North Sea ...................................... 51
Scotland’s Marine Atlas ...................................................................................... 52
Sea Watch Foundation ....................................................................................... 52
SMRU: Bottlenose dolphin surveys .................................................................... 53
SMRU: Seal telemetry data ................................................................................ 54
SMRU: Seal haul-out count data ........................................................................ 56
Social Media....................................................................................................... 57
St Abb’s Marine Station ...................................................................................... 58
Stone (2015): Marine Mammal Observations during seismic surveys ................ 58
Webb et al. (2018): Aerial surveys of the Sea of the Hebrides pMPA ................ 61
WDC: Shorewatch .............................................................................................. 60
References ......................................................................................................... 63

                                                              2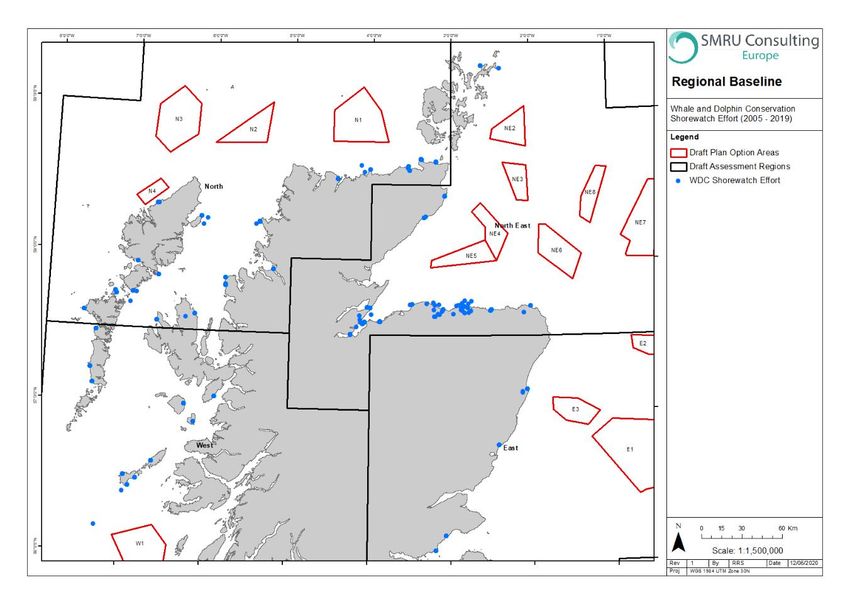
Anderwald and Evans (2010): Cetaceans of the east Grampian region
Species: Bottlenose dolphin, harbour porpoise, white-beaked dolphin, minke whale, Risso’s dolphin,
killer whale, Atlantic white-sided dolphin, short-beaked common dolphin, long-finned pilot whale,
humpback whale, fin whale, northern bottlenose whale, striped dolphin and sperm whale.
Relevant Draft Plan Option Region: North, North East
Relevant Draft Plan Option Area: E3
Area: East Grampian coastline
Year(s): 1973-2010
Month(s): All
Outputs: Sightings maps

Anderwald and Evans (2010) present systematic land- and vessel-based survey data along
with casual sightings records from the Sea Watch Foundation national database covering
the East Grampian coastline, with data presented from 1973 to 2010 (Figure 1). Data
presented in the report also includes sightings from the Northern North Sea Cetacean Ferry
Surveys (NORCET) surveys, and data from regular sea-based surveys mainly in the coastal
waters between Stonehaven and Aberdeen since 1998. Most effort was coastal and so has
no overlap with any Draft Plan Option sites, although boat-based effort to the east of
Aberdeen does overlap with Draft Plan Option site E3.

  Figure 1 Distribution of effort during land- and vessel-based surveys presented in the ’Cetaceans of the East
                Grampian Region’ report by Sea Watch Foundation (Anderwald and Evans 2010)

APEM and Marine Scotland: Strategic aerial surveys
Strategic aerial surveys along the east coast of Scotland are being commissioned to be
undertaken by APEM by Marine Scotland. These surveys are primarily for birds, but marine
mammal sightings will also be recorded. We cannot report on the exact start date of the
surveys, or the survey route, but it is likely some Draft Plan Option areas may be covered.

Atlas of Cetacean Distribution: Reid et al. (2003)
Species: Humpback whale, minke whale, sei whale, fin whale, short-beaked common dolphin, white-
beaked dolphin, Atlantic white-sided dolphin, Risso's dolphin, long-finned pilot whale, harbour
porpoise, sperm whale, northern bottlenose whale, beaked whale spp., Mesoplodon spp., bottlenose
                                                       3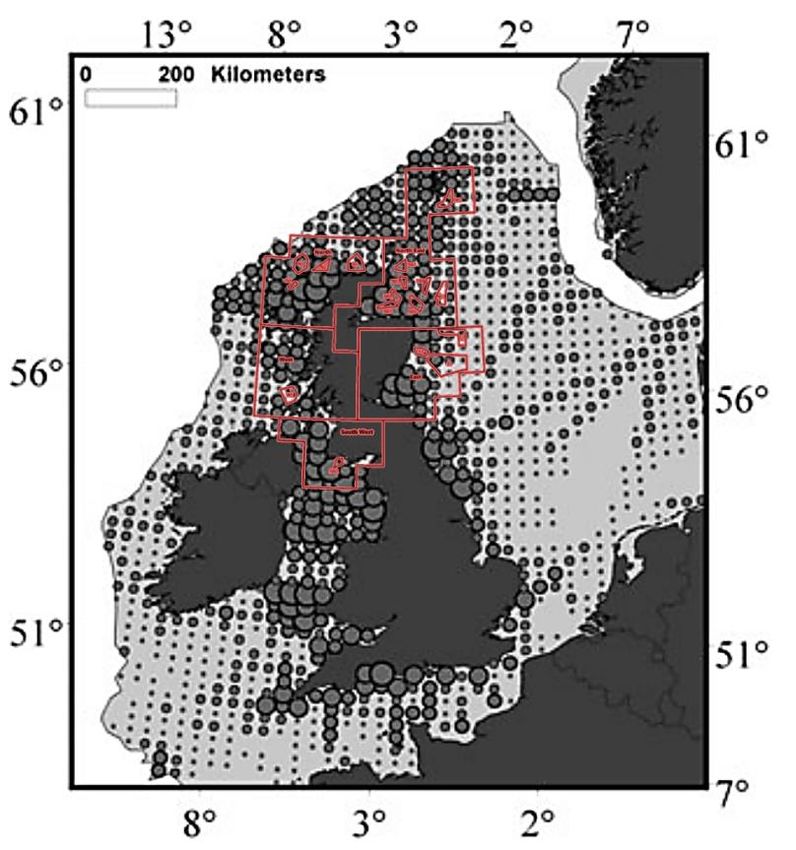
dolphin, striped dolphin, killer whale, northern right whale, blue whale, pygmy sperm whale, Cuvier's
beaked whale, Sowerby's beaked whale and false killer whale.
Relevant Draft Plan Option Region: All
Relevant Draft Plan Option Area:
Area: Whole UK
Year(s): 1979-1997
Month(s): All
Outputs: Map of sightings rates per standard hour surveyed

The Joint Nature Conservation Committee (JNCC) compiled and present the ‘Atlas of
Cetacean Distribution in north-west European waters’ using data collected by various
organisations between 1979 and 1997 (Reid et al. 2003). The data used within the Atlas
included cetacean sightings data from three main sources: European Seabirds at Sea
database (ESAS), Sea Watch Foundation and Small Cetaceans in European Atlantic waters
and the North Sea (SCANS). This data can also be found within the Joint Cetacean
Database, which is curated by JNCC. The ESAS surveys were designed for seabirds, but
marine mammals were recorded (usually at 10-minute intervals) with year-round cetacean
records. The Sea Watch Foundation data consisted of both land-based and offshore vessel
surveys and the SCANS survey in 1994 included a combination of aerial and vessel surveys.
Reid et al. (2003) used only sightings data that had associated effort data for their analysis
and the maps presented in the Atlas. The final database consisted of 61,000 hours of
observation, and 31,000 sightings of 138,000 individual cetaceans from the 28 cetacean
species known to occurred in waters off north-west Europe in the previous 25 years.
There are several assumptions or limitations to the datasets included in the analysis. For
example, variables such as the number of observers present and observer’s experience may
affect the probability of sighting a cetacean, though this was not corrected for as Reid et al.
(2003) assumed they did not bias sightings rate by area. The data ranged from 1979 to 1997
and are treated as a snapshot of distribution over this period, thus not allowing for any
consideration of inter-annual shifts in distribution. Likewise, no seasonal differences in
distribution are considered. The analysis assumed that none of the data biases were
systematic. Thus the patchiness of data needs to be considered when interpreting the maps,
and the authors state that it would be “inappropriate to infer too much about local densities of
animals at the individual cell level” and that the maps are intended more to show relative
densities at the regional level.
Effective effort was calculated for eight of the 28 species presented and was calculated for
each cell (an area/time combination) by multiplying search effort (minutes) in each sea state
category by the appropriate correction factor informed by general additive modelling, and
summing the total. For species where there were too few data to allow estimation of
correction factors, sightings rates were presented as numbers of animals observed per unit
search time, uncorrected.

Booth et al. (2013): Porpoise in the Hebrides
Species: Harbour porpoise
Relevant Draft Plan Option Region: North, West
Relevant Draft Plan Option Area: W1, N4
Area: Hebrides
Year(s): Visual: 2003-2010, Acoustic: 2004-2010
Month(s): April - Sept
Outputs: Predicted distribution and identification of habitat preference
                                                    4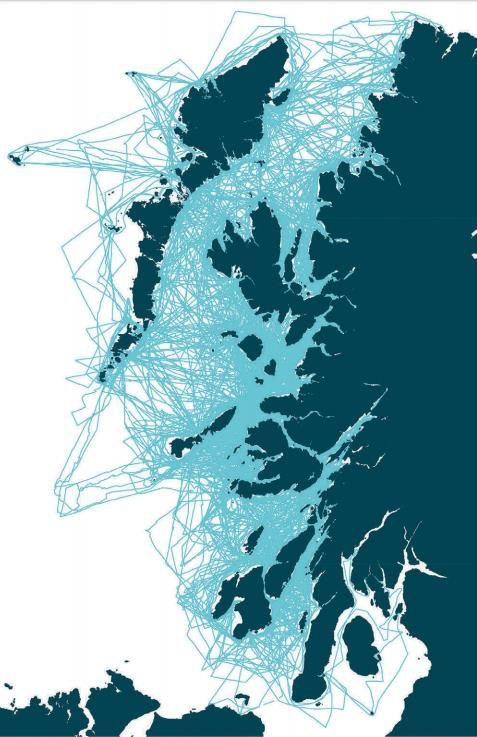
Booth et al. (2013) used data from the Hebridean Whale and Trust (HWDT) collected from
their survey vessel Silurian between April and September. The aim of the study was to
identify the habitat preferences of harbour porpoise in the Hebrides; using Generalised
Additive Models (GAMs) with Generalised Estimating Equations (GEEs) to identify the
relationship between porpoise density and oceanographic covariates. Systematic surveys
were conducted (visual from 2003-2010 and also towed acoustic from 2004-2010) following
a systematic zig-zag pattern to ensure even coverage of the study area (as far as possible).
A total of 58,059 km of visual survey effort (in Beaufort sea state ≤ 3), and 56,495 km of
acoustic survey effort (in all sea states) was used in the analysis. The survey data overlaps
with Draft Plan Option areas W1 and N4 to a lesser extent. As Booth et al. (2013) uses
HWDT data, care should be taken when using both these datasets to assess distribution to
ensure abundance or site use is not overestimated.

                       Figure 2 Survey area covered within Booth et al. (2013).

                                                  5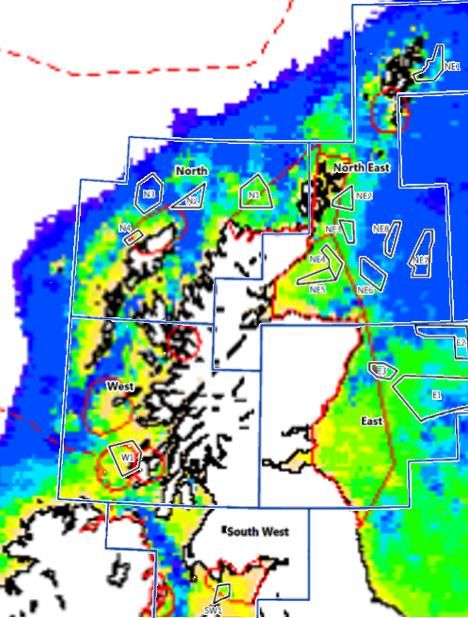
Cetaceans of the Atlantic Frontier: (Weir et al. 2001)
Species: Fin whale, sei whale, minke whale, humpback whale, sperm whale, northern bottlenose
whale, Sowerby's beaked whale, killer whale, long-finned pilot whale, Atlantic white-sided dolphin,
white-beaked dolphin, Risso's dolphin, bottlenose dolphin, short-beaked common dolphin and harbour
porpoise.
Relevant Draft Plan Option Region: North, North East, West, South West
Relevant Draft Plan Option Area: None
Area: West and north Scotland
Year(s): 1979-1998, effort varied yearly
Month(s): All months of the year (not for all years), effort varied monthly
Outputs: Abundance and distribution data

Weir et al. (2001) present the data from surveys carried out throughout the year from
chartered vessels, ferries and various vessels of opportunity e.g. research vessels, covering
waters >2,300 m in depth to the north and west of Scotland between 1979 and July 1998
(study area: latitudes 55°00′N and 63°00′N, and longitudes 02°00′E and 11°30′W). The data
are from surveys carried out by the Seabirds at Sea Team (SAST) of the JNCC, with data
added to the European Seabirds at Sea (ESAS) database, and data from both databases
are used in the analysis. The SAST surveys were carried out primarily for seabirds, with
sightings of marine mammals conducted as an additional task. The survey covered a total of
155,308 km, though coverage had strong seasonal variation, with almost double the level of
coverage during the summer months of May to October (100,177 km) than in winter (55,130
km). Most coverage was achieved in July (27,871 km), with least coverage in December
(6,380 km). Survey coverage also varied geographically in respect to season, for example
winter coverage of deep waters along the shelf edge was poor. The best year-round
coverage was for inshore waters along the continental shelf, particularly the Minches and the
Pentland Firth. Survey coverage also differed between years; surveys in earlier years mainly
focusing on the North Sea, with emphasis moving to the shelf waters of north and west
Scotland between 1986 and 1994 and deep waters being little covered during this time. The
majority of offshore surveys in the Atlantic Frontier were more recent, between 1995 and
1998. Surveys were more intense along the continental shelf edge to the north and west of
Shetland and the Western Isles from 1997 onwards, concentrating on waters where seabird
and cetacean distribution is poorly known, despite oil license blocks being granted in those
areas. Thus, the data was required to sufficiently inform oil contingency plans and
Environmental Impact Assessments.
Between 1979 and July 1998, a total of 11,248 individual cetaceans of 15 species were
recorded in the study area. An additional 907 animals were not identified to species level.
The surveys did not record distance and angle to sighting, though animals were noted as
being within or outside of the 300 m transect band. There was a concentration in observer
effort to one side of the vessel. Due to the opportunistic way data were collected, the SAST
methodology cannot be used to estimate absolute population densities of marine mammals
sighted during the surveys, and instead Weir et al. (2001) present data for the most
numerous species into a measure of abundance, using the number of individuals sighted per
km of trackline travelled. Weir et al. (2001) therefore present cetacean distribution in three
ways dependent on number of individual sightings per species: as sightings locations for
species with 1,500
individuals sighted. For the latter abundance maps, survey effort was grouped by quarterly
ICES (International Council for the Exploration of the Sea) rectangles (15′ latitude by 30′
longitude). Weir et al. (2001) highlight that the methodology does not allow for accurate

                                                6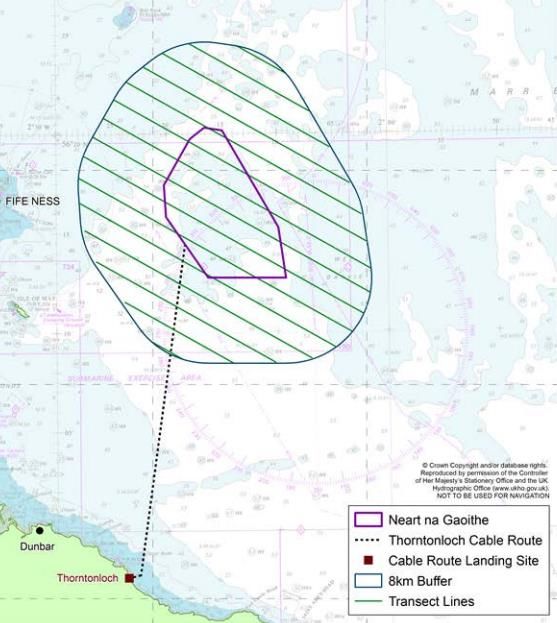
between species comparison of produced maps, due to variability in species detectability,
though the maps do provide an indicative measure of individuals per km to inform
distribution through the study area.
The uneven levels of survey coverage both spatially and temporally may result in
inconsistencies in the distributions presented by Weir et al. (2001), especially affecting the
number of sightings and consequent distribution estimates for some of the rarer, more
seasonal species. Weather conditions inherently restrict survey opportunities, and also affect
detectability of certain species. For example, high swell heights and higher sea states can
reduce sightings rates for all species, but especially for the more inconspicuous species
such as harbour porpoise.
Note that this data is also presented in a report published by JNCC in the previous year:
‘The distribution of seabirds and marine mammals in the Atlantic Frontier, north and west of
Scotland’ (Pollock et al. 2000). The Pollock et al. (2000) report includes additional data from
1999, which makes up an extra 1,234 cetacean sightings. Therefore, both sightings maps
are presented alongside one another in the report.
ESAS shipboard (1994-2010) and aeroplane survey data (1994 only, no marine mammal
sightings) are included in the Joint Cetacean Protocol Database (Paxton et al. 2016). ESAS
shipboard data (1980 to 2011) were also one of the data sources incorporated into the
modelling to produce species distribution maps presented by Waggitt et al. (2020).

    Figure 3 Survey effort between (a) 1979 and 1985; (b) 1986 and 1994; (c) 1995 and 1998 (Weir et al. 2001).

Clyde Porpoise CIC
Species: Harbour porpoise
Relevant Draft Plan Option Region: West, South West
Relevant Draft Plan Option Area: None (closest W1 and SW)
Area: Firth of Clyde
Year(s): Unknown
Month(s): Unknown
Outputs: Unknown

The Clyde Porpoise CIC1 is a community interest project focused on the research and
conservation of marine species in the Clyde area. Visual and acoustic surveys are
conducted from a research yacht using volunteers who are trained while onboard. Data are

1   https://www.clydeporpoise.org/
                                                        7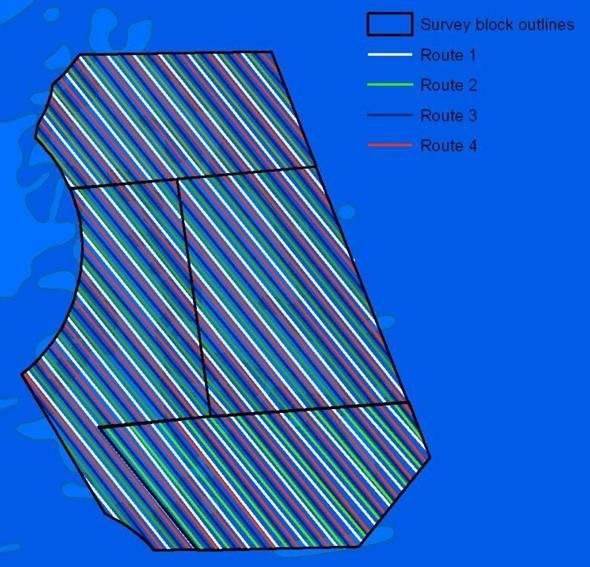
collected on marine mammal distribution and abundance and photo-ID is conducted on
harbour porpoise. In addition, sightings data are collected and reported by the public. Both
visual and acoustic data on porpoise, collected by the Clyde Porpoise CIC during 25 surveys
between October 2016 and November 2017, was used in a MSc thesis to assess the fine
scale distribution of porpoise in the Firth of Clyde (Brown 2018).

Figure 4 Vessel tracks and harbour porpoise detections from 25 surveys in the Firth of Clyde 2016-2017 (Brown
                                                    2018)

CODA: Cetacean Offshore Distribution and Abundance in European and
Atlantic
Species: Common dolphin, striped dolphins, bottlenose dolphin, long-finned pilot whale, sperm whale,
minke whale, fin whale and beaked whale spp.
Relevant Draft Plan Option Region: North
Relevant Draft Plan Option Area: None
Area: Offshore, beyond the west coast continental shelf

                                                     8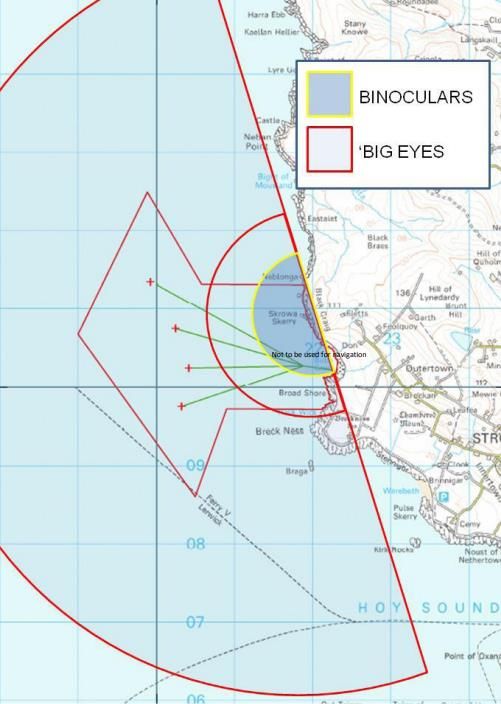
Year(s): 2007
Month(s): July
Outputs: Distribution and abundance estimates for offshore species

The Cetacean Offshore Distribution and Abundance in the European Atlantic (CODA)
project2 (Hammond et al. 2009) aimed to estimate the abundance and habitat of cetaceans
beyond the continental shelf, and was supported by institutes and governments in France,
Ireland, Spain and the UK. The project aimed to inform conservation status of all cetacean
species, and to assess the impact of bycatch of common dolphins and then to develop a
management framework for determining safe bycatch limits for common dolphins within the
surveyed area. The surveys consisted of visual vessel surveys along 9,651 km of transects
covering a 968,000 km2 survey area in July 2007 (Figure 5). Design-based and/or model-
based estimation methods were used to estimate abundance of common dolphins, striped
dolphins, bottlenose dolphins, long-finned pilot whales, sperm whales, minke whales, fin
whales and beaked whales (Cañadas et al. 2009a, Hammond et al. 2009, Macleod et al.
2009). Density surface maps are also available for those aforementioned species, however
the offshore nature of the surveys means there is no density estimates available from the
CODA surveys that cover the Draft Plan Option areas. Because the CODA surveys do not
overlap the Draft Plan Options regions, data from these surveys have not been presented in
the species accounts.
Data from the CODA surveys are included in the Joint Cetacean Protocol Database (Paxton
et al. 2016), and were incorporated in the analysis when producing the species distribution
maps presented by Waggitt et al. (2020).

             Figure 5 Survey blocks, designed cruise tracks and realised effort for the CODA surveys.

2   http://biology.st-andrews.ac.uk/coda/
                                                        9
COMPASS: Collaborative Oceanography and Monitoring for Protected
Areas and Species
Species: Harbour porpoise, dolphin species
Relevant Draft Plan Option Region: North, West, South West
Relevant Draft Plan Option Area: No direct overlap, but close to N2, N3, N4, W1 and SW1.
Area: West Scotland
Year(s): 2017 - present
Month(s): All
Outputs: Tables of detection-positive hours (DPH) separated as either dolphin species or porpoise.
The COMPASS project3, funded through the EU INTERREG VA programme, consists of a
network of 12 static passive acoustic monitoring buoys across the waters of Republic of
Ireland, Northern Ireland and West Scotland. The aim of the project is to develop marine
observational and data management capacity in order to effectively monitor and manage
cross-border MPAs. The monitoring buoys are fitted with the latest oceanographic sensors,
acoustic recorders and advanced fish tracking technology. For cetaceans, the aim is to use
the buoys to detect and monitor changes in cetacean occurrence, develop methodologies to
identify cetacean species from acoustic detections, and to monitor and report on ambient
noise levels. The COMPASS consortium consists of five partners working in the marine
research; the Agri-Food and Biosciences Institute, in conjunction with the Marine Institute,
Inland Fisheries Ireland, Scottish Association for Marine Science and Marine Science
Scotland.
Preliminary analysis of the first two years of monitoring show a large degree of variability in
rates of detection between sites, with generally higher rates of detection in winter, and
stronger seasonal patterns tending to be at deeper water sites (Edwards et al. 2019). Whilst
analysis so far has only covered dolphin species and porpoise, there is potential for data
analysis to detect other odontocete species, mysticetes and pinnipeds. Preliminary analyses
of March and April 2018 found detections of humpback whales at three sites: Tolsta, Stoer
Head and Stanton Banks (Risch et al. 2019).
3 https://compass-oceanscience.eu/
10Figure 6. COMPASS passive acoustic monitoring sites (red dots) on the west coast of Scotland. Overlaid for
reference are the Draft Plan Option areas.
11Figure 7 Location of C-PODs deployed since 2017 as part of the COMPASS project. Crosshatched areas
represent Special Area of Conservation for harbour porpoise: a) Inner Hebrides and Minches SAC b) Skerries
and Causeway SAC c) North Channel SAC (Edwards et al. 2019). Overlaid for reference are the approximate
Draft Plan Options areas and regions.
CRRU: Cetacean Research and Rescue Unit
Species: Bottlenose dolphin, harbour porpoise and minke whale
Relevant Draft Plan Option Region: North East
Relevant Draft Plan Option Area: None (closest to NE5)
Area: Southern Moray Firth
Year(s): 1997-current
Month(s): Summer
Outputs: Sightings data
12The CRRU4 is a marine conservation charity aiming to understand and conserve coastal
cetacean species in the inshore waters of the outer Moray Firth. The CRRU primarily
surveys bottlenose dolphins, however they also collate data on minke whales and harbour
porpoise and have used a varied of methods including photo-ID, behavioural studies, focal
follows and applied remote sensing. The primary CRRU study area extends between
Lossiemouth and Fraserburgh and covers an area of 880 km2 (Figure 8). Surveys are
conducted by volunteers who are trained onsite.
Four years of data from CRRU, spanning from 2009 to 2015 are included in the Waggitt et
al. (2020) analysis.
Figure 8 Location of the primary CRRU study area within the southern Moray Firth (Robinson et al. 2009).
ECOMMAS: East Coast Marine Mammal Acoustic Study
Species: Harbour porpoise, dolphin species
Relevant Draft Plan Option Region: North East and East
Relevant Draft Plan Option Area: None (closest is NE4, NE5, NE6, E3)
Area: Coastal east Scotland
Year(s): 2013-present
Month(s): All (summer only in 2013)
Outputs: Tables of detection-positive days (DPD) and detection-positive hours (DPH)
The ECOMMAS project5 began in 2013 and has deployed 30 acoustic recorders (C-PODs)
and 10 broadband acoustic recorders along the east coast of Scotland. There are two
deployments undertaken per year, with data covering April to November. The aim is to
4 http://www.crru.org.uk/
5 http://marine.gov.scot/information/east-coast-marine-mammal-acoustic-study-ecommas
13collect data on the relative abundance of dolphins and porpoise. Every mooring carries one
C-POD, with some moorings also including an SM2M device. Since the surveys use passive
acoustic methods, they are only able to detect vocalizing marine mammal species. The C-
POD data are presented as detection-positive days (DPD) and detection-positive hours
(DPH). The proportion of DPD and median DPH are then calculated for both species. The
data are also available as raw data, if specifically requested.
Figure 9. ECOMMAS acoustic monitoring sites along the east coast of Scotland. Overlaid for reference are the
Draft Plan Option areas.
Embling (2007): Cetaceans in West Scotland
Species: Sperm whale, harbour porpoise, delphinids (not classified to species level)
Relevant Draft Plan Option Region: North, West, North East
Relevant Draft Plan Option Area: N1, N2, N3, N4, W1
Area: North and West Scotland
Year(s): 2003-2005
Month(s): May, Jul, Sep, Oct
Outputs: Sighting distribution maps
Passive acoustic monitoring was used to detect harbour porpoise, delphinids and sperm
whales in the offshore waters west of Scotland, between July 2003 and October 2005.
Hydrophones towed behind platform of opportunity vessels were used to collect data on
cetacean distributions, and detection data are presented on sperm whales, harbour porpoise
14and delphinids, although dolphins are not identified to species-level. This resulted in 11,475
km of survey effort, and 1,247 nine km segments (Figure 10) with 624 hours of listening
effort. Generalised additive models were then used to relate species’ distribution to a range
of environmental variables.
Figure 10 Survey area off the west coast of Scotland with 9 km surveyed segments overlaid (each black dot is a
9km segment) for surveys carried out opportunistically between July 2003 and October 2005. This does not
include the inshore survey effort also carried out as part of this study (Embling 2007)
Evans et al. (2011): Cetaceans in the Pentland Firth and Orkney waters
Species: All cetaceans
Relevant Draft Plan Option Region: North, North East
Relevant Draft Plan Option Area: N1, NE2 and NE3.
Area: Pentland Firth and Orkney Isles
Year(s): 1980-2010
Month(s): All
Outputs: Sightings maps
Evans et al (2011) collated data from 12 sources, including Sea Watch Foundation, ESAS,
SCANS I and SCANS II, and the John O’Groats ferry6, to assess the abundance and
behaviour of cetaceans in the Pentland Firth and Orkney waters. This combined dataset
contained data obtained from opportunistic, casual and systematic surveys with data
spanning thirty years from 1980 to 2010. No effort data were presented in this report
alongside the sightings data which prevented the calculation of density estimates for any of
the cetacean species. Whilst the sightings cannot be used to inform relative abundance, they
can be utilised to highlight presence of species in these areas. Sightings and species
presence are especially relevant to Draft Plan Options sites N1 and NE2.
6 See Evans et al. (2011) for the list of data sources used.
15FSC Millport
Relevant Draft Plan Option Region: West, South West
Relevant Draft Plan Option Area: None (closest W1 and SW)
Area: south west Scotland, Firth of Clyde
FSC Millport7 is an educational field centre on the Isle of Cumbrae in the Firth of Clyde, and
has been run by the Field Studies Council since 2014. Prior to this the centre was a higher
education institute run by the University of London in partnership with Glasgow University
between 1970 and 2013. Throughout both ownership periods, the field centre has delivered
educational courses on marine mammal identification, including boat-based survey and
transect techniques. The data recorded from such courses have historically been submitted
to various places. Between 1999 and 2018, data recorded during marine mammal courses
(including surveys in the Clyde and the Minches) was submitted to either HWDT or Sea
Watch Foundation. Since 2016, marine mammal sightings recorded during surveys are
usually uploaded to iRecord (which ultimately then feeds into the National Biodiversity
Network) and/or Sea Watch Foundation.
HWDT: Hebridean Whale and Dolphin Trust
Species: Bottlenose dolphin, Common dolphin, Harbour porpoise, Humpback whale, Killer whale,
Minke whale, Risso’s dolphin and White-beaked dolphin
Relevant Draft Plan Option Region: North, West, South West
Relevant Draft Plan Option Area: N4 and W1
Area: Hebrides
Year(s): 2003-2017 (data collected since but not provided)
Month(s): Apr to Oct
Outputs: Sightings per unit effort
The Hebridean Whale and Dolphin Trust (HWDT)8 maintains a dataset of marine mammal
and other marine megafauna sighting locations, acoustic recordings, photographs, and
associated effort for the west coast of Scotland from 2003 – present. HWDT carry out
dedicated visual and acoustic surveys aboard their research vessel, Silurian, covering a
wide geographical area off the west coast of Scotland (Figure 11). Surveys operate between
April and October, though since January 2019 a winter monitoring programme has also been
introduced. Since 2002, Silurian has used a towed hydrophone system to collect acoustic
data in order to detect cetaceans, and >6,000 hours of recordings have been collected. Data
are currently being prepared for analysis.
HWDT also collate sightings data from other sources, e.g. Tobermory based whale-watching
operator Sea Life Surveys and the Irish Whale and Dolphin Group. To encourage sightings
submissions from the general public, in July 2017 HWDT launched Whale Track, a sightings
platform consisting of a web-portal9 and a smartphone app, which allows anyone on the west
coast of Scotland to collect effort-based sightings data. Data are currently being prepared for
analysis.
7 https://www.field-studies-council.org/locations/millport/
8 hwdt.org
9 whaletrack.hwdt.org
16The Hebridean Marine Mammal Atlas10 (Hebridean Whale and Dolphin Trust 2018) presents
the results of 15 years of survey data between 2003 to 2017, resulting in nearly 200 surveys,
144,000 hours on board Silurian and 105,368 km travelled conducting surveys. The surveys
are conducted along straight, random transect lines using standard line transect
methodology. Surveys go “off effort” for photo-ID purposes. Between 2003 and 2017 the
surveys recorded 30,389 individual marine animals during 13,131 sightings, of which 11,493
sightings and 28,170 animals were identified to species level. A total of 10 cetacean and two
pinniped species have been sighted.
Figure 11 HWDT 15 years of visual and/or acoustic surveys on the Silurian (Hebridean Whale and Dolphin Trust
2018)
10 https://hwdt.org/hebridean-marine-mammal-atlas
17Figure 12 HWDT visual survey effort 2003-201911. Overlaid for reference are the Draft Plan Option areas.
Data collected by HWDT on eight surveys between 2003 around the Hebrides and north-
east Scotland are included in the Joint Cetacean Protocol Database (Paxton et al. 2016).
HWDT data collected between 2002 to 2015 were also one of the data sources incorporated
into the modelling to produce species distribution maps presented by Waggitt et al. (2020).
HiDef Ltd (2015): Strategic surveys in Scotland
Species: Harbour porpoise, minke whale, harbour seal, grey seal, white-beaked dolphin, bottlenose
dolphin
Relevant Draft Plan Option Region: North East, East
Relevant Draft Plan Option Area: NE5, E3
Area: Coastal east Scotland, Orkney
Year(s): 2014
Month(s): Aug-Nov
Outputs: Sightings data
11Hebridean Whale and Dolphin Trust 2020. Marine wildlife sightings and associated effort for the
west coast of Scotland. Silurian Dataset 2003 – 2019. Supplied 30th April 2020. Made available under
agreement on terms and conditions of use, and accessible via Hebridean Whale and Dolphin Trust
(HWDT), Tobermory, United Kingdom.
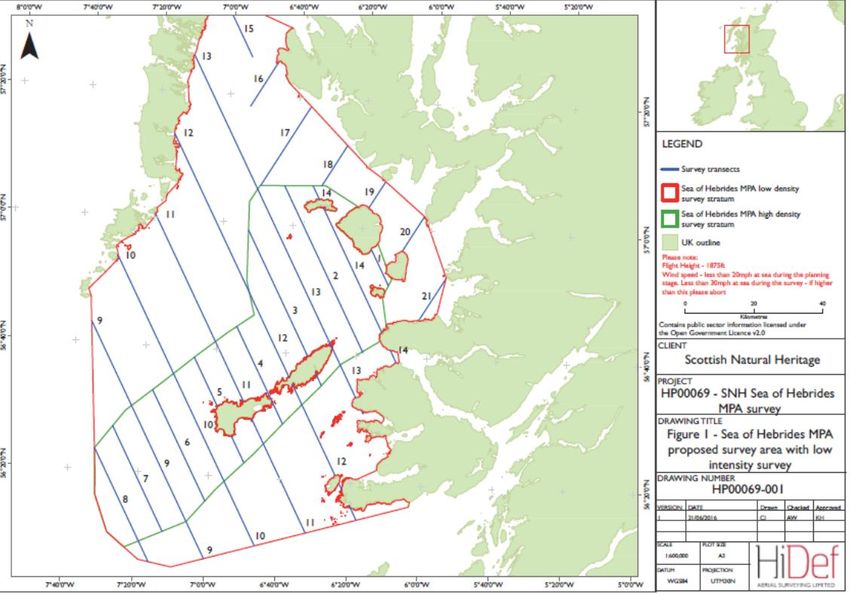
18In 2014, HiDef Aerial Surveying Ltd12 were contracted by Marine Scotland to conduct 11
surveys between August and November covering the east coast of Scotland, the southern
Moray Firth and parts of Orkney, totaling 7,022.7 km of trackline (Figure 13). The purpose of
the surveys was to provide information on the distribution of marine mammals and seabirds
to assist the deployment of offshore marine renewable energy and the development of a
network of MPAs in Scottish waters. The surveys were primarily coastal and so there was
little overlap with Draft Plan Option areas, however, the data are useful to inform
characterisation of potential offshore cable routes and landfall areas.
Figure 13 Survey tracklines conducted during the HiDef aerial surveys in 2014. Overlaid for reference are the
Draft Plan Option areas.
Heinänen and Skov (2015): Harbour Porpoise modelling to inform SAC
designation
Species: Harbour porpoise
Relevant Draft Plan Option Region: All
Relevant Draft Plan Option Area: All
Area: Whole UK
Year(s): 1994-2011
Month(s): Summer (Apr-Sep) and Winter (Oct-Mar)
Outputs: Density surface maps
12 https://hidef.bioconsult-sh.de/
19Heinänen and Skov (2015) conducted a detailed analysis of 18 years of survey data on
harbour porpoise around the UK between 1994 and 2011 held in the Joint Cetacean
Protocol (JCP) database. The goal of this analysis was to try to identify “discrete and
persistent areas of high density” that might be considered important for harbour porpoise
with the ultimate goal of determining SACs for the species. The analysis grouped data into
three subsets: 1994-1999, 2000-2005 and 2006-2011 to account for patchy survey effort and
analysed summer (April-September) and winter (October- March) data separately to explore
whether distribution patterns were different between seasons and to examine the degree of
persistence between the subsets.
The authors note that “due to the uneven survey effort over the modelled period, the
uncertainty in modelled distributions vary to a large extent”. In addition, the authors stated
that “model uncertainties are particularly high during winter”. The uncertainty of the modelled
density estimates (visualised by the patterns of relative standard errors) indicates that robust
model predictions in all shelf waters of the North Sea and in most parts along the north-west
Scottish coast. However, model uncertainties are particularly high during winter as well as
offshore off northwest Scotland.
Inter-Agency Marine Mammal Working Group (IAMMWG 2015): Harbour
porpoise density to inform SAC designation
Species: Harbour porpoise
Relevant Draft Plan Option Region: All
Relevant Draft Plan Option Area: All
Area: Whole UK
Year(s): 1965-2014
Month(s): Summer and winter
Outputs: Modelled occurrence of harbour porpoise
The UK statutory nature conservation bodies (SNCBs) (including Joint Nature Conservation
Committee (JNCC), Natural England (NE), National Resources Wales (NRW), Department
of Environment Northern Ireland (DoE NI) and Scottish National Heritage (SNH)) used sea-
based data from Heinänen and Skov (2015) and land-based data from a consortium led by
the Sea Watch Foundation (Evans et al. 2015) to model the occurrence of harbour porpoise
around the UK between 1994 and 2014 in order to identify possible SACs for harbour
porpoise (IAMMWG 2015). The dataset used by Heinänen and Skov (2015) is detailed in
Section 0. The dataset used by Evans et al. (2015) included >70,000 hours of watches from
678 sites round the UK since 1965. Figure 14 shows the number of years coverage around
the UK in 5x5 km grid cells. Areas of search were identified from the survey data (taking into
account the confidence in the underlying model predictions and the number of years of data
available) and further refined to define boundaries that represent the distributional range of
harbour porpoises in UK waters, taking into consideration the land-based data where
boundaries were near the coast.
20Figure 14 Number of years with survey coverage in each 5km x 5km grid cell within UK EEZ. Red pixels indicate
those areas that have only one or two years in which surveys occurred, whilst orange, yellow and green pixels
indicate areas when surveys occurred in three or more years. Obtained from IAMMWG (2015)
Irish Whale and Dolphin Group
Species: Unknown
Relevant Draft Plan Option Region: South West
Relevant Draft Plan Option Area: SW1
Area: Unknown
Year(s): 2006 - present
Month(s): Unknown
Outputs: Unknown
21The Irish Whale and Dolphin Group13 (IWDG) are an Irish-based sightings and stranding
scheme. Part of this work includes a ferry survey programme which conducts line transect
surveys for cetaceans on various routes, with one route which enters Scottish waters and
has been ongoing since 2006 (2006-2012: Larne-Cairnryan, 2013-present: Belfast-
Cairnryan). However, IWDG have little data covering Scottish waters, and sightings of
interest are passed on to HWDT (Simon Berrow, pers comms, 5th May 2020), and therefore
no IWDG data were shared with SMRU Consulting to include in this report. IWDG sightings
may be represented in work that includes HWDT datasets.
Data collected by IWDG on ‘big boat’ vessels between 2003 and 2009, and on ferries
between 2001 and 2010, are included in the Joint Cetacean Protocol Database (Paxton et
al. 2016). IWDG data collected between 2001 and 2016 were also one of the data sources
incorporated into the modelling to produce species distribution maps presented by Waggitt et
al. (2020).
Joint Cetacean Protocol data analysis: Paxton et al. (2016)
Species: Harbour porpoise, minke whale, bottlenose dolphin, short-beaked common dolphin, Risso’s
dolphin, white-beaked dolphin and Atlantic white-sided dolphin
Relevant Draft Plan Option Region: All
Relevant Draft Plan Option Area: All
Area: Whole UK
Year(s): 1994-2010
Month(s): Summer
Outputs: Estimate spatial and temporal patterns of abundance
The JCP Phase III analysis included datasets from 38 sources14, totalling over 1.05 million
km of survey effort between 1994 and 2010 from a variety of platforms. The JCP Phase III
analysis was conducted to combine these data sources to estimate spatial and temporal
patterns of abundance for seven species of cetaceans (Paxton et al. 2016).
In 2017, JNCC released R code15 that can be used to extract the cetacean abundance
estimates for summer 2007-2010 (average) for a user-specified area. This code was
originally created by Charles Paxton at the Centre for Research into Ecological and
Environmental Modelling (CREEM) and was modified by JNCC to include abundance
estimates that are scaled to the SCANS III results.
There are several limitations of this dataset. The data are between 10 and 26 years old and
as such, and so do not provide a recent density estimate against which to assess impacts for
any future EIAs. The authors state that the JCP database provides relatively poor spatial and
temporal coverage, that the results should be considered indicative rather than an accurate
representation of species distribution, and that due to the patchy distribution of data, the
13 https://iwdg.ie/
14 Cardigan Bay Marine Wildlife Centre, CODA 2007, University of Aberdeen, Cornwall Wildlife Trust,
DECC, DONG Energy, East Anglia Offshore Wind Ltd, ScottishPower Renewables, EDP
Renewables, Repsol Nuevas Energias UK, Eneco, E.on Energy Solutions Limited, European
Seabirds at Sea, Forewind Ltd, HiDef Aerial Surveying Ltd, Hebridean Whale and Dolphin Trust, DHI,
Marine Observers, Irish Whale and Dolphin Group, Mainstream Renewable Power
Marine Awareness North Wales Wildlife Trust, Marine Conservation Research Ltd, University of
Aberdeen Lighthouse Field Station (projects funded by DECC, and Talisman Energy (UK) Ltd), Whale
and Dolphin Conservation Society and WWT Consulting.
15 https://hub.jncc.gov.uk/assets/01adfabd-e75f-48ba-9643-2d594983201e
22estimates are less reliable than those obtained from SCANS surveys. In addition, the
authors categorically state that the JCP Phase III outputs cannot be used to provide baseline
data for impact monitoring of short term change or to infer abundance at a finer scale than
1,000 km2 because of issues relating to standardizing the data (such as corrections for
undetected animals and potential biases) from so many different platforms/ methodologies
and the strong assumptions that had to be made when calculating detection probability. In
addition, the density estimate obtained from the Data Analysis Tool is an averaged density
estimate for the summer 2007-2010 and is therefore not representative of densities at other
times of the year.
Joint Cetacean Data Programme (JCDP)
The JCDP16 is a project currently managed by JNCC, which plans to collate all UK-wide
existing cetacean monitoring data that has been collected at all spatial and temporal scales,
in order for this collation of data to be used for a range of analyses which can then inform
conservation and policy needs. The JCDP has just completed Phase 1, although the
outcomes of this are currently unpublished. In Phase 1, work has been undertaken to
develop draft data sharing agreements suitable for such a wide range of datasets, and the
scope of the work has been developed and submitted to funders. At the time of writing, we
are not aware when the JCDP project will recommence, but this will likely be an extremely
useful resource when available.
16 https://jncc.gov.uk/our-work/joint-cetacean-data-programme/
23Figure 15 The Scottish section of the JCP Phase III region showing (red lines) areas of interest for offshore
development where estimates of abundance are of special commercial interest. Colour denotes depth. Overlaid
are the approximate locations of the DPO areas and regions for reference.
Lighthouse Field Station (University of Aberdeen): Bottlenose dolphin
surveys
Species: Bottlenose dolphin. Sightings of other cetacean species are noted, including harbour
porpoise, minke whale, sperm whale, common dolphin and humpback whale.
Relevant Draft Plan Option Region: North East
Relevant Draft Plan Option Area: None (closest to NE5)
Area: Moray Firth SAC
Year(s): 2002-2016
Month(s): May to September
Outputs: Sightings and associated effort, photographs for individual identification
24Photo identification (photo-ID) surveys in the Moray Firth SAC have been conducted since
2002 in order to monitor the condition of bottlenose dolphins within the SAC (Cheney et al.
2012, Cheney et al. 2014, Cheney et al. 2018). Surveys are conducted in the summer
months between May and September, in Beaufort sea state 3 or less. Survey routes are
chosen randomly in order to maximise the probability of sightings while also obtaining
reasonable coverage of the core study area. The surveys are concentrated in the Inner
Moray Firth between Cromarty, Inverness and Balintore, with more occasional surveys to the
north and along the southern coast of the Moray Firth to Cullen (Figure 16). Effort and
sightings data have been provided for 2002 to 2016; surveys were conducted in 2017, 2018
and 2019 but have not yet been reported on and so are not included here.
The surveys were primarily coastal and so there is no overlap with Draft Plan Option areas,
however, the data are useful to inform characterisation of potential offshore cable routes and
landfall areas.
Figure 16 Bottlenose dolphin photoID trip lines surveyed by AULFS between 2002 and 2016. Data provided by
Barbara Cheney. Overlaid for reference are the Draft Plan Option areas.
Macleod et al. (2003): Cetacean surveys off north west Scotland
Species: Atlantic white-sided dolphin, fin whale, sei whale, long-finned pilot whale, sperm whale,
common dolphin, harbour porpoise, white-beaked dolphin and Risso’s dolphin
Relevant Draft Plan Option Region: North
Relevant Draft Plan Option Area: N3, N4
Area: Outer Hebrides; west of the Shetland Islands and the Faroe-Shetland Channel
Year(s): 1998
Month(s): July-Aug
25Outputs: Maps of distribution of sightings and group sizes
A double-platform line transect survey was conducted in July and August 1998 to investigate
the distribution and abundance of cetaceans in north-west Scotland. The transects consisted
of 2,156.5 km of effort, split into three survey strata: Outer Hebrides, west of the Shetland
Islands and the central Faroe-Shetland Channel (Figure 17), chosen as they were areas
licensed for oil exploration. A total of 304 marine mammal sightings were recorded (911
individuals), however, since the surveys were conducted in “passing mode” the vessel did
not approach any marine mammals for species identification or for estimation of group size,
and thus only 184 of the sightings were identified to species level.
Figure 17 Survey transects and strata covered in July/August 1998 (Macleod et al. 2003)
Macleod et al. (2003) provide maps of distribution of sightings and group sizes for various
cetacean species. Some survey tracks overlap the Draft Plan Option areas (e.g. the Stratum
A survey covers the N3 and N4 in the North region (Figure 17)), so the survey data although
quite dated does geographically overlap some relevant sites.
26MacLeod et al. (2008): White-beaked and short-beaked common dolphins in UK waters Species: Short-beaked common dolphin, white-beaked dolphin Relevant Draft Plan Option Region: All Relevant Draft Plan Option Area: All Area: Whole UK Year(s): 1983-1998 Month(s): May-Oct Outputs: Sightings maps. Sightings of white-beaked and short-beaked common dolphins were obtained by the Seabirds at Sea Team (SAST) of the Joint Nature Conservation Committee (JNCC) in summer months (May-Oct) between 1983 and 1998. The surveys were primarily conducted to record seabirds, however, observers also collected data on cetaceans observations. Sightings maps were provided for both species recorded in UK shelf waters
Figure 18 Total effort by Seabirds at Sea Team (SAST) surveys in shelf waters for summer months between
 1983 and 1998. Smallest circles, 0 –100 km2 surveyed; largest circles, .1000 km2 surveyed; grey shading, shelf
  waters of less than 200 m water depth. Note: SAST survey efforts in non-shelf waters are not shown on this
         figure. Approximate locations of Draft Plan Option regions and sites are Overlaid for reference.

MARINELife
Species: Atlantic white-sided dolphin, bottlenose dolphin, short-beaked common dolphin, harbour
porpoise, minke whale, Risso’s dolphin, grey seal, harbour seal, ‘cetacean sp.’, ‘dolphin sp.’, ‘whale
sp.’ and ‘seal sp.’.
Relevant Draft Plan Option Region: All
Relevant Draft Plan Option Area: SW1, E1, NE7
Area: Belfast – Glasgow, Belfast – Liverpool, Belfast – Heysham, Heysham-Warrenpoint, Rosyth-
Zeebrugge
Year(s): 2008-2019
Month(s): All
Outputs: Sightings and effort records.

                                                      28
MARINElife17 is a UK-based charity established in 1995 to co-ordinate and develop various
collaborative seabird and cetacean monitoring projects. Part of this work includes monthly
systematic cetacean and seabird surveys on a variety of commercial shipping routes in UK
waters, as well as on opportunistic small vessel surveys. Both effort and sightings are
recorded, as well as other metadata. For the purposes of this project, MARINElife have
provided all marine mammal sightings data within Scottish waters between 2008 and 2019.
Effort varied yearly, with between 2 and 12 months represented each year, and 1-2 days
effort per month. Beaufort sea state during effort varied between 0 and 8.
Data from MARINElife surveys between 1995 and 2010 are included in the Joint Cetacean
Protocol Database (Paxton et al. 2016). MARINElife data collected between 2008 and 2014
were also one of the data sources incorporated into the modelling to produce species
distribution maps presented by Waggitt et al. (2020).
Figure 19 MARINElife effort (strata start and end locations) between 2008 and 2019 within Scottish waters.
MarPAMM: Marine Protected Area Management & Monitoring
Species: Harbour porpoise, dolphin species
Relevant Draft Plan Option Region: West
Relevant Draft Plan Option Area: W1
Area: Hebrides
Year(s): 2019 - present
Month(s): May - Nov
17 http://www.marine-life.org.uk/
29Outputs: Tables of detection-positive hours (DPH)
The MarPAMM project18 is an EU INTERREG Va regional project, funded by the Special EU
Programmes Body (SEUPB). The MarPAMM project is developing tools for monitoring and
managing protected coastal marine environments in Ireland, Northern Ireland and Western
Scotland, and are collecting data on the abundance, distribution and movement of marine
protected species.
The project is ongoing and is expected to conclude by 31 March 2022. The MarPAMM
consortium consists of statutory organisations (Agri-Food and Biosciences Institute, Marine
Scotland and Scottish Natural Heritage), academic institutions (University College Cork;
Ulster University; Scottish Association for Marine Science) and a Non-Governmental
Organisations with expertise in a relevant field (BirdWatch Ireland).
Figure 20. Locations of MarPAMM acousitc monitoring stations on the west coast of Scotland. Overlaid for
reference are the Draft Plan Option sites
18 http://www.mpa-management.eu/
30MERP Project: Cetacean species distribution maps: Waggitt et al. (2020)
Species: Atlantic white-sided dolphin, bottlenose dolphin, fin whale, harbour porpoise, killer whale,
long-finned pilot whale, minke whale, Risso’s dolphin, short-beaked common dolphin, sperm whale,
striped dolphin and white-beaked dolphin.
Relevant Draft Plan Option Region: All
Relevant Draft Plan Option Area: All
Area: Whole UK
Year(s): 1980-2018
Month(s): All
Outputs: Species distribution maps available at monthly and 10 km2 density (animals/km2) scale
The aim of the MERP project (Marine Ecosystems Research Programme)19 was to produce
species distribution maps of cetaceans and seabirds at basin and monthly scales for the
purposes of conservation and marine management. A total of 2.68 million km of survey data
in the Northeast Atlantic between 1980 and 2018 were collated and standardized. Only
aerial and vessel survey data were included where there were dedicated observers and
where data on effort, survey area and transect design were available. The area covered by
Waggitt et al. (2020) comprised an area spanning between Norway and Iberia on a north-
south axis, and Rockall to the Skagerrak on an east-west axis.
Waggitt et al. (2020) predicted monthly and 10 km2 densities for each species (animals/km2),
and estimated the probability of encountering animals using a binomial model (presence-
absence model), and estimated the density of animals if encountered using a Poisson model
(count model). The product of these two components were used to present final density
estimations (Barry and Welsh 2002). The outputs of this modelling were monthly predicted
density surfaces for 12 cetacean (and 12 seabird) species at a 10 km resolution. The
cetacean maps provide density estimates for all Regional Boundaries and Draft Plan Option
sites within the Draft Sectoral Marine Plan for Offshore Wind Energy. There is no indication
of whether the more recent sightings data are weighted more heavily than older data, which
limits interpretation of how predictive the maps are to current distribution patterns.
The Supplementary Materials provided by Waggitt et al. (2020) include a table of data
providers, with distance and temporal coverage. However, there is no thorough description
of each dataset, and so it is unclear which datasets include data gained within Scottish
waters, and for which species they are relevant to. Such a document, similar to the
description of datasets provided as Appendix II of Paxton et al. (2016) for use when
interpreting the Joint Cetacean Protocol dataset, would be extremely useful when
interpreting the species distribution maps, and when comparing with the outputs with our
similar data collations.
19 https://www.pml.ac.uk/Research/Projects/Marine_Ecosystems_Research_Programme_(MERP)
31Figure 21 Summaries of cetacean surveys showing spatial and temporal variations in distances travelled by
vessels and aircraft, and spatial variations in the number of surveys per 10 x 10km cell (Supplementary
Information; Waggitt et al. 2020)
The authors list three key limitations of the data analysis and the resulting distribution maps
which require the maps to be interpreted carefully. Firstly, the influence of small or sub-
populations on the model is limited, secondly, the model doesn’t account for large changes
in populations within the study period and thirdly, although seasonal movement were
detected, there were also many instances of seasonal changes in densities without changes
in overall distribution. The authors state that because of these limitations, the maps “should
not be used as a representation of absolute densities and fine-scale distributions” and
recommend that instead, they are used as a “general illustration of relative densities and
broad-scale distribution over several decades”.
NASS (North Atlantic Sightings Surveys)
Species: Minke whale, fin whale, sei whale, long-finned pilot whale, humpback whale, sperm whale,
pilot whale, northern bottlenose whale, killer whale, white-beaked dolphin, and Atlantic white-sided
dolphin.
32Relevant Draft Plan Option Region: North, North East and East
Relevant Draft Plan Option Area: N1, NE1, NE2, NE3, NE4, NE5, NE6, NE7. NE8, E1, E2 and E3.
Area: North and east Scottish waters, North Sea, North Atlantic
Year(s): 1987, 1989, 1995, 2001, 2007 and 2015.
Month(s): All late June until the first week of August, except 1989 July-August.
Outputs: Sightings, abundance and distribution data,.
The North Atlantic Sightings Surveys (NASS) are internationally co-ordinated large-scale
ship and aerial cetacean surveys which cover a large but variable portion of the North
Atlantic, with six surveys over a 28-year period: 1987, 1989, 1995, 2001, 2007 and 2015.
The original surveys were organised under the Scientific Committee of the International
Whaling Commission (IWC), whereas those since 1989 were planned by the Scientific
Committee of the North Atlantic Marine Mammal Commission (NAMMCO), with on-going
oversight by IWC. Whilst sightings of all cetacean species were recorded, the surveys had a
particular focus on fin whales, minke whales, sei whales and long-finned pilot whales, with
survey methods and spatial and temporal extent sometimes optimised to suit the target
species (Pike et al. 2019a). NASS data relevant to Scottish waters and the Draft Plan
Options were likely ship-based data, as aircraft were only utilised for coastal areas of Iceland
and Greenland, although the 2007 Cetacean Offshore Distribution and Abundance in
European and Atlantic (CODA) survey (see section 0) was planned in conjunction with the
2007 NASS survey (Hammond et al. 2009).
Ongoing surveys have informed various peer review articles covering species abundance
and distribution of the North Atlantic (Borchers et al. 2009, Cañadas et al. 2009b,
Gunnlaugsson et al. 2009, Øien 2009, Víkingsson et al. 2009, Andersen and Olsen 2010,
Pike et al. 2019a, Pike et al. 2019b), with some covering Scottish waters, and most
published in the NAMMCO Scientific Publications series. For some years, the surveys did
not appear to enter relevant Draft Plan Option regions, though for others e.g. 1995 and
2001, the surveys covered two Draft Plan Option regions (North and North East).
Between surveys, there is a variation in method, for example there was a switch to the
double platform survey method for post-1995 surveys, and later surveys often had more
observers and thus greater observing power (Pike et al. 2019a). This has implications for the
interpretation of the data. For example, mark-recapture distance sampling is only possible
for survey data post-1995 as surveys prior to this did not use double platforms.
33You can also read