We See Exuberance Within Certain U.S. Tech Stocks Tech is expensive overall, while a subset of names (notably Zoom and Shopify) have alarming ...
←
→
Page content transcription
If your browser does not render page correctly, please read the page content below
?
We See Exuberance Within Certain U.S. Tech Stocks
Tech is expensive overall, while a subset of names (notably Zoom
and Shopify) have alarming valuations.

Morningstar Equity Research                          Zoom, Shopify, Palantir, DocuSign, and Others Are Priced Far Beyond Our Expectations
January 11, 2021                                     We've received inquiries from investors regarding valuations within the U.S. Technology sector. Across
                                                     our coverage, which skews toward large cap, moaty names and is centered around semis, software, and
Contents                                             hardware, we view the sector as expensive as the median price to fair value estimate ratio sits at 1.18 as
2 Key Takeaways                                      of Dec. 30, one of the highest ratios we've seen since 2007.
4 Our View of the 2020 Tech Landscape
7 What Went Right for Tech in 2020
12 How Common is the Zoom Move?                      We would require a pullback in stock prices before we can recommend many of our names to investors
18 Where Does Tech Go From Here?
                                                     with an attractive margin of safety. If we compare our coverage to the dot-com bubble (in which the
19 Software Multiples Are on the High Side
21 Company Overviews                                 NASDAQ declined 66% from 2000-2002), U.S. Tech is in a better place today. Many companies under our
                                                     coverage are supported by healthy free cash flow generation. Among other names that lack GAAP
                                                     profitability (mostly software), we still see firms making wise investments in sales and marketing to
Brian Colello                                        capture sticky customers in rapidly growing end markets in the once-in-a-generation shift toward cloud
Director of Technology Equity Research               computing and software-as-a-service. If our Tech coverage does in fact crash, we suspect it would be
+1 312-384-3742
brian.colello@morningstar.com
                                                     macro-driven, not because of highly risky bets on unproven technologies that fail to gain adoption.

Malik Ahmed Khan                                     Nonetheless, for more than a handful of U.S. Tech names, we saw unusual price appreciation in 2020.
Associate Equity Analyst
+1 312-244-7803
                                                     We identified 11 companies under our coverage where the stock price rose 100%-plus while reaching at
malikahmed.khan@morningstar.com                      least a $20 billion market cap in 2020, meaning that the company added at least $10 billion of market
                                                     value in a single year. Stocks include Coupa Software, CrowdStrike, DocuSign, Nvidia, Okta, Palantir,
Contributing Analysts:
Abhinav Davuluri                                     RingCentral, Shopify, Twilio, Zoom, and Zscaler.
Equity Strategist, Technology
+1 312-244-7400
abhinav.davuluri@morningstar.com                     These types of large moves are rare—we typically only see one or two companies receive such a
Dan Romanoff                                         massive infusion of investor dollars in a single year, and 1999 was the last time we saw more than five
Equity Analyst, Technology
+1 312-244-7816
                                                     companies appreciate to this extent. In recent years, the market made some wise investments to pile
dan.romanoff@morningstar.com                         into one or two of these stocks each year (especially FAANG). However, many investors did not fare well
Mark Cash                                            after 1999, which was the last time that the market rushed into more than a handful of Tech stocks.
Equity Analyst, Technology
+1 312-244-7022
mark.cash@morningstar.com                            Although we like many of these 11 businesses, we would anticipate poor outcomes for many investors
Nupur Balain                                         buying these stocks at today's prices, most notably Zoom and Shopify. In order to come close to such
Equity Analyst, Technology
+1 312-244-7955
                                                     valuations today, these firms not only require tremendous future growth and earnings power but also
nupur.balain@morningstar.com                         wide economic moats, whereas we are more skeptical about the ability of these firms to fend off
Important Disclosure
                                                     competition. Instead, we would point investors to our Company Reports on undervalued names across
The conduct of Morningstar's analysts is governed
by Code of Ethics/Code of Conduct Policy, Personal   our coverage (Intel, Splunk, Blackbaud, VMware) or even fairly valued bellwethers (Microsoft,
Security Trading Policy (or an equivalent of),
and Investment Research Policy. For information
                                                     Salesforce).
regarding conflicts of interest, please visit:
http://global.morningstar.com/equitydisclosures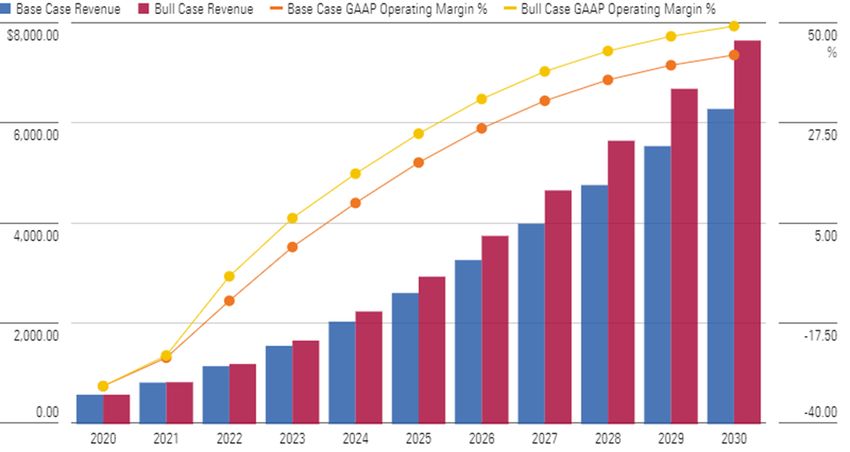
Page 2 of 54     We See Exuberance Within Certain U.S. Tech Stocks | 11 January 2021 | See Important Disclosures at the end of this report.

Page 2 of 54     Healthcare Observer | 11 January 2021

Page 2 of 54     Paper Title | 11 January 2021

Page 2 of 54     Healthcare Observer | 11 January 2021
                 Companies Highlighted
Page 2 of 54     Paper Title | 11 January 2021

                                                       Economic Moat                        Fair Value    Current Uncertainty Morningstar     Market
Page 2 of 54     Healthcare Observer | 11 January 2021
                 Name/Ticker                           Moat     Trend           Currency     Estimate       Price Rating      Rating          Cap(Bil)

Page 2 of 54     CoupaTitle
                 Paper   Software   COUP
                            | 11 January 2021            Narrow     Positive    USD           249.00   318.09 Very High QQ                      24.5
                 CrowdStrike CRWD                        Narrow     Positive    USD           162.00   208.85 High      QQ                      46.9
Page 2 of 54     DocuSignObserver
                 Healthcare DOCU | 11 January 2021       Narrow     Stable      USD           152.00   223.85 Very High QQ                      41.5
                 Nvidia NVDA                             Narrow     Positive    USD           340.00   504.58 Very High QQ                     323.2
                 Okta OKTA                               Narrow     Positive    USD           232.00   239.72 High      QQQ                     32.9
                 Palantir PLTR                           Narrow     Positive    USD            13.00    23.54 High      Q                       44.2
                 RingCentral RNG                         Narrow     Stable      USD           293.00   372.78 High      QQ                      34.0
                 Shopify SHOP                            Narrow     Stable      USD           657.00 1,085.56 Very High Q                      137.6
                 Twilio TWLO                             Narrow     Positive    USD           302.00   329.01 High      QQQ                     54.3
                 Zoom Video ZM                           None       Stable      USD           176.00   344.41 Very High Q                       96.5
                 ZScaler ZS                              Narrow     Positive    USD           140.00   184.42 High      QQ                      26.8

                 Key Takeaways
               × We would characterize our U.S. Technology coverage, which skews toward larger-cap companies with
                 sustainable competitive advantages, or economic moats, as overvalued. The median stock within our
                 coverage trades at a price/fair value ratio of 1.18 as of Dec. 30, which is one of the highest ratios we've
                 seen since 2007. In order to find investment ideas with an attractive margin of safety, we'd like to see a
                 pullback in stock prices across many of our names.
               × Compared with the dot-com bubble, however, in which the NASDAQ declined 66% from 2000-2002, U.S.
                 Tech is in a steadier place today. Unlike in the dot-com era, semiconductor and hardware companies
                 have fundamental earnings power to support valuations.
               × Even in software, where many names do not have fundamental GAAP earnings, we think that many
                 companies are wisely investing in sales and marketing in order to win new business during the once-in-
                 a-generation shift to SaaS and cloud computing. Moaty software companies under our coverage have
                 proven to us that they benefit from customer switching costs and are likely to continue to upsell and
                 cross-sell into sticky enterprises over time.
               × We see a handful of firms with astronomical valuations that go far beyond our fundamental
                 expectations. We also see sky high price/sales multiples in the top decile and quartile of software
                 stocks. When thinking about a "bubble," we can construct a basket of highly overvalued Tech names
                 where valuations are exuberant and might "burst" in the future.
               × In 2020, we found 11 companies under our U.S. Tech coverage where the stock price rose 100%-plus
                 while reaching at least a $20 billion market cap, meaning that the company added at least $10 billion of
                 market value in a single year. We have not seen so many U.S. Tech companies make this type of leap in
                 valuation since just before the dot-com bubble in 1999.
               × We believe these stocks have doubled due to favorable trends in remote working software tools,
                 increasing investment in cloud-based cybersecurity, advancements in artificial intelligence and data
                 center buildouts, and the once-in-a-generation shift to SaaS. We lifted our fair value estimates in 2020
                 as a portion of this value creation was justified with stronger-than-anticipated growth and earnings, but
                 market prices still soared past our revised valuations.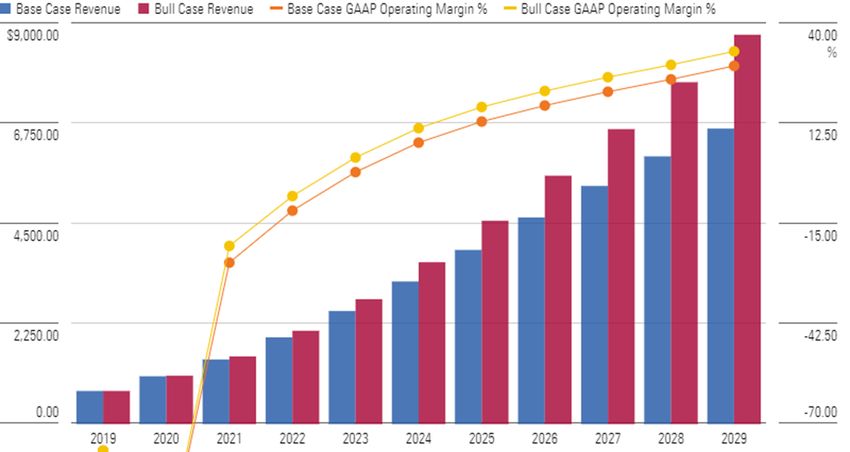
Page 3 of 54 We See Exuberance Within Certain U.S. Tech Stocks | 11 January 2021 | See Important Disclosures at the end of this report.
Page 3 of 54 Healthcare Observer | 11 January 2021
Page 3 of 54 Paper Title | 11 January 2021
Page 3 of 54 Healthcare Observer | 11 January 2021
× When one or two companies make these types of moves per year, the market often got it right
Page 3 of 54 Paper Title | 11 January 2021
(especially with FAANG stocks). Investors were wise to pile into Apple and Nvidia, for example.
Page 3 of 54 However,
Healthcare when
Observer | 11aJanuary
larger2021
number of companies made such moves, such as in 1999, investors were not
pleased with the outcome. At best, investors were far too early and it took 10-20 years for long-term
Page 3 of 54 Paper Title | 11 January 2021
fundamentals to catch up with these enormous valuations.
Page 3 of 54 × Looking across| these
Healthcare Observer 112021
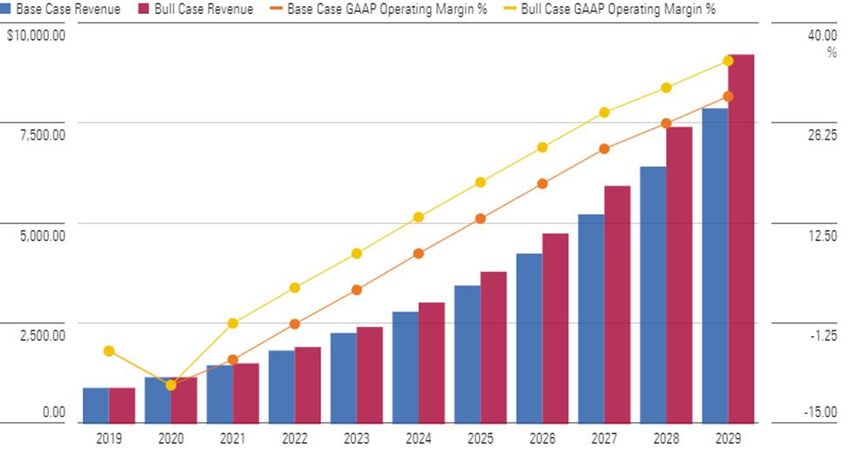
11 January overvalued names, we struggle most with current valuations for Zoom, Shopify,
and Palantir, which trade at roughly 2 times our fair value estimates. We struggle to build a reasonable
bull-case scenario that can justify market prices. Rather, we would need to see more than 20 years of
robust earnings growth out to 2040 to justify such valuations, all while presuming market dominance
without fear of competition from others.
× Several names trade about 30% higher than our fair value estimates, including Nvidia, Zscaler, Coupa,
and DocuSign. We foresee strong revenue growth and earnings for these names, but these stocks
would have to fire on all cylinders for a decade or longer in order for future fundamentals to justify
today's stock prices.
× Several other stocks within our list are high quality and appear overvalued, but we can build a
reasonable bull-case scenario to justify current prices and we'd likely be buyers on pullbacks. This list
includes Twilio, RingCentral, Okta, and CrowdStrike, with the latter two boosted recently by a rosier
outlook for cybersecurity spending because of a recent hack breaching a widespread number of
enterprises and government entities.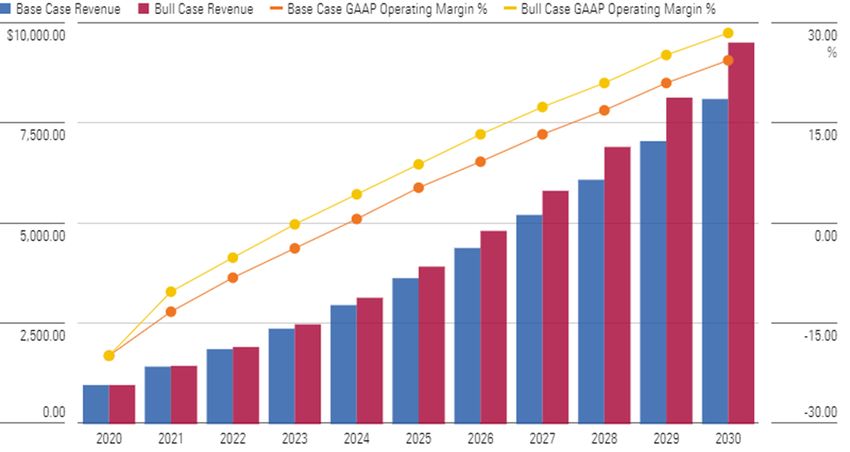
Page 4 of 54   We See Exuberance Within Certain U.S. Tech Stocks | 11 January 2021 | See Important Disclosures at the end of this report.

Page 4 of 54   Healthcare Observer | 11 January 2021

Page 4 of 54   Paper Title | 11 January 2021

Page 4 of 54   Healthcare Observer | 11 January 2021
               Our View of the U.S. Tech Investing Landscape as We Exit 2020
Page 4 of 54   Paper Title | 11 January 2021
               2020 was a sad year in many ways, but one area where we saw no signs of disappointment was in U.S.
Page 4 of 54   Technology
               Healthcare      stocks
                          Observer       under2021
                                   | 11 January our     coverage (108 names as of December). The sector significantly
               outperformed the broader U.S. market in 2020, and we witnessed more than a handful of stocks with
Page 4 of 54   Paper Title | 11 January 2021
               significant price appreciation.
Page 4 of 54   Healthcare Observer | 11 January 2021

               Much went right for U.S. Tech in 2020. In some cases, Tech stocks were a safe haven as enterprises did
               not slash their software budgets during the COVID-19 pandemic. In other cases, enterprises and
               consumers turned to a wave of cloud, remote working, and e-commerce technologies such as Zoom,
               DocuSign, Shopify, Zscaler, and others. In more cases still, software firms like Coupa and Twilio
               prospered from strong secular growth trends despite the pandemic. Zoom was the poster child for a
               counter-cyclical name, rising over 390% in 2020. Many other stocks doubled in 2020 and prices
               exceeded our fair value estimates.

               Looking at U.S. Tech today, we see an expensive sector and we would need a pullback in stock prices
               before we can recommend many names to investors with an adequate margin of safety. The median
               price to fair value estimate ratio across our coverage sits at 1.18 as of Dec 30, one of the highest ratios
               we've seen since 2007.

               These valuations have led investors to throw the "bubble" term around. In this context, our team's view
               of a sector that is 18% overvalued does not point toward a repeat of the dot-com bubble, in which the
               NASDAQ crashed by 66% from 2000-2002. Compared with the dot-com era, our U.S. Tech coverage is in
               a steadier place. Companies within our universe (particularly in semis, IT services, and mature software)
               generate healthy free cash flow that can support existing valuations to a large extent.

               Even in software, where many names do not have fundamental GAAP earnings, we think that many
               companies are wisely investing in sales and marketing in order to win new business during the once-in-
               a-generation shift to SaaS and cloud computing. Moaty software companies under our coverage have
               proven to us that they benefit from customer switching costs and have sticky customers where revenue
               per enterprise may rise over time.

               While we can't rule out any macroeconomic factors that might cause the market to crash, we're not
               seeing bets across our coverage on highly risky technologies that are unlikely to gain adoption and
               cause investments to evaporate. We also acknowledge that our analysis is limited to U.S. Tech stocks
               under our coverage, which skews toward larger cap, moaty names, and we are not commenting on
               other sub-sectors that tend to be considered "Tech-like" (electric vehicle technologies, FinTech, social
               media), or other asset classes (say, cryptocurrencies).

               While this commentary pertains to the sector as a whole, we saw a subset of Tech names with massive
               stock price appreciation in 2020, well beyond the sort of price appreciation we tend to observe in a
               normal year. As we watched prices soar past our fundamental valuations, we asked ourselves two main
Page 5 of 54                                        We See Exuberance Within Certain U.S. Tech Stocks | 11 January 2021 | See Important Disclosures at the end of this report.

Page 5 of 54                                        Healthcare Observer | 11 January 2021

Page 5 of 54                                        Paper Title | 11 January 2021

Page 5 of 54                                        Healthcare Observer | 11 January 2021
                                                    questions. First, how common are these large moves in U.S. Tech equities? Second, does the market get
Page 5 of 54                                        Paper Title | 11 January 2021
                                                    it right to pile into these names, or do these massive market moves end poorly for investors?
Page 5 of 54                                        Healthcare Observer | 11 January 2021
                                                    First, we identified 11 companies under our U.S. Tech coverage where the stock price rose 100%-plus
Page 5 of 54                                        Paper Title | 11 January 2021
                                                    while reaching at least a $20 billion market cap, meaning that the company added at least $10 billion of
Page 5 of 54                                        market value
                                                    Healthcare Observerin| 11
                                                                            a January
                                                                              single2021
                                                                                      year   (and also strips out small caps, takeovers, and lesser-known names).

                                                    Exhibit 1 11 Companies Within Our U.S. Tech Coverage Gained 100% Plus and Exceeded $20 Billion of Market Cap

                                                                                                        Price %      Market Cap
                                                        Ticker           Company Name                   Change    12/31/20 (USD b)                     Moat             Moat Trend
                                                        COUP          Coupa Software                         121%             24.5                    Narrow             Positive
                                                        CRWD          CrowdStrike                            328%             46.9                    Narrow             Positive
                                                        DOCU          DocuSign                               193%             41.5                    Narrow             Stable
                                                        NVDA          Nvidia                                 118%            323.2                    Narrow             Positive
                                                         OKTA         Okta                                   117%             32.9                    Narrow             Positive
                                                         PLTR         Palantir                               148%             44.2                    Narrow             Positive
                                                         RNG          RingCentral                            119%             34.0                    Narrow             Stable
                                                         SHOP         Shopify                                176%            137.4                    Narrow             Stable
                                                        TWLO          Twilio                                 228%             54.3                    Narrow             Positive
                                                          ZM          Zoom Video                             391%             96.5                     None              Stable
                                                          ZS          Zscaler                                322%             26.8                    Narrow             Positive

                                                    Source: Morningstar. Data as of Jan. 7, 2021

Exhibit 2 Several High Fliers in U.S. Tech, Notably Zoom, Far Outpaced the Broader Market

Source: Morningstar. Data as of Jan. 7, 2021. Average includes COUP, CRWD, DOCU, NVDA, OKTA, RNG, SHOP, TWLO, ZS. Excludes Palantir as it became public in September 2020.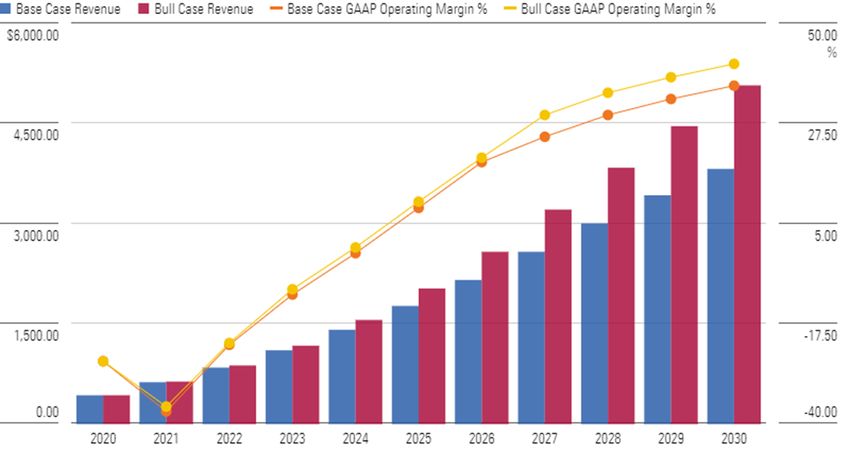
Page 6 of 54   We See Exuberance Within Certain U.S. Tech Stocks | 11 January 2021 | See Important Disclosures at the end of this report.

Page 6 of 54   Healthcare Observer | 11 January 2021

Page 6 of 54   Paper Title | 11 January 2021

Page 6 of 54   Healthcare Observer | 11 January 2021
               We then looked at data going back to 1990 to see how many U.S. Tech firms made similar moves. In
Page 6 of 54   Paper Title | 11 January 2021
               short, these types of moves are rare—we typically only see one or two companies receive such a large
Page 6 of 54   infusionObserver
               Healthcare of investor  dollars
                                | 11 January 2021in     a single year, and 1999 was the last time we saw more than five names
               make similar moves.
Page 6 of 54   Paper Title | 11 January 2021

Page 6 of 54   To answer
               Healthcare    our |second
                          Observer 11 Januaryset
                                              2021of   questions, we looked at how these stocks performed after investors piled
               into these U.S. Tech names. In general, the market got it right a reasonable number of times, especially
               in recent years and if we expand our search slightly to include all of the FAANG names (Facebook,
               Amazon, Apple, Netflix, Google). Ultimately, future revenue growth and earnings potential justified such
               moves.

               However, the last time we saw more than a handful of names receive such an infusion of investor
               dollars, it was 1999, just before the dot-com crash. The outcome was not pretty for investors thereafter.
               In a best-case scenario, if investors held those stocks until today, they would have been about 10-20
               years too early in terms of witnessing long-term fundamental revenue and earnings growth that justified
               these enormous valuations in 1999.

               Looking at these 11 stocks today, we like all of these businesses as we award 10 of them with narrow
               moats (Zoom is the exception with a no-moat rating) and award many of these stocks with positive moat
               trend ratings. We are seeing strong growth prospects for these firms in large potential end markets, and
               we would not hesitate to recommend these names if valuations were more reasonable.

               On the other hand, based on today's prices, we would anticipate poor outcomes for many investors,
               most notably Zoom and Shopify. In order to come close to such valuations today, these firms not only
               require tremendous future growth and earnings power but also wide economic moats, whereas we are
               more skeptical about the ability of these firms to fend off competition. Most of these companies have to
               emerge as powerhouses as far out as 2040 to justify current prices.

               Ultimately, we would steer investment dollars away from these 11 high fliers. We acknowledge that we
               don't have many long investment ideas within the U.S. Tech sector at the moment. Since the sector is
               relatively expensive, we would instead point investors to our company reports on our remaining handful
               of undervalued names (Intel, Splunk, Blackbaud, VMware) or even fairly valued wide-moat bellwethers
               (Microsoft, Salesforce).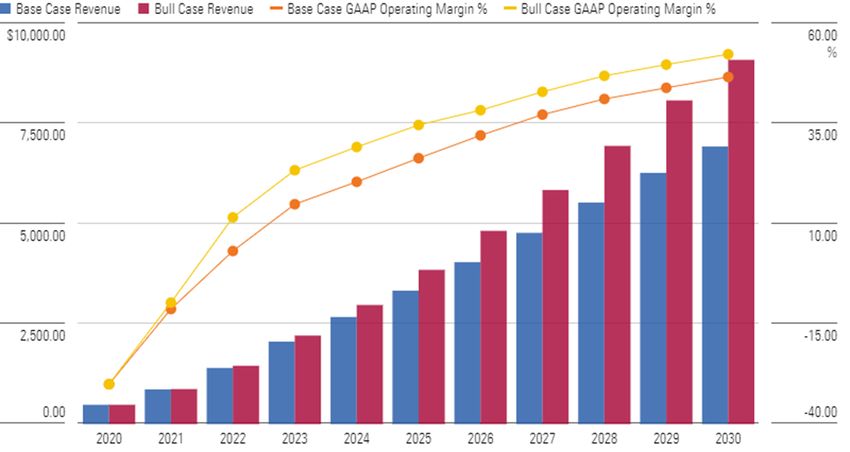
Page 7 of 54   We See Exuberance Within Certain U.S. Tech Stocks | 11 January 2021 | See Important Disclosures at the end of this report.

Page 7 of 54   Healthcare Observer | 11 January 2021

Page 7 of 54   Paper Title | 11 January 2021

Page 7 of 54   Healthcare Observer | 11 January 2021
               What Went Right for Technology in 2020
Page 7 of 54   Paper Title | 11 January 2021
               In a difficult year for most people and many companies large and small, 2020 was a banner year for
Page 7 of 54   Technology
               Healthcare      investors.
                          Observer           As2021
                                   | 11 January  of    Dec. 7, the Morningstar U.S. Technology Index was up a whopping 43.3% on
               a trailing 12-month basis, vastly outperforming the U.S. equity market, which is up 18.4% on a TTM
Page 7 of 54   Paper Title | 11 January 2021
               basis. As shown in Exhibit 3 below, U.S. Technology was an outperformer during both the COVID-19-
Page 7 of 54   related market
               Healthcare Observer | sell-off
                                     11 Januaryin2021
                                                   March      2020 and the subsequent market recovery.

               Exhibit 3 Tech Outperformed the Broader Market in Both the COVID-19 Sell-Off and Rebound

               Source: Morningstar. Data as of Dec. 7, 2020

               Ultimately, we think Tech in 2020 could be viewed as all things to all investors—both a safe haven and
               a sector with strong secular growth. First, during the depths of the downturn, Tech was considered by
               many to be a safe haven and we'd concur with this view. As we wrote in our April 2020 special report,
               "COVID-19 Fear Creates Rare Opportunity for Software Investors," we did not anticipate deteriorating
               fundamentals at wide-moat software names such as Microsoft, ServiceNow, Salesforce, or Tyler
               Technologies, among others. These moaty software names have sticky customer bases and healthy
               deferred revenue balances with excellent visibility and were still poised to expand within their cohorts of
               existing customers. As the world shifted to remote working, we were highly skeptical that enterprises
               would start slashing their software budgets, giving their workers fewer tools and adding workflow
               disruptions to their daily businesses. White collar workers didn't stop using Office 365 during the
               pandemic, sales representatives didn't abandon Salesforce, HR professionals didn't cut back on their
               usage of Workday, etc. Admittedly, revenue growth and new software wins were dampened in 2020
               versus our expectations at the start of the year, but the software sector fared far better than many other
               investment sectors.

               Second, on the upside, secular growth drivers within Tech remained intact. The shift toward cloud
               computing and the outsourcing of IT workloads remained in full force during the pandemic as
               businesses strived to keep up with a more flexible workforce and changing world. Microsoft Azure, for
               one, continues to perform well with 48% year-over-year growth in the third quarter of 2020, for example.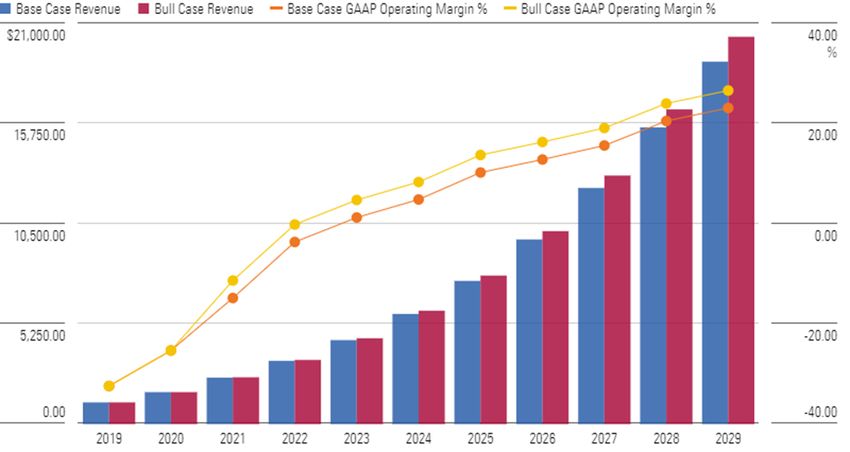
Page 8 of 54   We See Exuberance Within Certain U.S. Tech Stocks | 11 January 2021 | See Important Disclosures at the end of this report.

Page 8 of 54   Healthcare Observer | 11 January 2021

Page 8 of 54   Paper Title | 11 January 2021

Page 8 of 54   Healthcare Observer | 11 January 2021
               Third, the shift to remote working led to a near-term boost in IT spend within enterprises, as companies
Page 8 of 54   Paper Title | 11 January 2021
               raced to equip their employees with newer PCs, monitors, and peripherals. Similarly, data center
Page 8 of 54   spending,
               Healthcare    especially
                          Observer          within
                                   | 11 January 2021   the cloud, remained robust. This accelerated refresh cycle won't last forever
               (and it may have already reverted back to the mean), but it led to some decent results within
Page 8 of 54   Paper Title | 11 January 2021
               semiconductors and hardware.
Page 8 of 54   Healthcare Observer | 11 January 2021

               Fourth, and perhaps most notable, were Tech names that were counter cyclical to the pandemic and
               appear poised to be winners in the "new working world" once the pandemic subsides. Zoom was the big
               winner here with the stock rising 391% in 2020 and making massive moves on days when the market
               was most panicked. A good portion of this move was justified. In Zoom's first quarter, we wrote that
               Zoom reported one of the greatest quarters in the history of the software sector and we stand by this
               comment. It isn't every day that revenue grows 169% year over year, and the firm reported $328 million
               of revenue versus CapIQ consensus of $202 million and the company's own guidance of $200 million.
               DocuSign and Shopify were other firms poised to benefit from a rise in e-commerce and fewer face-to-
               face interactions.

               The Eleven (!!) Horsemen of U.S. Tech in 2020
               Thanks to these trends, many U.S. Tech stocks not only outperformed the broader market in 2020 but
               appreciated in eye-popping fashion. We identified 11 stocks within our U.S. Technology universe that
               rose more than 100% in 2020 while adding $10 billion or more of market capitalization. We think the
               latter criteria is important—these companies weren't taken over or popped based on a single customer
               or design win, rather, they received a significant inflow of capital. The market has given these 11 stocks
               some credibility regarding their future outlooks.

               We would put these stocks into three broad categories, along with a couple of other outliers:

               1. The Acceleration of Remote Working and Online Everything—Zoom, RingCentral, DocuSign,
               Shopify, Twilio
               In a world where everything moved remotely, several names were countercyclical to the market and
               beneficiaries of the online trend. Zoom's video communications are now a part of the daily lexicon as it
               seems as if everyone partakes in Zoom calls either for business or pleasure in 2020. RingCentral's
               Unified Communications as a Service (UCaaS) replaces the physical office phone with a virtual solution
               that can be accessed from anywhere. DocuSign is a leader in eSignatures, which remains an obvious
               use case to us as it replaces the tedious nature of shipping, signing, and reshipping paper documents.
               Shopify's e-commerce tools were vital to retailers, large and small, during the pandemic. Twilio's focus
               on customer engagement was critical as enterprises strived to interact with customers in new ways
               during the year. For example, Twilio's platform may have been the backbone to providing consumers
               with text alerts that their curbside orders are ready for pickup.

               In each of these cases, we anticipated strong growth for these firms in the decade ahead. But in a quote
               from Vladimir Lenin that we heard quite often in 2020, "there are weeks where decades happen," and
               gradual shifts toward these technologies turned into a mad rush to shift virtually.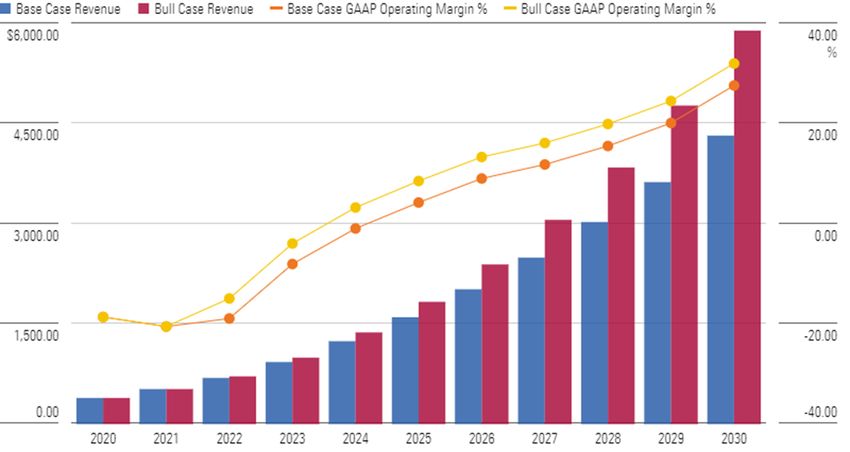
Page 9 of 54   We See Exuberance Within Certain U.S. Tech Stocks | 11 January 2021 | See Important Disclosures at the end of this report.

Page 9 of 54   Healthcare Observer | 11 January 2021

Page 9 of 54   Paper Title | 11 January 2021

Page 9 of 54   Healthcare Observer | 11 January 2021
               2. The Rush for Cloud-Based Cybersecurity—Okta, CrowdStrike, Zscaler
Page 9 of 54   Paper Title | 11 January 2021
               As we wrote in our July 2020 special report "Seeking (Cyber)Security in Uncertain Times," the rise of
Page 9 of 54   remote working
               Healthcare Observer | 11led  to more
                                         January 2021   employees accessing more enterprise tools from a far wider variety of
               locations. All the while, cybersecurity threats during the pandemic were on the rise. Adoption of cloud-
Page 9 of 54   Paper Title | 11 January 2021
               based security tools from Okta, CrowdStrike, and Zscaler, in particular, accelerated during the pandemic,
Page 9 of 54   and we Observer
               Healthcare do not |expect  this
                                  11 January 2021trend      to revert after workers return to offices.

               3. Ongoing Secular Strength in SaaS and a Year of Beat-and-Raises—Twilio, Coupa Software
               The rise of cloud computing and software-as-a-service (SaaS) continues to be the strongest secular trend
               within Technology, and COVID-19 did nothing to abate these tailwinds. Regardless of where employees
               worked, more and more enterprises became reliant on a greater assortment of cloud-based software
               tools. Twilio and Coupa were shining examples of this theme in 2020. Twilio's importance during COVID-
               19 was mentioned above. Coupa's software helps enterprises streamline their spending on indirect
               expenses, and belt tightening during COVID-19 likely made Coupa's platform all the more attractive.

               Outside of these three themes, we have a couple of one-off, high fliers. Palantir became public in
               September 2020, and after a rough start, investor dollars flooded the offering. We were on the high side
               of Street targets with a $13 fair value estimate in September, as noted in our special report, "Peering
               Into Narrow-Moat Palantir's Data Market Disruption." Yet the stock rose 167% in the month of
               November alone, from the $10.50 range to the high $20 range.

               Finally, Nvidia is a stock that not only landed on this list of 100%-plus, $20 billion-plus Tech companies in
               2020 (and in prior years as well), the rise of its best-of-breed GPUs, or graphics processor units,
               continues. Nvidia remains well positioned to supply server GPUs for accelerating the training of artificial
               intelligence models and was well exposed to rising data center spending in 2020. Meanwhile, the firm
               leveraged its high stock price to make a wise strategic deal (still pending) to acquire ARM Holdings,
               which we formerly rated as a wide-moat stock when it was publicly traded several years ago.

               We Haven't Sat Idle—Our Fundamental Fair Value Estimates Rose, but Market Valuations Soared
               Higher
               Looking at our coverage of these 11 names, we certainly did not predict the opportunities caused by the
               COVID-19 pandemic a year ago. However, our analyst team reacted to the shifting fundamentals and
               reassessed our valuations of these names during 2020, leading to some sizably higher fair value
               estimates. Nonetheless, the market still appears far more bullish than us on these names. We're not
               overly bearish relative to near-term consensus estimates, but asset managers have bid these 11 stocks
               up to mostly unreasonable valuations and sky-high multiples.
Page 10 of 54   We See Exuberance Within Certain U.S. Tech Stocks | 11 January 2021 | See Important Disclosures at the end of this report.

Page 10 of 54   Healthcare Observer | 11 January 2021

Page 10 of 54   Paper Title | 11 January 2021

Page 10 of 54   Healthcare Observer | 11 January 2021
                Exhibit 4 Our Fair Value Estimates Rose Significantly in 2020, More Than Doubling on Average, as Fundamentals
Page 10 of 54   Paper Title | 11 January 2021
                Improved (Red Line). Yet Stock Prices Rose Even Faster on Average, More Than Tripling
Page 10 of 54   Healthcare Observer | 11 January 2021

Page 10 of 54   Paper Title | 11 January 2021

Page 10 of 54   Healthcare Observer | 11 January 2021

                Source: Morningstar. Data as of Jan. 7, 2021
                Fair value estimates and stock prices are indexed at 100 at Jan 1, 2020. Excludes Palantir

                Exhibit 5 Buying Opportunities at the Start of 2020 Evaporated, While Other Names Remained Overvalued
                Throughout the Year….

                     Ticker             Company Name       P/FVE Jan 1 P/FVE Mar 30 P/FVE Jul 30 P/FVE Dec 31
                     COUP            Coupa                        1.13        1.14         1.89          1.37
                     CRWD            CrowdStrike                              0.86         1.38          1.30
                     DOCU            DocuSign                                 0.97         2.05          1.49
                     NVDA            Nvidia                       1.62        1.58         2.09          1.55
                      OKTA           Okta                                     0.81         1.24          1.12
                      PLTR           Palantir Technologies                                               1.93
                      RNG            RingCentral                  0.73        0.91         1.00          1.32
                      SHOP           Shopify                      2.25        2.03         4.16          2.26
                     TWLO            Twilio                       0.74        0.68         1.81          1.16
                       ZM            Zoom Video Comm.             1.31        2.45         2.18          2.01
                       ZS            Zscaler                      0.86        1.09         1.76          1.44

                Source: Morningstar. Data as of Jan. 7, 2021
Page 11 of 54 We See Exuberance Within Certain U.S. Tech Stocks | 11 January 2021 | See Important Disclosures at the end of this report.
Page 11 of 54 Healthcare Observer | 11 January 2021
Page 11 of 54 Paper Title | 11 January 2021
Page 11 of 54 Healthcare Observer | 11 January 2021
Exhibit 6 … And Valuations Still Appear Extreme on Either a Price/Earnings Basis ….
Page 11 of 54 Paper Title | 11 January 2021
Page 11 of 54 Healthcare Observer | 11 January 2021 Current Market Cap Street CY Street Fwd Current
Ticker Company Name Stock Price (USD m) Adj EPS Adj EPS Year P/E Fwd. P/E
Page 11 of 54 PaperCOUP
Title | 11 January
Coupa 2021
Software $ 318.09 22,959 $ 0.47 $ 0.39 670.6 822.2
CRWD CrowdStrike $ 208.85 46,740 $ 0.22 $ 0.32 949.5 644.2
Page 11 of 54 Healthcare
DOCUObserver | 11 January 2021
DocuSign $ 223.85 41,761 $ 0.74 $ 1.11 303.6 201.7
NVDA Nvidia $ 504.58 312,335 $ 9.70 $ 11.57 52.0 43.6
OKTA Okta $ 239.72 31,036 $ 0.04 $ (0.03) 5,513.0 (9,505.2)
PLTR Palantir $ 23.54 46,197
RNG RingCentral $ 372.78 33,413 $ 1.16 $ 1.52 320.5 245.6
SHOP Shopify $ 1,085.56 134,701 $ 3.73 $ 4.98 291.3 217.9
TWLO Twilio $ 329.01 52,800 $ 0.10 $ 0.55 3,322.3 599.6
ZM Zoom Video $ 344.41 98,504 $ 2.91 $ 2.96 118.5 116.3
ZS Zscaler $ 184.42 25,963 $ 0.38 $ 0.59 484.3 314.3
Source: Morningstar. Data as of Jan. 7, 2021
Exhibit 7 … Or a Price/Sales Basis….
Current
Current Market Cap Street CY Street Fwd Year Fwd.
Ticker Company Name Stock Price (USD m) Revenue Revenue Price/Sales Price/Sales
COUP Coupa Software $ 318.09 $ 22,959 $ 525 $ 667 43.8 34.4
CRWD CrowdStrike $ 208.85 $ 46,740 $ 859 $ 1,193 54.4 39.2
DOCU DocuSign $ 223.85 $ 41,761 $ 1,430 $ 1,890 29.2 22.1
NVDA Nvidia $ 504.58 $ 312,335 $ 16,483 $ 19,668 18.9 15.9
OKTA Okta $ 239.72 $ 31,036 $ 822 $ 1,069 37.7 29.0
PLTR Palantir $ 23.54 $ 46,197
RNG RingCentral $ 372.78 $ 33,413 $ 1,434 $ 1,772 23.3 18.9
SHOP Shopify $ 1,085.56 $ 134,701 $ 3,875 $ 5,388 34.8 25.0
TWLO Twilio $ 329.01 $ 52,800 $ 2,188 $ 2,817 24.1 18.7
ZM Zoom Video $ 344.41 $ 98,504 $ 2,583 $ 3,507 38.1 28.1
ZS Zscaler $ 184.42 $ 25,963 $ 611 $ 798 42.5 32.5
Source: Morningstar. Data as of Jan. 7, 2021Page 12 of 54 We See Exuberance Within Certain U.S. Tech Stocks | 11 January 2021 | See Important Disclosures at the end of this report.
Page 12 of 54 Healthcare Observer | 11 January 2021
Page 12 of 54 Paper Title | 11 January 2021
Page 12 of 54 Healthcare Observer | 11 January 2021
Exhibit 8 …And We're Not Far Off From Near-Term Consensus Estimates
Page 12 of 54 Paper Title | 11 January 2021
Page 12 of 54 Street CY Street Fwd MORN CY Observer
Healthcare MORN Fwd Street
| 11 January 2021 CY Street Fwd MORN CY MORN Fwd
Ticker Adj EPS Adj EPS Adj EPS Adj EPS Revenue ($m) Revenue ($m) Revenue ($m) Revenue ($m)
PageCOUP
12 of 54 $ 0.47 $ 0.39 $ Paper
0.48Title$| 11 January 2021 $
0.63 525 $ 667 $ 524 $ 690
CRWD $ 0.22 $ 0.32 $ 0.23 $ 0.66 $ 859 $ 1,193 $ 865 $ 1,400
Page 12 of 54 Healthcare Observer | 11 January 2021
DOCU $ 0.74 $ 1.11 $ 0.76 $ 1.21 $ 1,430 $ 1,890 $ 1,433 $ 1,868
NVDA $ 9.70 $ 11.57 $ 10.31 $ 11.08 $ 16,483 $ 19,668 $ 16,544 $ 19,288
OKTA $ 0.04 $ (0.03) $ 0.07 $ 0.21 $ 822 $ 1,069 $ 828 $ 1,155
PLTR $ 0.11 $ 0.13 $ 1,073 $ 1,450
RNG $ 1.16 $ 1.52 $ 0.97 $ 1.32 $ 1,434 $ 1,772 $ 1,168 $ 1,467
SHOP $ 3.73 $ 4.98 $ 4.26 $ 3.02 $ 3,875 $ 5,388 $ 2,845 $ 3,594
TWLO $ 0.10 $ 0.55 $ 0.12 $ 0.34 $ 2,188 $ 2,817 $ 1,673 $ 2,433
ZM $ 2.91 $ 2.96 $ 2.94 $ 2.99 $ 2,583 $ 3,507 $ 2,585 $ 3,282
ZS $ 0.38 $ 0.59 $ 0.47 $ 0.81 $ 611 $ 798 $ 626 $ 845
Source: Morningstar. Data as of Jan. 7, 2021
How Common Is the Zoom Move? A Look at Historical U.S. Tech Performance
Looking at Zoom in particular and the massive appreciation of these 11 stocks in general, we asked
ourselves two main questions. First, how rare (or common) are these types of moves? And second, and
perhaps more important, does the market generally get it right, or do these moves fail to pan out and
lead to outcomes that are far worse, such as vaporware and bankruptcies?
Our Search Methodology for Large Cap Tech Moves
We began our search by looking at companies within the U.S. Technology and Communications Services
sectors that at least doubled their market price (100% plus) in 2020 on a year-to-date basis while adding
$10 billion or more to their market cap, thus exiting the year with a $20 billion-plus valuation. This $20
billion threshold eliminates small cap names that might double based on a single customer win, M&A,
surviving bankruptcy, or some other newsworthy item. We then ran the same analysis for each year
from 1990 to 2019.
Our industry classifications are based on Morningstar's Global Equity Classification Structure (GECS)
codes. We added Communications Services to gauge the rise of stocks in media or social media that are
often characterized as Tech (i.e., firms like Google, Facebook, Netflix, and others), as it was unclear to us
initially whether Tech in the form of software, semis, or hardware had these types of big moves at all.
Several other stocks appeared within our search that are technically Tech stocks per GECS but are not
covered by our U.S. Technology team—Square and Zillow Group are two such examples. Finally, we also
ran a similar search using S&P's Global Industry Classification Standard (GICS) codes. We found similar
results to our GECS search, although Amazon is included in Tech per GICS (but not GECS) and is a
notable example of a company that has doubled a couple of times over the past three decades.
Full, unedited results are in Appendix 1 at the back of this report. Once we determined that U.S. Tech
had enough of a track record on its own, we then stripped out Communications Services stocks, with
results in Appendix 2. We then narrowed the search further to include only U.S. Technology companiesPage 13 of 54 We See Exuberance Within Certain U.S. Tech Stocks | 11 January 2021 | See Important Disclosures at the end of this report.
Page 13 of 54 Healthcare Observer | 11 January 2021
Page 13 of 54 Paper Title | 11 January 2021
Page 13 of 54 Healthcare Observer | 11 January 2021
that are either within our coverage today or were covered by our sector team in the past (and/or would
Page 13 of 54 Paper Title | 11 January 2021
be covered by our team in the future if we were to resume coverage). Here are the full results:
Page 13 of 54 Healthcare Observer | 11 January 2021
Exhibit 9 U.S. Tech Stocks With >= 100% 1 Year Price Change and >= $20 Billion in Market Cap Since 1995
Page 13 of 54 Paper Title | 11 January 2021
Price % Market Cap Current Market Cap Market Cap
Page 13 of 54 Healthcare Observer | 11 January 2021
Year Ticker Company Name Change YTD (USD m) Stock Price Today (USD m) CAGR Growth
1995 CSCO Cisco Systems (NAS: CSCO) 112.4 20,604 $ 44.40 187,613 9.2%
1996 INTC Intel (NAS: INTC) 130.7 107,505 $ 51.10 209,408 2.8%
1998 CSCO Cisco Systems (NAS: CSCO) 149.7 146,000 $ 44.40 187,613 1.1%
1998 DELL Dell EMC 203.2 41,899 $ 74.07 55,081 1.3%
1998 MSFT Microsoft (NAS: MSFT) 114.6 348,107 $ 212.25 1,604,715 7.2%
1998 Sun Microsystems (ORCL) 114.7 32,648
1999 AMAT Applied Materials (NAS: AMAT) 196.8 48,479 $ 90.83 83,050 2.6%
1999 CSCO Cisco Systems (NAS: CSCO) 130.8 355,123 $ 44.40 187,613 -3.0%
1999 GLW Corning (NYS: GLW) 186.5 31,641 $ 36.90 28,192 -0.5%
1999 DELL Dell EMC 162.6 113,540 $ 74.07 55,081 -3.4%
1999 Gateway (Acer) 181.6 22,551
1999 MSI Motorola Solutions (NYS: MSI) 141.2 90,235 $ 170.68 28,934 -5.3%
1999 Nortel Networks 304.0 139,093
1999 ORCL Oracle (NYS: ORCL) 289.8 158,096 $ 62.57 184,208 0.7%
1999 QCOM Qualcomm (NAS: QCOM) 2,618.8 124,739 $ 151.19 170,996 1.5%
1999 Solectron (Flex) 104.7 28,189
1999 Sun Microsystems (ORCL) 261.7 135,281
1999 TXN Texas Instruments (NAS: TXN) 125.7 78,546 $ 164.22 150,744 3.2%
1999 VIAV Viavi Solutions (NAS: VIAV) 830.1 57,447 $ 15.29 3,501 -12.5%
2000 Applied Micro Circuits (Macom) 135.9 22,188
2000 Brocade Communication (AVGO) 107.5 20,560
2000 CHKP Check Point Software (NAS: CHKP) 168.8 40,588 $ 126.42 17,724 -4.1%
2000 CIEN Ciena (NYS: CIEN) 182.6 23,281 $ 51.45 7,952 -5.2%
2000 JNPR Juniper Networks (NYS: JNPR) 122.5 40,032 $ 23.58 7,775 -7.9%
2003 DELL Dell EMC 110.4 31,198 $ 74.07 55,081 3.4%
2003 INTC Intel (NAS: INTC) 105.8 207,908 $ 51.10 209,408 0.0%
2003 ETR:SAP SAP (ETR: SAP) 110.9 52,891 $ 129.74 154,860 6.5%
2004 AAPL Apple (NAS: AAPL) 201.4 26,053 $ 126.60 2,129,825 31.7%
2005 AAPL Apple (NAS: AAPL) 123.3 60,587 $ 126.60 2,129,825 26.8%
2007 AAPL Apple (NAS: AAPL) 133.5 174,039 $ 126.60 2,129,825 21.2%
2007 TSE:BB Blackberry (TSE: BB) 166.8 63,765 $ 6.72 3,776 -19.5%
2009 AAPL Apple (NAS: AAPL) 146.9 190,983 $ 126.60 2,129,825 24.5%
2009 GLW Corning (NYS: GLW) 102.6 29,988 $ 36.90 28,192 -0.6%
2009 INFY Infosys (NSE: INFY) 137.6 31,931 $ 17.47 74,133 8.0%
2009 WIT Wipro (BOM: 507685) 187.3 21,409 $ 6.07 31,546 3.6%
2010 VMW VMware (NYS: VMW) 109.8 36,844 $ 139.39 58,513 4.7%
2013 MU Micron Technology (NAS: MU) 243.1 22,999 $ 77.11 86,125 20.8%
2013 NYS:NOK Nokia (HEL: NOKIA) 106.5 30,097 $ 4.04 22,146 -4.3%
2016 NVDA Nvidia (NAS: NVDA) 223.9 57,533 $ 504.58 312,335 52.6%
2019 AMD Advanced Micro Devices (NAS: AMD) 148.4 53,522 $ 90.33 108,764 103.2%
2019 LRCX Lam Research (NAS: LRCX) 114.7 42,421 $ 496.49 71,499 68.5%
2019 SHOP Shopify (TSE: SHOP) 185.2 45,806 $ 1,085.56 134,701 194.1%
Source: Morningstar. Data as of Jan. 7, 2021Page 14 of 54 We See Exuberance Within Certain U.S. Tech Stocks | 11 January 2021 | See Important Disclosures at the end of this report.
Page 14 of 54 Healthcare Observer | 11 January 2021
Page 14 of 54 Paper Title | 11 January 2021
Page 14 of 54 Healthcare Observer | 11 January 2021
These Types of Massive Moves Are Rare, Except in the Dot-Com Bubble
Page 14 of 54 Paper Title | 11 January 2021
As shown in Exhibit 9, we discovered 42 instances of large moves among U.S. Tech stocks in the 29
Page 14 of 54 years from
Healthcare 1990| 11toJanuary
Observer 2019,2021
as compared with 11 such moves in 2020 alone.
Page 14 of 54 Paper Title | 11 January 2021
If we were to make the argument for a bubble, we would start with the evidence that 11 moves in a
Page 14 of 54 single year
Healthcare is the
Observer | 11 most
Januaryin any
2021 one year since 1999, while the outcomes for most investors that year did
not fare well. Similarly, if we strip out 2009, a year in which the stock market started to broadly recover
from the credit crisis, so that we are excluding both the dot-com bubble and credit crisis, we note only
14 instances of such moves from 2001 to 2019. Thus, a year with 11 such moves is highly unusual, but
then again, 2020 was a highly unusual year for most of us. Nonetheless, we simply don't see such a
massive rotation of capital into U.S. Tech stocks this often.
How Did Investors Fare? So-So, Depending on the Entry Point and Time Frame
After running our search for these massive stock moves, we then brought in current stock prices and
market caps to see where these companies stood today. Were investors wise to pile into these U.S. Tech
growth names when they did? Did the secular growth drivers and/or a compelling narrative actually play
out for investors?
In general, we see several tech titans where the market was absolutely right about the future power of
the company in question. However, if investors bought all these names at the end of each year after
their massive moves, the future returns would have been rather ugly.
As shown in Exhibit 9, we looked at the current market cap of each stock today compared with the
market cap as it exited its year of excellent stock performance. If we use 7% as a hurdle rate or desired
return on equity, we find that only 11 investments out of 42 would have generated excess returns over
time, and only eight investments out of 39 if we strip out stocks that had stellar years in 2019 and thus
don't have a long enough track record to prove whether their excellent performance in 2019 was
warranted or a mirage. Further, only five companies make the cut as Apple counts four (!!) times in our
analysis.
The outperformers are stocks you might expect. One would have been wise to have bought Cisco
Systems in 1995 at a $20.6 billion market cap, even after the stock rose 112% that year. Investors would
have generated a 9.3% average return, even after the firm crashed from a $500 billion-plus market cap
during the dot-com bubble in 1999 and now resides at "only" a $189 billion market cap today. That said,
it would have been a poor bet to have bought Cisco on Dec. 31, 1999, at a $355 billion market cap, so
timing and valuation matters.
Apple counts four different times in our rankings, as investors were wise to buy the stock during the rise
of the iPod in 2004 ($26 billion market cap) and 2005 (doubling again to $60.6 billion), the introduction of
the iPhone in 2007 (doubling to $174 billion), and buying the dip in 2009 after the credit crisis (doubling
off of a bottom, back up to $191 billion). This all compares with Apple's $2.2 trillion market cap today.Page 15 of 54 We See Exuberance Within Certain U.S. Tech Stocks | 11 January 2021 | See Important Disclosures at the end of this report.
Page 15 of 54 Healthcare Observer | 11 January 2021
Page 15 of 54 Paper Title | 11 January 2021
Page 15 of 54 Healthcare Observer | 11 January 2021
Microsoft in 1998 ($348 billion market cap) was another stock worth riding out through the dot-com
Page 15 of 54 Paper Title | 11 January 2021
bubble with a 7% average annual return over the past 22 years. Micron was worth buying in 2013 at a
Page 15 of 54 $23 billion
Healthcare market
Observer cap as2021
| 11 January the memory chipmaker continues to ride the various industry cycles from tops
to bottoms to tops again (our fair value estimate sits at $50, or $55 billion in equity value). Nvidia's stock
Page 15 of 54 Paper Title | 11 January 2021
tripled in 2016 to $57.5 billion and the move was warranted compared with where our fair value
Page 15 of 54 estimateObserver
Healthcare sits for| 11the stock
January 2021today ($340, or a $210 billion total equity value). Nvidia has doubled again in
2020 to a $323 billion market cap at the end of 2020, but as we'll explain later, we think this move is a
bit unwarranted.
If we extend our search to communications services names, we see strong, warranted performance at
Facebook, Google, and Netflix (particularly in its earlier years), among others. Similarly, using the GICS
code, Amazon was a repeat company with several years of excellent performance.
Finally, we ran a similar screen of how investors fared if they bought these stocks at the beginning of
their massive moves (i.e., on Jan. 1 rather than Dec. 31) and held them until today. Even with the
significant head start of buying a stock that rose 100%-plus in its first year, these investments were still
a 50/50 proposition for investors, with 19 out of 39 exceeding a 7% hurdle rate from the time of
investment until today. Since 2001, some of the more notable laggards were Intel (if acquired at the start
of 2003), BlackBerry, Nokia, and Corning. Of course, this analysis excludes the potential for investors to
exit their positions and reinvest elsewhere, while also excluding the inevitable rise and fall of certain
technologies (such as Nokia flip phones or BlackBerry handsets or PCs with Intel processors).
Summing it up, big bets on the FAANG stocks were the right move for investors (at least as of today).
Also, investors got it right more than they got it wrong in recent years, again betting on FAANG but also
in names like Nvidia and Micron. For most other Tech and Tech-like stocks, the outcomes were not that
great, although again, technology trends may have come and gone over this 30-year time frame.Page 16 of 54 We See Exuberance Within Certain U.S. Tech Stocks | 11 January 2021 | See Important Disclosures at the end of this report.
Page 16 of 54 Healthcare Observer | 11 January 2021
Page 16 of 54 Paper Title | 11 January 2021
Page 16 of 54 Healthcare Observer | 11 January 2021
Exhibit 10 Even When Investing at the Start of the Year With a 100%+ Move, Excess Returns Are Not a Guarantee
Page 16 of 54 Paper Title | 11 January 2021
End of Year Beg of Year
Page 16 of 54 Healthcare Observer | 11 January 2021
Price % Market Cap Market Cap Current Market Cap Beg of Year
Year
Page 16 of 54
Ticker Company Name
Paper Title | 11 January 2021
Change YTD (USD m) (USD m) Stock Price Today (USD m) CAGR
1995 CSCO Cisco Systems (NAS: CSCO) 112.4 20,604 9,701 $ 44.40 187,613 12.1%
1996
Page 16 of 54 INTC Intel (NAS: INTC)
Healthcare Observer | 11 January 2021 130.7 107,505 46,593 $ 51.10 209,408 6.2%
1998 CSCO Cisco Systems (NAS: CSCO) 149.7 146,000 58,465 $ 44.40 187,613 5.2%
1998 DELL Dell EMC 203.2 41,899 13,819 $ 74.07 55,081 6.2%
1998 MSFT Microsoft (NAS: MSFT) 114.6 348,107 162,220 $ 212.25 1,604,715 10.5%
1998 Sun Microsystems 114.7 32,648 15,205
1999 AMAT Applied Materials (NAS: AMAT) 196.8 48,479 16,335 $ 90.83 83,050 7.7%
1999 CSCO Cisco Systems (NAS: CSCO) 130.8 355,123 153,839 $ 44.40 187,613 0.9%
1999 GLW Corning (NYS: GLW) 186.5 31,641 11,043 $ 36.90 28,192 4.4%
1999 DELL Dell EMC 162.6 113,540 43,230 $ 74.07 55,081 1.1%
1999 Gateway 181.6 22,551 8,009
1999 MSI Motorola Solutions (NYS: MSI) 141.2 90,235 37,418 $ 170.68 28,934 -1.2%
1999 Nortel Networks 304.0 139,093 34,429
1999 ORCL Oracle (NYS: ORCL) 289.8 158,096 40,562 $ 62.57 184,208 7.1%
1999 QCOM Qualcomm (NAS: QCOM) 2,618.8 124,739 4,588 $ 151.19 170,996 17.9%
1999 Solectron 104.7 28,189 13,771
1999 Sun Microsystems 261.7 135,281 37,399
1999 TXN Texas Instruments (NAS: TXN) 125.7 78,546 34,803 $ 164.22 150,744 6.9%
1999 VIAV Viavi Solutions (NAS: VIAV) 830.1 57,447 6,177 $ 15.29 3,501 -2.5%
2000 Applied Micro Circuits 135.9 22,188 9,406
2000 Brocade Communication Systems 107.5 20,560 9,909
2000 CHKP Check Point Software Technologies (NAS: CHKP) 168.8 40,588 15,099 $ 126.42 17,724 0.8%
2000 CIEN Ciena (NYS: CIEN) 182.6 23,281 8,238 $ 51.45 7,952 -0.2%
2000 JNPR Juniper Networks (NYS: JNPR) 122.5 40,032 17,995 $ 23.58 7,775 -3.9%
2003 DELL Dell EMC 110.4 31,198 14,827 $ 74.07 55,081 7.6%
2003 INTC Intel (NAS: INTC) 105.8 207,908 101,005 $ 51.10 209,408 4.1%
2003 ETR:SAP SAP (ETR: SAP) 110.9 52,891 25,081 $ 129.74 154,860 10.6%
2004 AAPL Apple (NAS: AAPL) 201.4 26,053 8,645 $ 126.60 2,129,825 38.3%
2005 AAPL Apple (NAS: AAPL) 123.3 60,587 27,137 $ 126.60 2,129,825 31.3%
2007 AAPL Apple (NAS: AAPL) 133.5 174,039 74,544 $ 126.60 2,129,825 27.1%
2007 TSE:BB Blackberry (TSE: BB) 166.8 63,765 23,904 $ 6.72 3,776 -12.3%
2009 AAPL Apple (NAS: AAPL) 146.9 190,983 77,352 $ 126.60 2,129,825 31.8%
2009 GLW Corning (NYS: GLW) 102.6 29,988 14,800 $ 36.90 28,192 5.5%
2009 INFY Infosys (NSE: INFY) 137.6 31,931 13,441 $ 17.47 74,133 15.3%
2009 WIT Wipro (BOM: 507685) 187.3 21,409 7,451 $ 6.07 31,546 12.8%
2010 VMW VMware (NYS: VMW) 109.8 36,844 17,562 $ 139.39 58,513 11.6%
2013 MU Micron Technology (NAS: MU) 243.1 22,999 6,704 $ 77.11 86,125 37.6%
2013 NYS:NOK Nokia (HEL: NOKIA) 106.5 30,097 14,577 $ 4.04 22,146 5.4%
2016 NVDA Nvidia (NAS: NVDA) 223.9 57,533 17,765 $ 504.58 312,335 77.4%
2019 AMD Advanced Micro Devices (NAS: AMD) 148.4 53,522 21,544 $ 90.33 108,764 124.7%
2019 LRCX Lam Research (NAS: LRCX) 114.7 42,421 19,756 $ 496.49 71,499 90.2%
2019 SHOP Shopify (TSE: SHOP) 185.2 45,806 16,064 $ 1,085.56 134,701 189.6%
Source: Morningstar. Data as of Jan. 7, 2021Page 17 of 54 We See Exuberance Within Certain U.S. Tech Stocks | 11 January 2021 | See Important Disclosures at the end of this report.
Page 17 of 54 Healthcare Observer | 11 January 2021
Page 17 of 54 Paper Title | 11 January 2021
Page 17 of 54 Healthcare Observer | 11 January 2021
After Many of These Moves, Especially in 1999, Investors Were Either Early or Wrong, Which Is
Page 17 of 54 Paper Title | 11 January 2021
Pretty Much the Same Thing
Page 17 of 54 Looking Observer
Healthcare at the |rest of these
11 January 2021 stocks, we're a bit relieved that the market didn't tend to be entirely wrong
with their investment theses. We believe our search captured inactive companies, but few names
Page 17 of 54 Paper Title | 11 January 2021
plummeted from $20 billion-plus all the way to bankruptcy. Nortel is a notable example in Tech, while
Page 17 of 54 Worldcom
Healthcare and| Pegasus
Observer Wireless
11 January 2021 landed on the list when including Communications Services.
Predictably, most of the failures occurred in 1999 and 2000 during the dot-com bubble where valuations
were not supported by underlying fundamentals. In certain cases, these stocks made for poor
investments, either in business quality (Gateway or Nortel Networks) or in timing (buying Cisco at its
peak).
However, in several cases during the dot-com bubble, investors made the right bets on high-quality
companies but simply paid quite a bit too much for these stocks and quite a bit earlier than when
fundamentals emerged to support these valuations. We see high-quality, wide- and narrow-moat names
on the 1999 list, such as Applied Materials, Oracle, Qualcomm, and Texas Instruments. These businesses
are worth more today than in 1999, and we would characterize each of them as a strong company with
the ability to generate healthy free cash flow. Average annual returns over the past 21 years would not
exceed a 7% hurdle rate, though, and investors would have been better off investing elsewhere.
However, the averages here might not be meaningful. Investors in these stocks in 1999 likely saw a
massive fall after the dot-com bubble and would have to wait nearly two decades for stock price
appreciation thereafter in order to justify any sort of investment returns at all.
As we look at the 11 high fliers within U.S. Tech in 2020, our best bet is that this same dynamic may play
out. We may eventually find a time where the fundamentals of Zoom, for example, support a $100
billion-plus market cap, or Shopify at $130 billion-plus. However, this timeline might be too far out on the
horizon to warrant an investment today based on current stock prices.Page 18 of 54 We See Exuberance Within Certain U.S. Tech Stocks | 11 January 2021 | See Important Disclosures at the end of this report.
Page 18 of 54 Healthcare Observer | 11 January 2021
Page 18 of 54 Paper Title | 11 January 2021
Page 18 of 54 Healthcare Observer | 11 January 2021
Where Does Tech Go From Here?
Page 18 of 54 Paper Title | 11 January 2021
Looking at our entire U.S. Technology coverage, the median price/fair value estimate ratio sits at 1.18 as
Page 18 of 54 of Dec. 30.
Healthcare This| 11is January
Observer certainly
2021 a pricey ratio and one of the highest we've seen since 2007, and it implies
that U.S. Tech is broadly overvalued. We'd welcome a correction in Tech stocks in order to provide
Page 18 of 54 Paper Title | 11 January 2021
investors with some potential buying opportunities.
Page 18 of 54 Healthcare Observer | 11 January 2021
Exhibit 11 The Median Price-to-Fair Value in Technology Sits at 1.18 as of Dec. 30, One of the Highest Ratios Since
2007
Source: Morningstar. Data as of Dec. 30, 2020
Since we believe that the median U.S. Tech stock is nearly 20% overvalued, we wouldn't be surprised at
all if valuations were to pull back a bit at some point in time. As discussed, we think Tech provided some
relative safety to investors during the turbulence of the COVID-19 pandemic, while also providing
attractive growth opportunities in other areas thanks to the shift to remote working and IT upgrades.
However, as the world hopefully recovers from COVID-19 in 2021 and vaccines roll out, it is possible that
beaten up sectors (hospitality, airlines, etc.) could begin to recover as well, perhaps pulling investment
dollars out of Tech and remote working names.
In a way, our Tech coverage appears to have fallen into two categories, almost similar to Consumer
Staples and Consumer Discretionary. In Tech, we have a basket of our coverage (again, skewing larger
cap and moaty) that is expensive but has fundamental earnings and well-established technological
trends in its favor. In the second bucket, we have at least 11 stocks that have skyrocketed in 2020, most
of which are well above our fundamental valuations. The former grouping doesn't appear prone to a
massive destruction in value, similar to the dot-com bubble in 2000. The latter grouping might be,
though.Page 19 of 54 We See Exuberance Within Certain U.S. Tech Stocks | 11 January 2021 | See Important Disclosures at the end of this report.
Page 19 of 54 Healthcare Observer | 11 January 2021
Page 19 of 54 Paper Title | 11 January 2021
Page 19 of 54 Healthcare Observer | 11 January 2021
Again, it has been over 20 years since we've seen so many Tech stocks receive such large infusions of
Page 19 of 54 Paper Title | 11 January 2021
investor dollars in a single year, and this last instance was in the middle of the dot-com bubble. Looking
Page 19 of 54 deeper, Observer
Healthcare four of| these 112021
11 January stocks with a $20 billion-plus market cap have tripled in 2020, more than the
number of stocks tripling or more in the past 20 years combined. Further, looking at these stocks on a
Page 19 of 54 Paper Title | 11 January 2021
fundamental basis, nine of the 11 stocks we identified are at least 30% overvalued as of the end of 2020.
Page 19 of 54 We'd welcome
Healthcare Observer | a
11correction
January 2021 broadly, but for most of these high fliers, a significant pullback wouldn't be
surprising.
Software Multiples Are on the High Side
As we think about U.S. Technology valuations, software is the sub-sector where we see greater warning
signs. The median price to fair value estimate ratio for software stocks under our U.S. Tech coverage sits
at 1.24 as of Dec. 31, while the mean ratio sits at 1.30. These ratios indicate to us that, again, the sector
is quite expensive but also not expensive enough to indicate that all software companies are doomed to
crash by 60% or so.
Looking at the software sector on a price to sales basis, we see this dichotomy a bit more clearly. We ran
a screen of U.S. and Canadian software stocks with a market cap in excess of $1 billion, which came up
with 226 names (versus the 58 software names under our equity research coverage). As shown in Exhibit
12, multiples are at all-time highs.
Exhibit 12 Software Price/Sales Multiples Are Also Alarming, as the Richest Multiples in 2017 Are Lower Than the Mean in 2020
Source: Morningstar. Data as of Jan. 5, 2021Page 20 of 54 We See Exuberance Within Certain U.S. Tech Stocks | 11 January 2021 | See Important Disclosures at the end of this report.
Page 20 of 54 Healthcare Observer | 11 January 2021
Page 20 of 54 Paper Title | 11 January 2021
Page 20 of 54 Healthcare Observer | 11 January 2021
Looking at Exhibit 12, we note that the average P/S multiple for our software list (red line) is 13.1 times
Page 20 of 54 Paper Title | 11 January 2021
as of December 2020. This multiple is greater than the multiples for stocks within the 25th percentile
Page 20 of 54 (light blue)
Healthcare and| 11
Observer even the2021
January 10th percentile (green) of the richest software stocks we saw in 2017. The
median P/S multiple (dark blue) is about 8.6 times today, which is comparable with stocks within the
Page 20 of 54 Paper Title | 11 January 2021
25th percentile as recently as a few years ago and in line with the P/S multiple for the top 10% of stocks
Page 20 of 54 in the early
Healthcare 2010s.
Observer | 11 January 2021
Further, we note the massive spike in the P/S multiple of stocks within the top decile. This decile
includes several names we noted, such as Shopify, Coupa, Okta, Zscaler, Palantir, and DocuSign, along
with some stocks outside of our coverage today like Cloudflare, DataDog, and Fasty.
On a fundamental basis, perhaps greater optimism is warranted given the COVID-19 pandemic and the
rise of remote working, which has perhaps driven the need for greater software spending. Also, perhaps
the understanding of SaaS economics has improved, as investors realized that the massive sales and
marketing expenses incurred by unprofitable firms are likely leading to sticky implementations and
successful "land and expand" strategies at leading software makers. However, we would argue that the
rise in multiples may suggest that even successful software makers might fail to generate enough free
cash flow in the future to justify such rich multiples today.
If we look at just this top decile of software stocks in Exhibit 12, then the multiple expansion appears to
be overdone versus historical levels. Ignoring any macroeconomic considerations for the moment,
perhaps this is the basket of stocks mostly likely to have its bubble "burst."
If we look at the median multiple today (dark blue), valuations appear rich but not outlandish, so a
pullback might be reasonable to us but a doomsday scenario for the entire software sector seems a bit
unlikely to us. Certainly, there are dreadful scenarios where we could be wrong. We're making no
predictions on Central Banking policies. The COVID-19 pandemic could worsen before it improves. It's
possible that U.S. corporate tax rates and overall interest rates might only rise from here. It's not entirely
clear whether U.S.-China trade tensions become resolved or worsen in the months and years ahead, but
a further deterioration might be possible. Thus, we concede that U.S. Tech might not merely face a
correction, but something a bit worse, although this is not our base-case scenario across our sector.You can also read