Weapons of Gas Destruction - Lifting the lid on greenhouse gas emissions from Australian fossil gas projects and resources - The Australia Institute
←
→
Page content transcription
If your browser does not render page correctly, please read the page content below
Weapons of
Gas Destruction
Lifting the lid on greenhouse gas
emissions from Australian
fossil gas projects and resources

Research report
Tom Swann
Weapons of
gas destruction
Lifting the lid on greenhouse gas
emissions from Australian fossil gas
projects and resources
      Fossil gas projects proposed in Australia represent an
       annual climate impact more than half of Australia’s
        annual emissions. Australia’s already identified gas
    resources, if burned, would have a climate impact larger
       than annual emissions from any country. Yet further
        resources pursued by governments and companies
       represent a climate impact larger than annual world
    emissions, taking up 28% of a 1.5°C carbon budget, or 8%
     of a 2°C budget. Such gas expansion is inconsistent with
                      solving climate change.

Discussion paper

Tom Swann
September 2020

Commissioned by the Australian Conservation Foundation.
ABOUT THE AUSTRALIA INSTITUTE The Australia Institute is an independent public policy think tank based in Canberra. It is funded by donations from philanthropic trusts and individuals and commissioned research. We barrack for ideas, not political parties or candidates. Since its launch in 1994, the Institute has carried out highly influential research on a broad range of economic, social and environmental issues. OUR PHILOSOPHY As we begin the 21st century, new dilemmas confront our society and our planet. Unprecedented levels of consumption co-exist with extreme poverty. Through new technology we are more connected than we have ever been, yet civic engagement is declining. Environmental neglect continues despite heightened ecological awareness. A better balance is urgently needed. The Australia Institute’s directors, staff and supporters represent a broad range of views and priorities. What unites us is a belief that through a combination of research and creativity we can promote new solutions and ways of thinking. OUR PURPOSE – ‘RESEARCH THAT MATTERS’ The Institute publishes research that contributes to a more just, sustainable and peaceful society. Our goal is to gather, interpret and communicate evidence in order to both diagnose the problems we face and propose new solutions to tackle them. The Institute is wholly independent and not affiliated with any other organisation. Donations to its Research Fund are tax deductible for the donor. Anyone wishing to donate can do so via the website at https://www.tai.org.au or by calling the Institute on 02 6130 0530. Our secure and user-friendly website allows donors to make either one-off or regular monthly donations and we encourage everyone who can to donate in this way as it assists our research in the most significant manner. Level 1, Endeavour House, 1 Franklin St Canberra, ACT 2601 Tel: (02) 61300530 Email: mail@tai.org.au Website: www.tai.org.au ISSN: 1836-9014
Summary
The fossil gas industry in Australia tripled production from 1990 to 2010 and then from
2010 to 2019 production tripled again. Nearly all of the new production was exported.
Australia has become the world’s largest exporter of liquified natural gas (LNG) and
one of the world’s biggest gas producers. Australia’s gas and coal exports make
Australia’s the third largest exporter of fossil fuels in the world, after Russia and Saudi
Arabia.

Over the decade to 2018 Australia was responsible for most of the growth in LNG, and
a third of the growth over the last 20 years, more than any other country Australia’s
share of global gas production soared in recent years, even as its share of global
proven gas reserves levelled out.

Australian Government publications list 22 new gas production and export proposals
across Australia with an estimated gas production capacity of 3,368 PJ pa. Goverments
and companies are preparing to exploit further gas resources in the ground that are
larger still.

Despite calls for decarbonisation be central to the economic recovery from the
coronavirus pandemic, the Australia government is proposing policies and subsidies for
what it calls a “gas fired recovery”. From an economic and employment perspective,
this makes little sense. There are many low cost ways to reduce gas consumption, and
the industry, despite its size, employs few Australians. Expanding fossil gas production
also threatens to release large amounts of greenhouse gases.

Burning fossil gas releases carbon dioxide (CO2). In addition, extracting, processing
transporting and exporting fossil gas is also highly emissions intensive, and already
responsible for more than 10% of current Australian emissions, on official government
data. A large portion of these emissions come from gas burned by LNG facilities.
Australian LNG facilities burn around nine percent of all gas they receive to help liquify
the remaining gas for export. Gas consumption in LNG facilities is double the size of
whats consumed by Australian households and about as large as what is consumed by
Australian manufacturing.

Another major climate impact is ‘fugitive’ emissions from flaring, venting and leakage.
The true impact of these emissions is larger than officially reported. Fossil gas is made
up mostly of methane, itself a greenhouse gas with much greater heat trapping
potential than CO2. While methane is more powerful than CO2 over a 100 year
timeframe, which is the conventional basis for comparison, methane traps far more
heat over the nearer-term (a 20 years horizon). A small amount of methane loss
greatly increases the climate impact of fossil gas.

Many recent studies show rates of methane loss much higher than the Australian
government’s official figures, especially in unconventional gas production, such as coal
seam and shale gas where techniques like hydraulic fracturing are required. Methane
loss at rates observed in recent studies of large US shale gas fields range from 2.3% to
3.7%, at the higher end delivering a near-term climate impact equivalent to doubling
the emissions of the burnt gas. Reducing and avoiding the release of methane
emissions is essential to meeting the Paris Agreement climate goals.

There are 22 major new gas projects proposed by companies and listed by the
Australian Government’s Office of the Chief Economist. The analysis here converts the
supply capacity into common units for comparison and aggregation. The proposed
projects are spread across the country and are of various sizes, types and stages. The
largest projects are offshore fields designed for gas export, especially off Western
Australia’s coast. The single largest project, Woodside’s Browse / Burrup Hub
Extension, would involve piping gas from a large new gas field nearly 1000km through
new undersea pipelines to an onshore facility for export.

In addition to the major projects, the report examines proposed unconventional
(shale) gas production in the Beetaloo Basin in the Northern Territory and the Canning
Basin in Western Australia. Official inquiries into the ‘fracking’ necessary to tap into
these unconventional fields also explored the potential greenhouse gases involved
based on production scenarios. The WA Inquiry used scenarios for the Canning Basin
up to 402 PJ pa as “realistic for coming decades”. The NT inquiry found that up to
1,240 PJ pa was “reasonable for risk assessment purposes”. Government documents
show officials are concerned such projects would threaten Australia’s ability to meet
commitments under the Paris Agreement.

The combined supply potential of these major projects with the Beetaloo and Canning
Basins is 5,010 petajoules per annum (PJ pa). This is larger than current Australian gas
exports and almost equal to Australia’s current total gas production.

Beyond the pipeline of new gas projects, Australia has a lot more gas in the ground,
that governments and the gas industry promote for extraction and use. These includes
resources already ‘identified’ and those that are ‘prospective’ and subject to
exploration.

The analysis here compiles data presented by the Commonwealth agency Geoscience
Australia, drawn from from a range of studies. This data shows total ‘identified
resources’ are 273,000 PJ, five times larger than the 65,000 PJ of gas extracted to date
in Australia. Within the identified resources deemed economic to extract (as at 2018),
it was still twice as large as total historical extraction in Australia.
Yet resources that are ‘prospective and potentially recoverable’ are larger still. While
assessments are varied and uncertain, using the average for each basin produces an
estimated prospective gas resource of around 1 million PJ. The maximum and
minimum estimates are between 0.5-2 million PJ. These are overwhelmingly
unconventional shale gas. The largest by far is the Canning Basin in WA, although
another four are also larger than all of Australia’s gas production to date.
The report estimates the emissions potential of the flow of gas from proposed new
projects, and from the gas in the ground as identified and prospective gas resources.
The combustion emissions potential of identified gas resources in Australia are 13
times larger than current annual Australian emissions, and larger than annual
emissions from any country, including the USA and China. Even the project pipeline
tapping into gas reserves, assessed in 2018, are larger than annual US emissions.
Figure: Australian gas resources vs world emissions
160
140
Estimates for unconventional basins
Emission
120 s
100 Max
Gt CO2e
80 Average
60
Min
40
20
-
Australia USA China World - World - Reserves Total Identified
fossil fuels total identified and
prospective
Annual emissions Australian gas resources
Combustion emissions potential from prospective resources is staggeringly large,
almost three years of annual fossil fuel emissions from the entire world, and one year
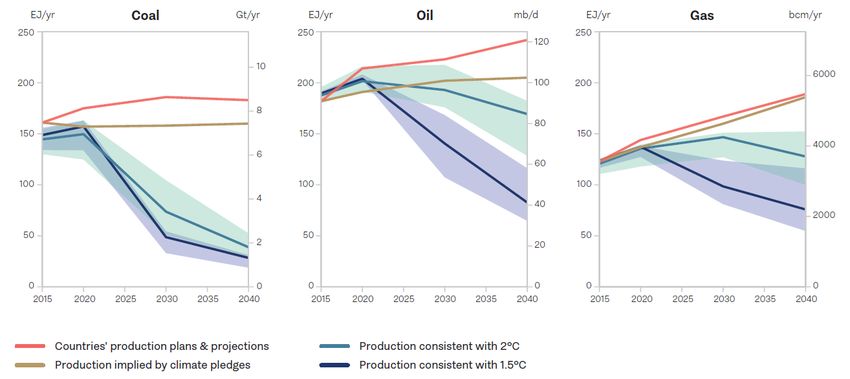
and eight months of global emissions from all sources.At the higher end, Australia’s potential carbon footprint from prospective fossil gas resources is equal to around three times the annual emissions from the entire world. Even on the minimum estimate, Australian gas resources represent greater CO2 potential than annual world emissions. The gas resources can also be compared to historical emissions from largest corporate polluters in human history. Total identified gas resources represent larger emissions potential than total fossil fuel emissions over 1988-2015 from Rio Tinto, BHP or Chevron. Identified and prospective gas resources have an emissions potential more than double the fossil emissions of Chevron, Exxon, BHP and Rio Tinto put together. They are larger than emissions from Saudi Aramco and Russia’s Gazprom put together. For a two in three chance of staying below the Paris Agreement goals, combustion emissions from total identified Australian gas resources would take up 5% of the global carbon budget for 1.5°C of warming, or 1.4% of the budget for 2°C. Including prospective resources, Australian gas resources represent 28% of the 1.5°C carbon budget, or 8% of the 2°C budget. Despite the emissions from fossil gas, the industry and its supporters often claim gas reduces emissions. Such claims are generally made without evidence and do not withstand scrutiny. Gas can increase emissions by simply adding to coal use or displacing clean energy, which is likely in the absence of strong climate policies and even more likely when gas is being subsidised. Energy system modelling from the International Energy Agency shows how to achieve global economic growth, modern energy access and success under climate goals. This requires gas production to stop growing and decline out to 2040. Similarly, the Australian Energy Market Operator’s recent Integrated System Plan (AEMO ISP) shows the lowest cost pathways for the National Electricity Market involves a very large and ongoing increase in renewable energy and much less power from gas. Most of the world’s gas reserves, and most of Australia’s, must stay in the ground to meet agreed climate goals. Despite this, governments and companies pursue new projects and development of even greater resources. The scale of potential emissions should be a concern for Australians and for international observers. Australia can either gas fire its recovery from the pandemic and exacerbate global warming, or keep the gas in the ground and support investment in a safer future.
Contents
Summary ........................................................................................................................... 3
Contents ........................................................................................................................... 7
Introduction ...................................................................................................................... 1
   Outline .......................................................................................................................... 2
How fossil gas causes climate change .............................................................................. 4
   Fugitive emissions......................................................................................................... 5
   Methane loss ................................................................................................................ 6
   Global warming potential ............................................................................................. 8
   Combined climate impact............................................................................................. 9
Fossil gas in Australia ...................................................................................................... 11
   Expanding production ................................................................................................ 11
   LNG expansion ............................................................................................................ 14
   Australian reserves ..................................................................................................... 15
New gas production projects.......................................................................................... 17
   Proposed Major Projects ............................................................................................ 17
       Total new supply capacity ...................................................................................... 20
   Shale gas frontiers ...................................................................................................... 21
       Beetaloo Basin in NT ............................................................................................... 22
       Canning Basin in WA ............................................................................................... 23
   Total Proposed New Gas Capacity.............................................................................. 24
Emissions potential of Australian fossil gas resources ................................................... 26
   Reserves and Contingent Resources .......................................................................... 27
   Prospective Resources ................................................................................................ 28
   Total resources ........................................................................................................... 32
Estimating emissions ...................................................................................................... 35
   Approach .................................................................................................................... 35
   Proposed projects....................................................................................................... 36
   Reserves and resources .............................................................................................. 38
vs annual emissions of countries............................................................................ 38
vs carbon majors historical emissions .................................................................... 40
vs carbon budget .................................................................................................... 42
More gas means more emissions ................................................................................... 44
Displacing clean energy .............................................................................................. 44
Transition away from gas ........................................................................................... 46
Conclusion ...................................................................................................................... 50
Appendix – energy and emissions factors ...................................................................... 51Introduction
Gas is a fossil fuel. Extracting and burning fossil gas releases heat trapping gases that cause
climate change. Gas has been a major source of growing greenhouse gas emissions globally
and in Australia.
Fossil gas is used mainly to generate electricity and to produce heat in homes and factories.
All of these applications have readily available, economic alternatives that enable
elimination of gas consumption, or large reductions. A small share of fossil gas production is
used as a feedstock for chemicals.
Over the last decade Australia has become the world’s largest exporter of liquified natural
gas (LNG) and one of the world’s largest producers of fossil gas. On top of the emissions
from burning the gas overseas, gas expansion has pushed up Australia’s emissions, due both
to gas burned in exporting gas and direct release of emissions into the atmosphere. Despite
its large scale and emissions, Australia’s gas industry employs a very small proportion of the
workforce, around one in 500 jobs. 1
The coronavirus pandemic has thrown global energy markets into chaos. Low gas prices
have seen major gas projects delayed and assets written down. Yet despite the gas glut, and
the jobs-poor nature of the gas industry, the Australian government is planning what it calls
a ‘gas fired recovery’. Instead of creating jobs by reducing gas use and switching to
renewable electricity, the government is seeking to expand the gas industry.
The Prime Minister established a National COVID-19 Commission, chaired by a gas company
director, who appointed a former petrochemical executive and current director of Saudi
Aramco, the world’s largest oil company, to advise on economic recovery. Not surprisingly,
the Commission has told the government it should support the expansion of the gas
industry. The Commission’s leaked report recommends huge subsidies to gas production,
provision of infrastructure, and cuts to environmental protections.
The Commission’s gas advocacy stands alongside other policies and proposals that support
gas expansion. The government’s Underwriting New Generation Investments program
(UNGI) is pursuing government support for new gas fired power, despite having no legal
basis or program guidelines. 2 The government’s review into the Emissions Reduction Fund,
headed by a gas industry executive and initially kept secret, recommended expanding that
scheme to pay facilities, presumably including gas facilities, to emit less. The government is
seeking to remake the successful Clean Energy Finance Corporation, turning it from a body
1
Ogge & Swann (2020) Gas Fired Backfire, https://www.tai.org.au/content/gas-fired-backfire
2
Swann & Merzian (2020) Problems with UNGI, https://www.tai.org.au/content/problems-ungi
Weapon of Gas Destruction 1that produces a profit for the taxpayer by investing in clean energy, into a body that makes a loss funding projects like gas power stations. As global temperatures rise, climate disruption will cause increasing harm to health, life, ecosystems and the economy. Increasing the extraction of fossil fuel will increase emissions, climate disruption and related harms. These harms can be limited only by sustained effort to drive emissions down. The future of Australia’s gas industry is difficult to predict. It will depend on a wide range of factors, including, crucially, government policies. Governments could subsidise gas expansion, locking in increased gas supply and consumption, or they could accelerate the shift to clean energy and lower gas consumption. While many governments, multilateral bodies and corporations are calling for coronavirus recovery plans that tackle the climate crisis at the same time, the Australian Government is preparing to do the opposite. It is essential that plans for gas expansion are scrutinised in terms both of economics and emissions. This report assesses the emissions that would be released by currently proposed gas projects in Australia and the much larger resources that companies and Australian governments are seeking to exploit. OUTLINE This report begins by outlining the many sources of greenhouse gas emissions from fossil gas, from extraction to processing to tranport to burning it at the point of consumption. Burning gas produces CO2. In addition, methane leakage greatly increases the climate impacts from fossil gas. The report then outlines trends in Australian gas production and export, showing the rapid increase in gas production has gone entirely to exports, including the large amount of gas burned in preparing gas for export as liquified natural gas (LNG). Australia’s increased exports have been a significant factor behind increased global gas use. The next section considers new gas supply projects that are currently proposed around Australia. While the analysis focuses on major projects proposed by companies, as listed by the Commonwealth Government, it also includes government proposals for major development of unconventional (shale) gas frontiers. The aggregate proposed gas supply is larger than current Australian exports. Governments and the gas industry talk about extracting and burning some, if not all of the large volumes of gas from the frontier basins. So the report considers Australian gas resources – both ‘identified’ and ‘prospective’ – compiled from data released by the Commonwealth agency Geoscience Australia. Aggregated, these represent a staggering volume of gas, and therefore a comparably staggering volume of greenhouse gas emissions. Weapon of Gas Destruction 2
The report assesses emissions associated with proposed gas projects and Australian gas
resources. Annual combustion emissions from proposed new gas projects would be more
than half of Australia’s annual emissions. In the worst case scenario of methane leakage
considered here, the emissions potential over coming decades would be almost as large as
Australia’s annual emissions. Identified Australian gas resources represent potential
combustion emissions larger than global annual emissions. The prospective resources are
larger than the historical emissions of any major oil and gas company.

Finally the report critiques gas industry arguments that gas expansion is needed to reduce
emissions. Evidence from a range of sources shows why claims that gas is a ‘transition fuel’,
is needed to back up renewables, is needed for industry and displaces coal, simply do not
stack up. In a decarbonising world, the role for gas is one that shrinks, not grows.

   Weapon of Gas Destruction                                                                3
How fossil gas causes climate change
Fossil gas is a fuel extracted from underground reservoirs, transported and burned as an
energy source. It is primarily methane (CH4).

Gas extracted from geological reservoirs is often called ‘natural gas’, to contrast it from
‘town gas’, or ‘synthetic gas’, gaseous fuels converted from coal, oil or other feedstocks.
The term ‘natural’ gas also contrasts with ‘biogas’ derived from biological processes. The gas
industry uses ‘natural gas’ as part of marketing designed to make it seem environmentally
friendly. The term ‘fossil gas’ is more descriptive and accurate.

Fossil gas is a major cause of climate change. The expansion of the fossil gas industry
threatens higher global temperatures, more climate disruption and and damaging climate
impacts. Decisions made now will determine whether that trend continues.

Like all fossil fuels, burning fossil gas produces carbon dioxide (CO2), the greenhouse gas
that is the main source of human-caused climate change. Fossil gas is burned in power
generators, industrial facilities and residences in Australia and globally. All of this produces
greenhouse gas emissions. However, the fossil gas industry also emits heat-trapping
greenhouse gases in many other ways.

Drilling, extracting, processing, compressing and pumping gas through pipes are all very
energy intensive activities. This energy is generally powered by using fossil fuels, primarily
burning fossil gas or from the electricity grid, which in Australia is still mostly coal and gas
power.

One of the largest gas consumers in Australia is the gas export industry itself. Exporting
fossil gas as ‘liquified natural gas’ (LNG) requires compression and super-cooling, processes
that are generally powered by burning large amounts of gas. The LNG export facilities in
Australia use around 9% of the gas inflows to those facilities just in the process of preparing
gas for export. 3 This is more than double the amount of gas used by Australian households
and almost as much as used by manufacturing. Gas is also combusted in LNG shipping and
regassification.

The fossil gas industry also releases greenhouse gases directly into the atmosphere through
venting, flaring and leakage, known as fugitive emissions.

3
    Department of Industry, Science, Energy and Resources (2019) Australian Energy Update 2019,
    https://www.energy.gov.au/publications/australian-energy-update-2019

      Weapon of Gas Destruction                                                                    4
FUGITIVE EMISSIONS
Fossil gas reservoirs contain impurities, including CO2. These are removed in gas processing
and generally vented into the atmosphere. Methane is itself a powerful greenhouse gas and
is released into the atmosphere during all stages of the supply chain, from exploration, to
production, transport, distribution and in appliances that use gas. Some major releases are
involuntary or unplanned, while some are vented intentionally. Because methane is highly
flammable, instead of releasing it directly it is sometimes first flared or burned, mostly
turning it into CO2. Some methane is also released in flaring.
Emissions from all of these sources are reported by the Australian government. This data
shows gas has become a major source of increased emissions in Australia. Figure 1 shows
combustion and fugitive emissions in the gas industry, both reported historical emissions
and projections for the coming decade.
Figure 1: Aust govt data shows gas expansion is pushing up Australia's emissions
60 projection ->
Fugitive emissions
LNG
50
Domestic gas (ex LNG)
40
Emissions (Mt CO2e)
Historical (all gas)
30 Domestic gas extraction,
distribution
Historical (oil, gas extraction)
20
Other (oil, gas extraction)
10 LNG
Combustion emissions
0
Source: Department of Environment and Energy (2019) Australia’s emissions projections 2019,
https://publications.industry.gov.au/publications/climate-
change/system/files/resources/4aa/australias-emissions-projections-2019-report.pdf Figure 8, Figure
10
Figure 1 shows that according to Australian Government data, direct combustion and
fugitive emissions from the fossil gas industry together make up around 50 million tonnes
per year of CO2 equivalent emissions, approximately 10% of Australia’s total greenhouse
gas emissions at present and projected for the coming decade.
Weapon of Gas Destruction 5It is likely that the reported emissions figures understate the impact of the gas industry on
the climate. Methane emissions from fossil gas have been measured at rates far higher than
officially reported by governments. This is concerning, as methane is a powerful greenhouse
gas: compared with CO2 on a per mass basis, methane traps substantially more heat. How
much methane is released into the atmosphere is a major factor in how much climate
change the fossil gas industry causes. Moreover, official reported emissions overlook fact
that methane is an especially potent heat trapping gas over shorter time frames.
METHANE LOSS
There is an extensive research literature using a range of methods to assess rates of
methane emissions from gas facilities, in particular from unconventional gas production
involving hydraulic fracturing. Many studies have shown rates of methane emissions far
higher than set out in official national emission inventories. This is a problem because a
relatively small increase in methane emissions can dramatically increase the emissions
footprint of fossil gas.
In 2016, researchers from Melbourne University’s Energy Institute compared reported
Australian methane emissions from unconventional gas with international studies. 4 The
report showed that Australian reported emissions from methane ‘loss’ is equivalent to 0.5%
of gross production, based on ‘factors’ derived from the US, not from Australian
measurements. The report also noted methane loss at US shale gas sites had been
measured higher than 2% and in extreme cases up to 17%.
There have been subsequent adjustments to Australian emissions factors. Nonetheless,
current Australian reported emissions data suggests at most a small increase to reported
methane loss rates, to around 0.7%. 5
By comparison, the International Energy Agency (IEA) draws attention to rates of methane
loss as a major concern, estimating methane loss as 1.7% of production across the global
4
Lafleur, Forcey, Saddler, & Sandiford (2016) A review of current and future methane emissions from
Australian Unconventional oil and gas production,
https://energy.unimelb.edu.au/__data/assets/pdf_file/0019/2136223/MEI-Review-of-Methane-Emissions-
26-October-2016.pdf
5
The estimate here compares methane emissions from natural gas, venting and flaring, by total gas
production. Figures for venting and flaring are not provided for gas separately, only for oil and gas.
Nonetheless, most production is gas. Attributing all venting and flaring methane to gas production, the loss
rate over the decade is around 0.7% in the decade to 2018. This is checked by calculating the increase of
fugitives against increase in gas consumption over this time, which is also 0.7%.
Department of Industry, Science, Energy and Resources (2020) AEGIS - National Greenhouse Gas Inventory –
UNFCCC classifications, https://ageis.climatechange.gov.au/, Department of Industry, Science, Energy and
Resources (2019) Australian Energy Update 2019
Weapon of Gas Destruction 6supply chain.6 While the IEA does not present estimates for methane loss variation, the IEA
average and broader research literature raises concerns about under reporting of emissions
loss.
The Australian Government addresses concerns about fugitive emissions from fossil gas in
the 2018 National Inventory Report (NIR), submitted for international scrutiny under UN
climate treaties. The Australian approach, it reassures, is “anchored” in the approach by US
Environmental Protection Agency (EPA). As a result, Australian reported fugitive emissions,
CO2 and CH4 together, “are within 15–20 per cent of the estimate for the United States”. At
the same time, the NIR also claims the US EPA report methane emissions equivalent to loss
rates of 1.3%, higher than reported for Australia. This discrepancy is not addressed. While
noting some US studies show higher loss rates, NIR argues “irregular, high emission
outcomes on the part of some wells are outweighing the effects of the vast majority of wells
with negligible emissions in ways that significantly affect the overall emissions profile.” 7
The comments fail to address the substantial and growing literature showing rising
atmospheric methane is linked to petroleum.
There are in fact many studies using a range of research methods showing higher methane
emissions across large areas, especially associated with US shale gas production:
“Methane emissions from the U.S. oil and natural gas supply chain were estimated by
using ground-based, facility-scale measurements and validated with aircraft
observations in areas accounting for ~30% of U.S. gas production. When scaled up
nationally, our facility-based estimate [is] 2.3% of gross U.S. gas production” 8
“The methane in shale gas is somewhat depleted in 13C [a carbon isotope] relative
to conventional natural gas, [from which] we conclude that shale-gas production in
North America over the past decade may have contributed more than half of all of
the increased [methane] emissions from fossil fuels globally… the increase in
methane emissions from shale gas represents 3.5% of the shale-gas production”.9
“Using new satellite observations and atmospheric inverse modeling, we report
methane emissions from the Permian Basin, which is among the world’s most prolific
oil-producing regions and accounts for >30% of total U.S. oil production… [The study
6
International Energy Agency (2017) World Energy Outlook 2017
7
Department of Industry (2020) National Greenhouse Gas Inventory: December 2019, pp. 152–154,
https://www.industry.gov.au/data-and-publications/national-greenhouse-gas-inventory-december-2019
8
Alvarez et al. (2018) Assessment of methane emissions from the U.S. oil and gas supply chain, p. 186,
https://science.sciencemag.org/content/361/6398/186
9
Howarth (2019) Ideas and perspectives: is shale gas a major driver of recent increase in global atmospheric
methane?, https://www.biogeosciences.net/16/3033/2019/
Weapon of Gas Destruction 7found] the largest methane flux ever reported from a U.S. oil/gas-producing region…
This magnitude of emissions is 3.7% of the gross gas extracted in the Permian...” 10
Such loss rates are highly concerning because of the powerful global warming potential of
methane.
GLOBAL WARMING POTENTIAL
To compare the Global Warming Potential (GWP) of different gasses, there needs to be an
exchange rate into a common unit. The Intergovernmental Panel on Climate Change (IPCC)
defines the GWP for methane and other gases in terms of CO2, expressed as CO2-equivalent
(CO2e).
Because different gases breakdown or are removed from the atmosphere at different rates,
the GWPs are defined over a given timeframe. The standard GWP is over 100 years
(GWP100). The IPCC also gives GWP over 20 years (GWP20). The IPCC presents these and
many other metrics for analysis. GWP100 is widely used by governments, including
Australia’s.
The most recent IPCC assessment report on GWPs, in 2014, found that one tonne of
methane is equivalent to 28 tonnes of CO2e over the 100 year horizon. On a 20-year
horizon, one tonne of methane is equivalent to 84 tonnes of CO2e. 11
These GWPs have increased from previous estimates, being based on more recent research.
While the Australian government has recently updated its factor for GWP100, even these
factors are too low, according to best available science. IPCC gives a separate GWP100 for
fossil gas of 30, as opposed to biogenic methane at 28. Later research found fossil methane
is 34 times more powerful, and more recent research including carbon cycle feedbacks
increases the GWP100 to 40. In addition, more recent research finds the methane GWP100
is 41. 12 Using the 28 factor is likely to be a dramatic underestimate of the carbon impact
even over the century horizon.
More important, however, is powerful heat trapping role of methane in the nearer term,
which is ignored by the focus on GWP100. The fact that methane emissions are more than
10
Zhang et al. (2020) Quantifying methane emissions from the largest oil-producing basin in the United States
from space, https://advances.sciencemag.org/content/6/17/eaaz5120
11
Myhre et al. (2013) Anthropogenic and Natural Radiative Forcing, Climate Change 2013: The Physical Science
Basis. Contribution of Working Group I to the Fifth Assessment Report of the Intergovernmental Panel on
Climate Change, https://www.ipcc.ch/site/assets/uploads/2018/02/WG1AR5_Chapter08_FINAL.pdf. p. 731
12
Morton (2020) Methane released in gas production means Australia’s emissions may be 10% higher than
reported, https://www.theguardian.com/environment/2020/aug/26/methane-released-in-gas-production-
means-australias-emissions-may-be-10-higher-than-reported
Weapon of Gas Destruction 8three times more potent as a greenhouse gas over 20 years than they are over 100 years
means there should increase the incentive to reduce methane emissions in the short term.
In other words, early action brings early reward, while increasing methane emissions
increase near term climate feedbacks and tipping points.
COMBINED CLIMATE IMPACT
While burning methane produces CO2, the climate impact from fossil gas can be greatly
increased by methane emissions, even at relatively low rates of methane loss. This effect is
most pronounced when viewed over the 20 year horizon.
Figure 2 shows the combined climate impact for loss rates mentioned above, at GWP100
and at GWP20. Note this uses the IPCC defaults for methane, not fossil methane and not
including carbon cycle feedbacks. It is therefore conservative, based on current science.
Figure 2: Small amounts of methane loss greatly increase climate impacts from fossil gas
7
6
Climate impact of fossil gas
5
(t CO2e / t gas produced)
Methane emissions
(20 year global warming
4 potential)
Methane emissions
3 (100 year global warming
potential)
2 CO2 from combustion
1
0
0% 0.5% 1.3% 1.7% 2.5% 3.7%
Methane loss rate
Source: author analysis from energy content and emission factors, see appendix. Note ‘produced’ is
here as extracted. Losses additional to production increase the climate impact.
At the IEA’s global average methane loss rate, the climate impact of fossil gas over the two
decade horizon is nearly 50% higher than combustion emissions alone.
At 3.7% loss, the climate impact over the century is one third bigger than combustion
emissions, and over the twenty year horizon is double combustion emissions.
Weapon of Gas Destruction 9This shows clearly the importance of measuring and minimising the rate of methane loss at existing facilities. Combined with the combustion emissions potential, it shows why limits on gas expansion are required to limit and reduce emissions. Weapon of Gas Destruction 10
Fossil gas in Australia
This section outlines key trends in Australian gas production, consumption and exports.

EXPANDING PRODUCTION
Fossil gas production in Australia has seen a huge expansion over the last three decades.
Figure 3 below shows total Australian gas production tripled from 1990 to 2010 and then
from 2010 to 2019 it tripled again.

Figure 3: Fossil gas production in Australia

                        180,000

                        160,000

                        140,000                                                                                                                                                         Fossil gas
                                                                                                                                                                                        production
 Gas production (Mcm)

                        120,000

                        100,000

                         80,000

                         60,000
                                                                                                                                                                                        (of which,
                         40,000                                                                                                                                                         coal seam
                                                                                                                                                                                        gas)
                         20,000

                             0
                                  1990-91

                                            1992-93

                                                      1994-95

                                                                1996-97

                                                                          1998-99

                                                                                    2000-01

                                                                                              2002-03

                                                                                                        2004-05

                                                                                                                  2006-07

                                                                                                                            2008-09

                                                                                                                                      2010-11

                                                                                                                                                2012-13

                                                                                                                                                          2014-15

                                                                                                                                                                    2016-17

                                                                                                                                                                              2018-19

                           Source: Department of Industry, Science, Energy and Resources (2020) Australian Petroleum Statistics
                           2020 - April, https://www.energy.gov.au/publications/australian-petroleum-statistics-2020,
                           Department of Industry, Science, Energy and Resources (2019) Australian Energy Update 2019,
                           https://www.energy.gov.au/publications/australian-energy-update-2019

As shown above, a significant component of the growth over the last decade was coal seam
gas, most of which is currently produced in Queensland. Nearly all of the remainder is
‘conventional’ gas. Australia’s gas production is concentrated in facilities offshore from

                   Weapon of Gas Destruction                                                                                                                                                         11
North West WA.13 There is also declining production in Victoria and South Australia. Figure 4
shows the breakdown for these states, together making up the bulk of total production.
Figure 4: Gas production in Australia, by major producing state
80,000
70,000
Western
60,000 Australia
Gas production (Mcm)
50,000
Queensland
40,000
30,000
Victoria
20,000
10,000 South
Australia
0
Source: Department of Industry, Science, Energy and Resources (2019) Australian Energy Update
2019, Table Q; Department of Industry, Science, Energy and Resources (2020) Australian Petroleum
Statistics 2020 - April
There is clearly no shortage of gas in Australia. Gas production has increased dramatically in
recent years and this growth has almost entirely gone to exports. Australian production is
around four times as large as domestic consumption. Around three quarters of total
production is exported (see Figure 5).
13
Offshore production that is processed in Darwin appears to count towards WA in the Australian Energy
Statistics. There is some onshore production in the NT but currently at low levels.
Weapon of Gas Destruction 12Figure 5: Gas production vs consumption, incl consumption by oil and gas industry
180,000
160,000
Fossil gas production
140,000
LNG exports
120,000
100,000
Mcm
Domestic
80,000 consumption
60,000
40,000
Domestic
20,000 consumption, ex oil
and gas extraction
0
1980-81
1982-83
1984-85
1986-87
1988-89
1990-91
1992-93
1994-95
1996-97
1998-99
2000-01
2002-03
2004-05
2006-07
2008-09
2010-11
2012-13
2014-15
2016-17
2018-19
Source: Department of Industry, Science, Energy and Resources (2019) Australian Energy Update
2019; Department of Industry, Science, Energy and Resources (2020) Australian Petroleum Statistics
2020 - April;
Note: pre 2002-03, gas use by oil and gas mining is ‘mining’ as subsectors not given seperately;
subsequent data shows almost all mining gas consumption is by oil and gas, and most of this for LNG.
Moreover, as shown above, the oil and gas industry is itself a major consumer of gas. Large
amounts of gas is burned in the LNG facilities themselves to compress and cool the gas to
make it suitable for export. This is ‘domestic consumption’ but solely to facilitate exports.
More than twice as much gas is burnt in Australia to help export gas than is burnt in homes
across Australia. This is shown in Figure 6 below.
Weapon of Gas Destruction 13Figure 6: Australian gas flows in 2017-18 (PJ)
Source: Department of Industry, Science, Energy and Resources (2019) Australian Energy Update
2019, p. 10
Figure 6 from the Australian Energy Statistics published by the Australian Government, is
from 2017-18. In the subsequent years to 2020 Australian gas production increased 32%,
with almost all of this going to exports.14
Figure 6 shows that LNG plant electricity generation consumes 78 petajoules while ‘other
use’ in LNG plants consumes 266 PJ. In total this 344 PJ in 2017-18 represented more than
double the 166 PJ used by Australian ‘residential’ households.
Gas used domestically also goes into electricity generation, process heat for manufacturing,
and residential use. In all of these uses there are readily available and economic
alternatives. This is especially the case on the east coast where, as The Australia Institute
warned would happen, large increases in gas exports resulted in large increases in gas
prices. 15
LNG EXPANSION
Australian gas exports have been a significant factor behind increased gas use globally.
Australia exports gas in the form of LNG. Most gas is transported between countries by
pipeline but over the last two decades LNG has greatly increased its share of exports. While
14
Office of the Chief Economist (2020) Resources and Energy Quarterly - June 2020,
https://publications.industry.gov.au/publications/resourcesandenergyquarterlyjune2020/index.html
15
Matt Grudnoff (2013) Cooking up a price rise, https://www.tai.org.au/content/cooking-price-rise-0
Weapon of Gas Destruction 14gas supply by pipeline also expanded, by around a third since 2000, global LNG exports
tripled over the same period. In 2000 LNG made up around a quarter of global exports. By
2019 it was close to half of global gas exports.
No other country played a bigger role in driving increased LNG exports over this period than
Australia. Australia’s LNG exports made up half global LNG growth since 2010, and close to
third of the growth since 2000, more than any other country.
From around 7% of global LNG in 2000, Australian LNG exports grew to become to the
world’s largest at nearly one quarter of global LNG in 2019.16 Australia and Qatar jostled for
this position over the late 2010s. Australian LNG exports in 2019 were about as large as
three quarters of total global LNG supply in 2000.
As a major gas exporter, Australia is among the largest producers of gas, 7th largest in total
2018. The largest are the US (22%) and Russia (17%). Australia’s share of global gas
production has increased from less than 1% in the late 1980s to nearly 4% in 2019.
While LNG has increased its global market share in recent years, most gas is transported
between countries by pipelines. Russia’s very large gas exports are overwhelmingly by
pipeline. Some countries have access to gas by LNG and other means. China imports LNG
while also importing gas by pipeline, including from Russia, and producing gas domestically.
Australian gas and coal exports make it the third largest fossil fuel exporter globally, by CO2
potential. 17 Australia’s role as a large fossil fuel exporter enables other countries to
consume larger volumes of fossil fuel. Increased fossil fuel exports support the lock-in of
high carbon infrastructure, both in supply and in consumption.
LNG is highly capital intensive, requiring large amounts of expensive equipment, and is
highly emissions intensive. Liquefaction, shipping and regasification all consume huge
amounts of energy, almost all of which is fuelled by gas. Continued expansion of LNG will
increase greenhouse gas emissions, both in supply and end use combustion. Once facilities
are built, covering financial commitments will require ongoing operation.
AUSTRALIAN RESERVES
Where companies are confident they can extract a gas resources economically, they are
generally called ‘reserves’. Reserves assessed as most economic to extract are called ‘proven
reserves’.
16
Office of the Chief Economist (2020) Resources and Energy Quarterly - June 2020, p. 73
17
Swann (2019) High Carbon from a Land Down Under,
https://www.tai.org.au/sites/default/files/P667%20High%20Carbon%20from%20a%20Land%20Down%20Un
der%20%5BWEB%5D_0.pdf
Weapon of Gas Destruction 15Australia has on average been more effective than other countries in turning proven
reserves into production, demonstrated by Australia’s increased share of global reserves
and even faster growing share of global production.
Figure 7: Australian proven gas reserves vs production, as % of world total
4.0%
3.5%
3.0%
share of world total
2.5% Australian gas
production
2.0%
1.5%
Australian
proven gas
1.0% reserves
0.5%
0.0%
1980
1982
1984
1986
1988
1990
1992
1994
1996
1998
2000
2002
2004
2006
2008
2010
2012
2014
2016
2018
Source: BP (2019) Statistical Review of World Energy 2019,
https://www.bp.com/en/global/corporate/energy-economics/statistical-review-of-world-energy.html
While Australia is now the world’s largest LNG exporter and the seventh largest gas
producer, Australian ranks 15th globally in terms of total proven gas reserves.
Until around 2010 Australian gas companies have added reserves and increased production
at similar rates, and more quickly than the global average, increasing their share of the
global total. Post 2010, while reserves growth stalled, Australian production growth far
outpaced global production increases.
For reserves to increase again, companies would need to discover and assess resources that
are economic to extract. As we will see, gas companies in Australia are currently seeking to
do just that.
Weapon of Gas Destruction 16New gas production projects
Companies and governments have proposed a large number of major new gas projects
across Australia. The size and nature of these projects varies greatly, but as this section
shows, together the projects are comparable in capacity to current gas supply.
Which projects will go ahead and when will depend on developments and interactions
across economics, finance, technology, and policy in Australia and overseas.
The recent pandemic, and the Saudi-Russian oil price war, has lead gas companies to
writedown the value of assets and delay large projects. It remains to be seen whether any
projects will be outright cancelled and which will be accelerated by subsidies and
deregulation.
Consideration of these projects should include the scale of the emissions they might release.
That is the goal of this section.
PROPOSED MAJOR PROJECTS
The Commonwealth Office of the Chief Economist (OCE) releases an annual ‘Major Projects
List’ of resource project proposals. The list consists of specific proposals from specific
companies, in various stages of design, approval and financial commitment. The December
2019 OCE Major Projects List includes 35 oil and gas projects. 18
Analysis here excludes three “oil” projects, five “completed” gas projects 19 and five gas
import terminals. The import terminals nonetheless require special comment (see below).
There are currently 22 gas production and export proposals across Australia. These are
listed in Table 1. Some adjustments are made for updated information, or to adjust
incomplete or erroneous information, as marked below.
18
Office of the Chief Economist (2020) Resources and Energy Quarterly - March 2020 - Major Projects,
https://publications.industry.gov.au/publications/resourcesandenergyquarterlydecember2019/documents/R
EQ-Dec-2019-Major-Projects-Data.xlsx
19
NB treating as completed: Santos GLNG Roma East, Orbost Gas plant.
Weapon of Gas Destruction 17Table 1: Gas supply projects from Commonwealth Major Projects List
Est in PJ
Project State Type Status Resource Unit
Capacity pa 20
Gas/ LNG/
Browse and NWS
WA New Feasible Condensate/ 12 Mtpa 21 653
extension
LPG
Scarborough WA New Feasible Gas/ LNG 8 Mtpa 22 435
Greater Sunrise NT New Announced Gas/ LNG 365 PJ pa 365
Gorgon (train 4) WA Expsn Announced LNG 5.2 Mtpa 283
Pluto expansion WA Expsn Feasible LNG 5 Mtpa 272
Surat Gas Project QLD New Feasible Gas 240 PJ pa 240
Crux LNG WA New Feasible LNG 3 Mtpa 163
Bowen Gas Project QLD New Announced Gas 147 PJ pa 147
Cash Maple WA New Announced LNG 2 Mtpa 109
Gas/ LNG/
Equus WA New Feasible 2 Mtpa 109
Condensate
Waitsia Stage 2 WA Expsn Feasible Gas 250 TJ pd 91
Narrabri Gas Project NSW New Feasible Gas 74 PJ pa 23
74
Glenaras gas project QLD New Announced Gas 73 PJ pa 73
Transborder FLNG WA New Announced Gas/ LNG 1.2 Mtpa 65
Barossa backfill to Gas/ LNG/ mmboe
NT Expsn Feasible 9 55
Darwin LNG Condensate pa
Tipton QLD Expsn Feasible Gas 80 TJ pd 29
Manta Gas Project VIC New Feasible Gas 23 PJ pa 23
Roma North QLD Expsn Committed Gas 48 TJ pd 24
18
Clio-Acme WA New Announced Gas n/a n/a n/a
Gorgon Stage 2 WA Expsn Committed Gas n/a n/a n/a
Julimar-Brunello II WA Expsn Feasible Gas/ LNG n/a n/a n/a
Capex Qld LNG, 2040+ QLD Expsn Committed Gas/ LNG n/a n/a n/a
Source: Office of the Chief Economist (2020) Resources and Energy Quarterly - March 2020 - Major
Projects, conversions as per appendix.
20
Using conversions outlined in the appendix.
21
The list currently states capacity of 2273 mmboe pa. OCE confirmed by email this is a typo. OCE cited 12
Mtpa as per proponent documentation: Woodside (2020) Proposed Browse Project,
https://files.woodside/docs/default-source/our-business---documents-and-files/burrup-hub---documents-
and-files/browse---documents-and-files/browse-brochure.pdf?sfvrsn=d08066ed_6
This has been checked against Browse EIS documentation.
22
OCE lists a capacity of 7-9 Mtpa. The median is used here.
23
Updated as per project documentation for environmental approval GHD (2016) Narrabri Gas Project -
Environmental Impact Statement Economic Assessment, p. 74,
https://majorprojects.planningportal.nsw.gov.au/prweb/PRRestService/mp/01/getContent?AttachRef=SSD-
6456%2120190228T035910.643%20GMT
24
Senex Energy (2020) Roma North, https://www.senexenergy.com.au/operations/surat-basin-gas/roma-
north/
Weapon of Gas Destruction 18In the Major Projects list, thirteen are new projects and nine are expansions of existing
projects.
Three projects are “committed”. These have “completed all commercial, engineering and
environmental studies, received all necessary government regulatory approvals, and
finalised the financing of the project to allow construction.”
Another 12 are “feasible”, where “initial feasibility study [has] been completed”.
Seven are “publicly announced” with only “preliminary information”. 25
OCE emphasises no projects are guaranteed to proceed. This depends on financial,
economic, regulatory and other factors, with higher uncertainty for less committed projects.
Many of the large projects have been delayed during the coronavirus pandemic. But to our
knowledge none of these projects have been cancelled. In aggregate they represent a very
large proposed increase in gas mining in Australia.
Most (12) are in or offshore of WA, including four of the five largest.
The single largest project is Woodside’s “Browse and NWS extension”. This involves
developing the offshore Browse field and laying 900 km of ocean-floor pipelines to the
existing North West Shelf LNG terminals, which must also be upgraded and their life
extended. The massive project would produce a very large amount of LNG at among the
highest emissions intensity in the world. 26
There are also 7 gas projects proposed in Queensland, 2 in the NT (including gas from the
‘Joint Development Area’ with East Timor), 1 in Victoria, and 1 in NSW.
Ten projects would produce ‘gas’ generally feeding pipelines for consumption by other
facilities, domestic or for export. Eight would supply ‘gas/LNG’, mostly for export. Four
would produce ‘LNG’ alone, including use of feedstock gas from separate projects.
Three LNG projects would also produce ‘condensate’, a higher value fossil liquid product
sometimes called ‘wet gas’. Government and energy authorities generally classify it as a
form of oil. 27
25
Office of the Chief Economist (2019) Resources and Energy Quarterly - December 2019, p. 143,
https://publications.industry.gov.au/publications/resourcesandenergyquarterlydecember2019/index.html
26
Conservation Council WA (2019) Burrup Hub: Australia’s most polluting fossil fuel project
27
Department of Industry, Science, Energy and Resources (2020) Australian Petroleum Statistics 2020 - April,
https://www.energy.gov.au/publications/australian-petroleum-statistics-2020
Weapon of Gas Destruction 19Total new supply capacity
OCE gives estimated project capacities in a range of units. LNG projects capacities are
expressed in terms of mass, as Mtpa (million tonnes per annum). Others project capacities
are expressed in terms of energy content, generally as joules, or as Mmboe (million barrels
of oil equivalent). For comparison these are all converted into a common unit, namely,
petajoules per annum (PJ pa). These unit conversions are outlined in Appendix 1, with
results shown above in Table 1.
Four projects are all listed without capacities. These are large projects that will supply
seperate LNG facilities, including three fields offshore of WA, and ongoing drilling and
fracking to ‘sustain’ the Queensland LNG terminals post 2040. These projects are also left
out of subsequent analysis.
The total proposed additional capacity of new fossil gas projects is 3,204 PJ pa.
Note a small share of this total is expected to be condenstate and liquid petroleum gas
(LPG). Analysis here assumes all energy content is fossil gas. This will underestimate
combustion emissions as gas is less emissions intensive per energy content.
Total capacity at new or expanded LNG projects is 1,954 PJ pa. Note other listed gas supply
projects would also feed separate LNG export facilities. Capacity for LNG projects is listed in
terms of millions of tonnes of gas (Mt). This analysis assumes this is the capacity of the sold
product, whether LNG or domestic gas. Assuming domestic use from LNG projects is 15% of
project energy production, as is the case in WA for gas, 28 this gives LNG export capacity of
1,661 PJ pa.
Substantial volumes of gas would be consumed in producing LNG. While some of these
projects would supply gas domestically, most of their output is LNG for export. The gas
consumed by the LNG facilities is not included in the capacity figure above of 3,204 PJ pa. At
current rates of gas consumption at Australian LNG facilities, additional required gas
production and consumption is inferred at 164 PJ pa.
28
Note not all projects are in WA, and not all of the energy content is gas.
Weapon of Gas Destruction 20You can also read