Weather charts National Meteorological Library and Archive Fact sheet 11 - Interpreting weather charts
←
→
Page content transcription
If your browser does not render page correctly, please read the page content below
Weather charts

National Meteorological Library and Archive
Fact sheet 11 — Interpreting weather charts
(version 01)
The National Meteorological Library and Archive
Many people have an interest in the weather and the processes that cause it, which is why the National
Meteorological Library and Archive are open to everyone.
Holding one of the most comprehensive collections on meteorology anywhere in the world, the
Library and Archive are vital for the maintenance of the public memory of the weather, the storage of
meteorological records and as aid of learning.
The Library and Archive collections include:
•   around 300,000 books, charts, atlases, journals, articles, microfiche and scientific papers on
    meteorology and climatology, for a variety of knowledge levels
•   audio-visual material including digitised images, slides, photographs, videos and DVDs
•   daily weather reports for the United Kingdom from 1861 to the present, and from around the world
•   marine weather log books
•   a number of the earliest weather diaries dating back to the late 18th century
•   artefacts, records and charts of historical interest; for example, a chart detailing the weather conditions
    for the D-Day Landings, the weather records of Scott’s Antarctic expedition from 1911
•   rare books, including a 16th century edition of Aristotle’s Meteorologica, held on behalf of the
    Royal Meteorological Society
•   a display of meteorological equipment and artefacts
For more information about the Library and Archive please see our website at:
www.metoffice.gov.uk/learning/library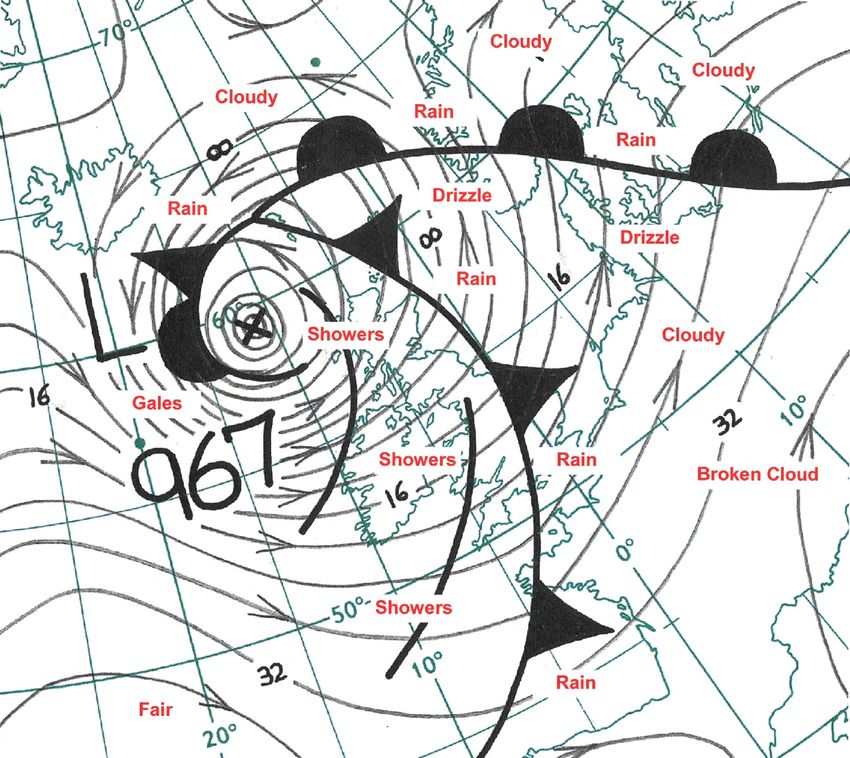
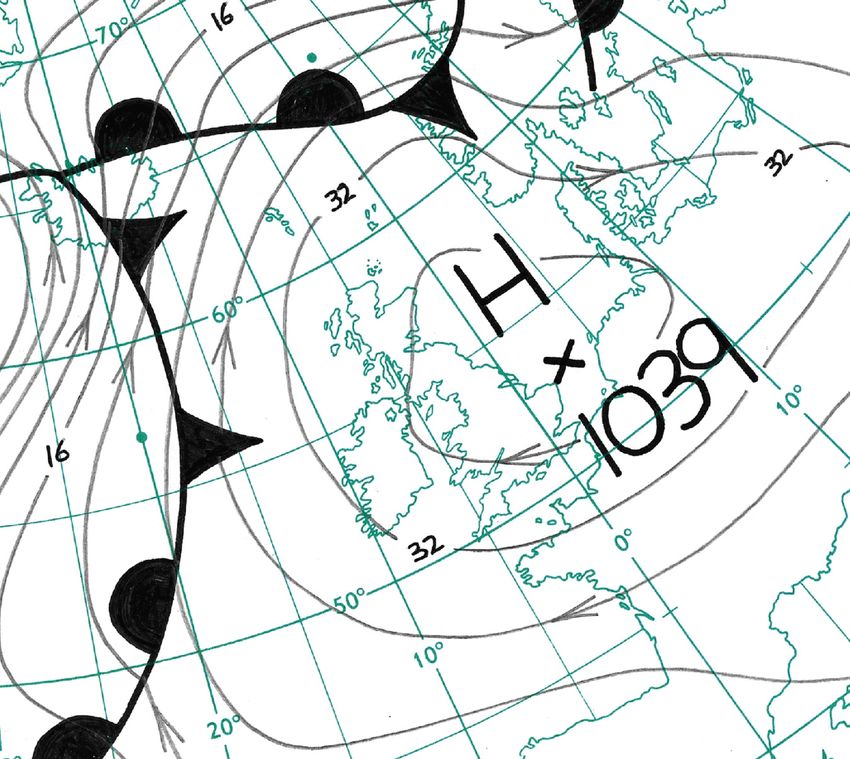
Introduction
Sir Francis Galton is credited with producing the first modern weather map in 1875 showing areas of
similar atmospheric pressure. Charts showing isobars are useful because they identify features such as
anticyclones (areas of high pressure), depressions (areas of low pressure), troughs and ridges which are
associated with particular kinds of weather.
High pressure or anticyclone
High pressure or anticyclone is that atmospheric pressure distribution in which there is a high central pressure
relative to the surroundings. It is characterised on a synoptic chart by a system of closed isobars, generally
approximately circular or oval in form, enclosing the central high pressure.

Figure 1. Anticyclone centred off the east coast of the United Kingdom at 1200 GMT on 26 March 2012.
Sir Francis Galton also devised the term ‘anticyclone’ in 1861 as implying the procession of characteristics
opposite to those found in the cyclone or depression. Thus, the circulation about the centre of an
anticyclone is clockwise in the northern hemisphere (anticlockwise in the southern), and the weather is
generally quiet and settled.
Warm and cold anticyclones
There are two main contrasting types of anticyclone, ‘warm’, and ‘cold’. A warm anticyclone has its origins
in the sub-tropical parts of the world, usually around 30-35 °N. A typical example of a warm anticyclone
that affects the United Kingdom is the Azores High. A cold anticyclone has its origins in the sub-arctic
parts of the world. A typical example of a cold anticyclone is the Siberian High which develops over the
northern Russia during the winter months and can bring cold easterly winds across the United Kingdom.
Blocking highs
High pressures have the ability to interrupt the normal eastward movement of depressions, troughs and
ridges for at least a few days. These are called blocking highs and are typical of high pressure centres that
remain fixed in a particular location for days or even weeks on end. There is a tendency for blocking highs
to persist in preferred geographical areas, especially between 10 and 20 deg. W, just to the west of the
United Kingdom, and between 10 and 20 deg. E, over Scandinavia.
Ridge of high pressure
A ridge (of high pressure), also termed a Wedge, is an extension of an anticyclone or high-pressure area
shown on a synoptic chart and is generally associated with fine, anticyclonic-type weather.
Low pressure or depression
In a depression (also referred to as a ‘low’), air is rising. As it rises and cools, water vapour condenses to
form clouds and perhaps precipitation. Consequently, the weather in a depression is often cloudy, wet
and windy (with winds blowing in an anticlockwise direction around the depression). There are usually
frontal systems associated with depressions.
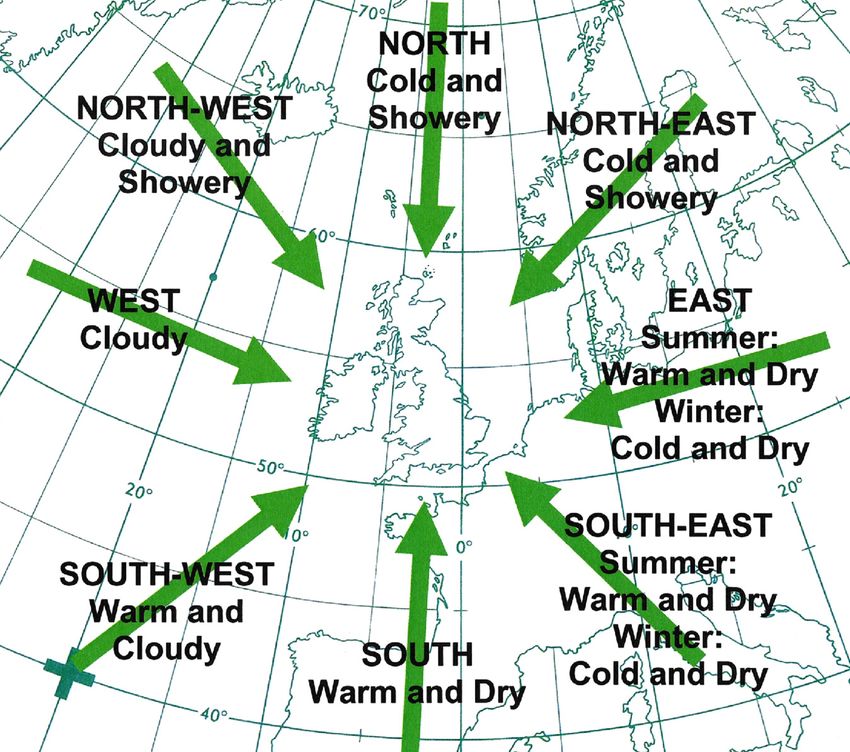
Figure 2. A depression centred to the northwest of the United Kingdom at 0600 GMT on 28 December 2011.
Trough of low pressure
A trough (of low pressure) is a pressure feature of the synoptic chart; it is characterised by a system of
isobars which are concave towards a depression and have maximum curvature along the axis of the
trough, or ‘trough line’.
A front is necessarily marked by a trough but the converse is not true. Those troughs which are not frontal
in character are, however, also generally marked by cloudy, showery weather.
Buys Ballot’s Law
A rule in synoptic meteorology, enunciated in 1857 by Buys Ballot, of Utrecht, which states that if, in
the northern hemisphere, one stands with one’s back to the wind, pressure is lower on one’s left hand
than on one’s right, whilst in the southern hemisphere the converse is true. This law implies that, in
the northern hemisphere, the winds blow anticlockwise round a depression, and clockwise round an
anticyclone; the converse is true in the southern hemisphere.
Isobars (lines of equal atmospheric pressure)
The lines shown on a weather map are isobars — they join points of equal atmospheric pressure.
The term isobar comes from the Greek isos meaning ‘equal’ and baros meaning ‘weight’.
Atmospheric pressure is measured by a barometer, with a correction then being made to give the
equivalent pressure at mean sea-level. Meteorologists measure pressure in units called hectoPascals (hPa)
although the millibar (mb) is still widely used. Older instruments sometimes give pressure in terms of
inches of mercury (mmHg).
The general conversion for units of atmospheric pressure are:
1 hPa = 1 mb = 33.864 mmHg
In the British Isles the average sea-level pressure is about 1013.25 mb (about 30 inches of mercury), and it
is rare for pressure to rise above 1050 mb or fall below 950 mb.
Charts showing isobars are useful because they identify features such as anticyclones and ridges (areas of
high pressure) and depressions and troughs (areas of low pressure), which are associated with particular
kinds of weather. These features move essentially in a predictable way.
Also, wind speeds and directions are related to the spacing and orientation of the isobars.
Relationship between isobars and wind:
There are two important relationships between isobars and winds:
•   The closer the isobars, the stronger the wind.
•   The wind blows almost parallel to the isobars.
These make it possible to deduce the wind flow from the isobars.
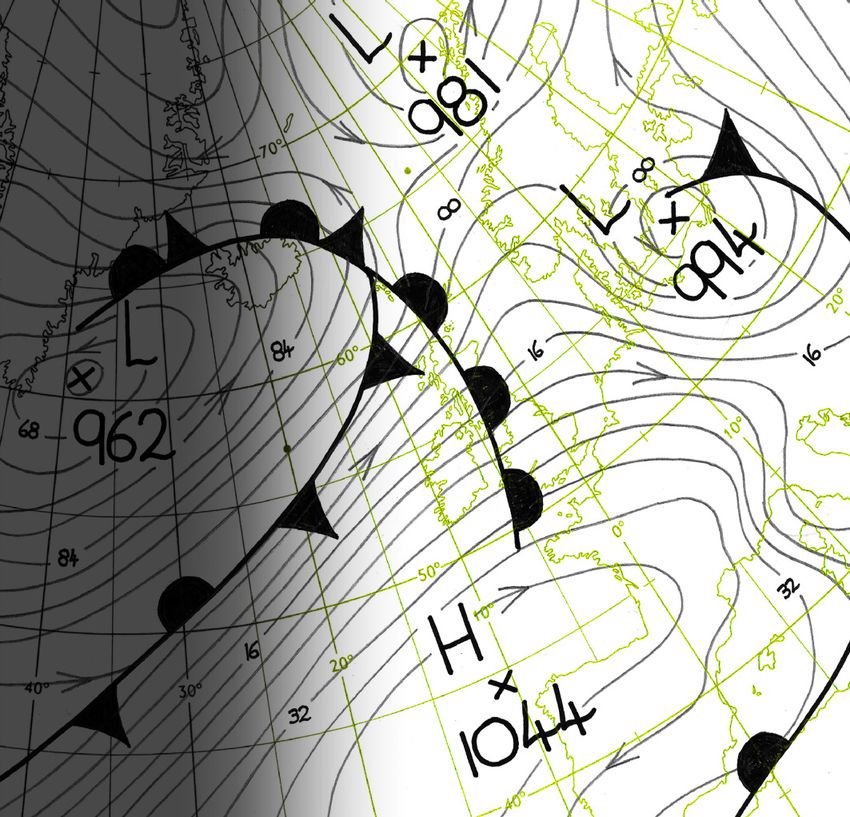
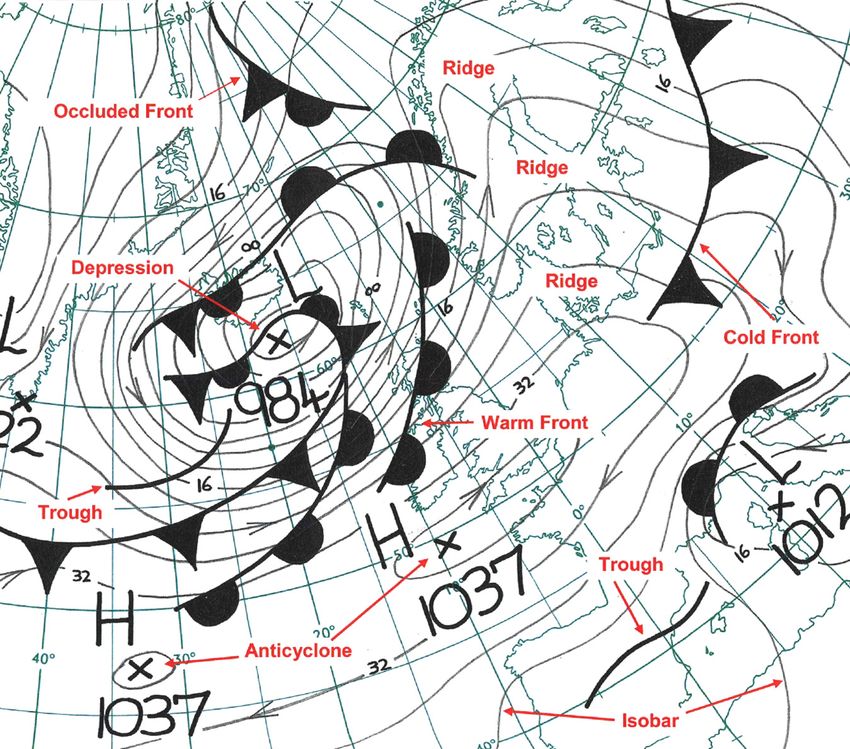
Figure 3. The association between depressions, anticyclones, isobars, troughs, ridges and weather fronts.
Wind speed and direction
The direction given for the wind refers to the direction from which it comes. For example, a westerly wind
is blowing from the west towards the east.
Measurements of wind strength are made at 10 metres (33 feet) above the ground. A specified height
has to be used because the wind speed decreases towards the ground. In the United Kingdom winds are
measured in knots (nautical miles per hour).
However, forecast winds are often given in miles per hour (where 1 knot is equivalent to 1.15 mph) or
in terms of the Beaufort Scale. Rapid variations in wind speed are referred to as gusts. Gusts are higher
inland than over the sea or windward coasts, although the mean wind speeds tend to be lower inland.
Typically, gusts can be 60% higher than the mean speed, although in the middle of cities this can reach
100%. Northerly winds tend to be gustier than southerly ones.
Relationship between wind direction and weather
In general, the weather is strongly influenced by the wind direction, so information about the wind
provides an indication of the type of weather likely to be experienced. However, this approach is effective
only if the wind is blowing from the same direction for some time. A marked change in wind direction
usually indicates a change in the weather.
Northerly winds tend to bring relatively cold air from Polar Regions to the British Isles. Similarly, southerly
winds tend to bring relatively warm air from the tropics. The characteristics of the air are also affected by
its approach to the British Isles. Air picks up moisture if it travels across the sea, but remains relatively dry if
it comes across the land.
As cold polar air moves southwards over an increasingly warm sea, the heating of the air by the sea causes
cumulus clouds to form. These clouds may grow sufficiently for showers to develop and, consequently,
winds from the north-west, north or north-east usually bring cold, showery weather to the British Isles.

Figure 4. Chart showing the characteristic weather phenomena associated with winds affecting the British
Isles from various directions.
Warm air from the tropics moving northwards over the sea is cooled from below. Sometimes the cooling
is sufficient for sea fog or a thin layer of stratus to form. The cloud can become thick enough for drizzle,
especially on windward coasts and over high ground. In general, winds from the west or south-west are
associated with overcast, wet weather.
Winds from the south and south-east mainly occur in summer and these bring warm, dry weather.
However, southerly winds can sometimes bring hot, thundery weather.
Easterly winds in winter bring very cold air to the British Isles. The characteristics and path of the air
determine whether it is cloudy (with perhaps rain, sleet or snow) or fine and sunny. In summer, an easterly
wind will mean it is cool on the east coast but warm elsewhere, usually with clear skies.
Warm, cold and occluded fronts
The boundary between two different types of air mass is called a front. In our latitudes a front usually
separates warm, moist air from the tropics and cold, relatively dry air from Polar Regions. On a weather
chart, the round (warm front) or pointed (cold front) symbols on the front point in the direction of the
front’s movement. Fronts move with the wind, so they usually travel from the west to the east. At a front,
the heavier cold air undercuts the less dense warm air, causing the warm air to rise over the wedge of cold air.
As the air rises there is cooling and condensation, thus leading to the formation of clouds. If the cloud
becomes sufficiently thick, rain will form. Consequently, fronts tend to be associated with cloud and
rain. In winter, there can be sleet or snow if the temperature near the ground is close to freezing. It is
convenient to distinguish between warm fronts, cold fronts and occluded fronts.
A front which is moving in such a way that the warm air is advancing to replace the cold air is called a
warm front. As the warm front approaches, there is thickening cloud and eventually it starts to rain.
The belt of rain extends 100 — 200 miles ahead of the front. Behind the front the rain usually becomes
lighter, or ceases, but it remains cloudy. As a warm front passes, the air changes from being fairly cold
and cloudy to being warm and overcast (typical of warm air from the tropics travelling over the sea).
Also there is a clockwise change in wind direction, and the wind is said to ‘veer’.

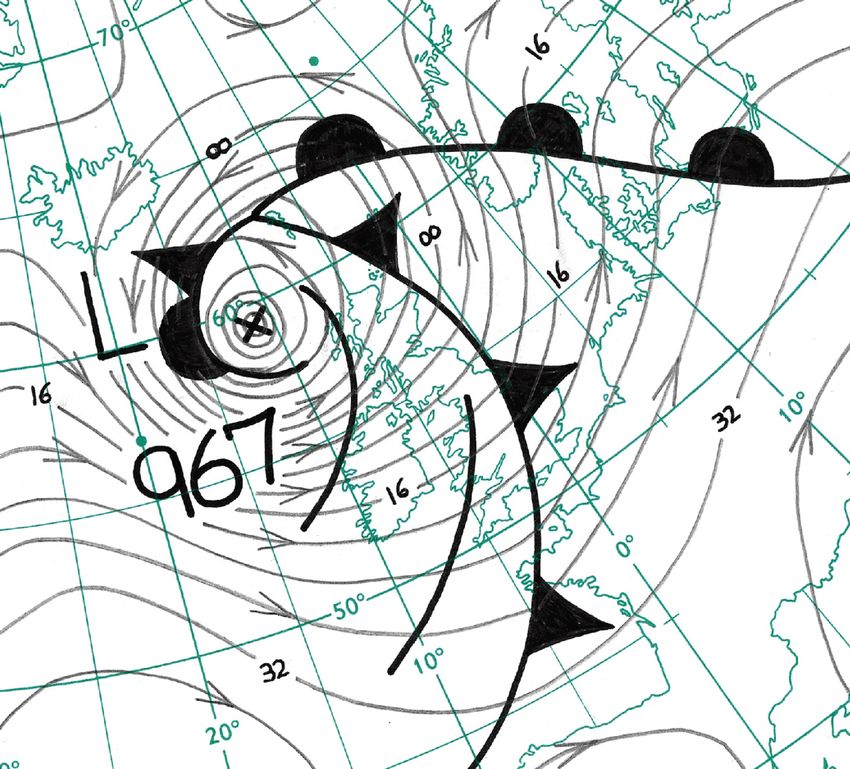
Figure 5. Weather associated with a depression
A cold front moves so that the cold air is advancing to replace the warm air. This means that as a cold
front passes, the weather changes from being mild and overcast to being cold and bright, possibly with
showers (typical of cold polar air travelling over the sea). The passage of the front is often marked by a
narrow band of rain and a veer in the wind direction.
An occluded front can be thought of as being a result of the warm and cold fronts meeting.
Consequently, ahead of an occlusion the weather is similar to that ahead of a warm front, whereas behind
the occlusion it is similar to that behind a cold front.
The characteristics given for the fronts apply to active fronts. If the front is weak, the rain associated with it
is light or non-existent, and the changes across the front are less marked.
Satellite imagery used to interpret weather charts
Satellite pictures are an invaluable tool for weather forecasters, and the various types of images that
are now widely available can significantly enhance the understanding of meteorological processes and
weather forecasting, especially the movement of weather systems. Figures 6 and 7 show how valuable
satellite imagery is to synoptic weather forecasting.

Figure 6. Visible satellite image showing a             Figure 7. Surface synoptic chart showing the same
depression to the west of Scotland at 1200 UTC          depression to the west of Scotland at 1200 UTC
on 11 November 2010.                                    on 11 November 2010.

Figure 6 is a visible image taken at 1200 UTC on 11 November 2010 when a deep depression swept across
the North Atlantic towards the British Isles. This image shows a deep and well developed area of low
pressure centred to the west of Scotland. The image shows clearly the cloud structure swirling around
the centre of the low with the main frontal cloud clearing the east coast of the UK and shower clouds
following on behind. The main frontal zone can be seen running down the North Sea and into France
and the Low Countries. Heavy and blustery showers behind the main frontal band are running into many
western areas of the UK, merging at times into longer spells of rain. Also, clearly seen to the bottom right
of this image are the Alps covered in snow.
Figure 7 is the surface synoptic chart for 1200 UTC on 11 November 2010 showing a deep area of low
pressure with a central pressure value of 948 hPa to the west of Scotland. Wrapped around the low
pressure centre is an occluded front with a cold front lying roughly from Lincolnshire across the Midlands
and down to the West Country. The warm front is just clearing the east coast of southeast England which
much of southern England and East Anglia lying in the warm sector of this depression. Also running into
western Scotland is an old occluded front which only enhances the showery activity in that part of the UK.
A weak ridge of high pressure is lying across southern France, giving a lot of fine weather here and across
northern Italy.
A more detailed analysis of air masses and weather fronts can be found in fact-sheet number 10 in this series.
Decoding weather charts and weather summaries
Good quality observations are one of the basic ‘tools of the trade’ for a weather forecaster. On a
meteorological synoptic chart, the weather conditions at a given observing site are represented on this
chart by a station circle plot.
The weather conditions at each individual station can be represented on a surface chart by means of
a station circle or triangle plot. The land station plot can represent all the elements reported from that
station, typically examples are:
•   Air (dry-bulb) temperature
•   Dewpoint temperature
•   Atmospheric pressure (reduced to mean sea level)
•   Pressure tendency (observed over the last three hours)
•   Total cloud amount
•   Amount, type and height of cloud
•   Current weather
•   Past weather
•   Wind direction
•   Wind speed
•   Maximum gust speed
•   Visibility
In addition to the above elements, stations at sea, such as ships or buoys, also report:
•   Sea surface temperature
•   Wave height
•   Wave direction
•   Swell height
•   Swell direction
•   Movement of ship or buoy
Decode and example of a land station plot
Each element of the observation, with the exception of wind, is plotted in a fixed position around the
station circle so that individual elements can be easily identified.

                                                      Figure 9. Decode of elements plotted on a land
                                                      station circle (note the colour coding).

                                                      Figure 10. Example of a standard land station
                                                      circle plot.
Identifier Description Actual
(From Figure 9) (From Figure 10)
N Total amount of cloud (in oktas) 8
CL Type of low cloud Stratus
NL Amount of low cloud (in oktas) 6
hLhL Height of low cloud (in feet) 1000
CM Type of medium cloud Altostratus
NM Amount of medium cloud (in oktas) 4
hMhM Height of medium cloud (in feet) 15000
CH Type of high cloud Cirrus
NH Amount of high cloud (in oktas) 6
hHhH Height of high cloud (in feet) 25000
TT Dry-bulb air temperature (in degrees Celsius) 23
TdTd Dew point temperature (in degrees Celsius) 18
ww Present weather Continuous moderate rain
W1W2 Past weather Rain
dd Wind direction (in degrees) 250
ff Wind speed (in knots) 30
G(f’)f’f’ Maximum wind gust (in knots) 45
VV Visibility (in metres or kilometres) 6000 metres
Pressure tendency and trend (black: rising, red:
pppa or pppa Falling 0.5 hPa in last 3 hours
falling) (in millibars)
PPP Atmospheric pressure (in hPa) 1004.2
Table 1. Decode of elements plotted on a land station circle from the example in Figure 10.Decode and example of a ship station plot
Each element of the observation, with the exception of wind, is plotted in a fixed position around the
station circle so that individual elements can be easily identified.
Figure 11. Decode of elements plotted on a ship
station circle (note the colour coding).
Figure 12. Example of a standard ship station
circle plot.Identifier Actual
Description
(From Figure 11) (From Figure 12)
N Total amount of cloud (in oktas) 8 oktas
CL Type of low cloud Stratus
NL Amount of low cloud (in oktas) 4
hLhL Height of low cloud (in feet) 800
CM Type of medium cloud Altostratus
NM Amount of medium cloud (in oktas) 4
hMhM Height of medium cloud (in feet) 15000
CH Type of high cloud Cirrus
NH Amount of high cloud (in oktas) 6
hHhH Height of high cloud (in feet) 25000
TT Dry-bulb air temperature (in degrees Celsius) 13
TdTd Dew point temperature (in degrees Celsius) 9
TWTW Sea surface temperature 21
ww Present weather Mist
W1W2 Past weather Fog
dd Wind direction (in degrees) 240
ff Wind speed (in knots) 30
G(f’)f’f’ Maximum wind gust (in knots) 47
FV’V’ or VV Visibility (in metres or kilometres) 1500 metres
Pressure tendency and trend (black: rising, red: Rising then falling - 0.7 hPa higher
pppa or pppa
falling) (in millibars) than 3 hours ago
PPP Atmospheric pressure (in hPa) 997.8
DSVS Ship’s course and speed over the last 3 hours Moving SE at 6 to 10 knots
Period of waves (in seconds)
PwaPwaHwaHwa -
Height of waves (in ½ metres)
Period of sea waves (in seconds)
P W P W HW HW -
Height of sea waves (in ½ metres)
Direction, in tens of degrees, from which the first
Swell waves coming from the
swell waves are coming.
dw1dw1Pw1Pw1Hw1Hw1 southwest.
Period of first swell waves (in seconds)
3 metres every 8 seconds
Height of first swell waves (in ½ metres)
Direction, in tens of degrees, from which the
second swell waves are coming.
dw2dw2Pw2Pw2Hw2Hw2 -
Period of second swell waves (in seconds)
Height of second swell waves (in ½ metres)
GBTT
D....D Ship’s call sign
(Call sign of the QE2)
Table 2. Decode of elements plotted on a ship station circle from the example in Figure 12.Decode and example of a METAR (METeorological Aerodrome Report) station plot
Each element of the observation, with the exception of wind, is plotted in a fixed position around the
station circle so that individual elements can be easily identified.
Figure 13. Decode of elements plotted on a METAR
station circle (note the colour coding).
Figure 14. Example of an older type of METAR
station circle plot.
Figure 15. Example of a newer type of METAR
station circle plot.Identifier Actual
Description
(From Figure 13) (From Figure 13)
3-4 oktas of stratocumulus
cloud at 2,500 feet plus 1-2
CL or C Amount/Type/Height of low cloud
oktas of Cumulus cloud at
1,500 feet
5-7 oktas of altocumulus cloud
CM or C Amount/Type/Height of medium cloud
at 12,000 feet
Overcast layer of cirrostratus
CH or C Amount/Type/Height of high cloud
cloud at 25,000 feet.
TT Dry-bulb air temperature (in whole degrees Celsius) 18
TdTd Dewpoint temperature (in whole degrees Celsius) 14
ww Present weather Recent rain shower(s)
VVVV Visibility (in metres or kilometres) Greater than 9 km
PPP Atmospheric pressure adjusted to mean sea level (in hPa) 998.9
dd Wind direction (in degrees) 200
ff Wind speed (in knots) 10
ICAO Identifiers can be found in the ICAO Location Indicators Handbook (Doc 7910/100)
Table 3. Decode of elements plotted on a METAR station circle from the examples in Figure 14
and Figure 15.
Decode of elements that make up the station circle plot
Cloud cover (N)
The total amount of the sky covered by cloud in expressed in oktas (eighths) and plotted within the
station circle itself. The symbols used over the years for manned stations are as follows:
Before 1914
No symbols were used, but the Beaufort letter for the amount of cloud was plotted instead.
Beaufort Description
letters
b Total cloud amount 0 to 2 oktas
bc Total cloud amount 3 to 5 oktas
c Total cloud amount 6 to 7 oktas
o Uniform thick layer of cloud completely covering the sky (overcast)
Figure 16. Beaufort letters used to describe the total amount of cloud present.1 January 1914 to 31 December 1949
These symbols should have been stopped on 31 December 1948 in accordance with the Handbook
of Weather Messages Codes & Specifications published in 1948 but continued to be used in the
Daily Weather Report publication until 31 December 1949. A change of units from tenths to oktas
was made on 15 January 1949 but the symbols used remained the same.
Symbol Description Symbol Description
Sky clear (0 tenths or 0 oktas) 7–9 tenths or 6–7 oktas covered
1–3 tenths or 1–2 oktas covered 10 tenths or 8 oktas covered
4–6 tenths or 3–5 oktas covered
Figure 17. Symbols used to describe the total amount of cloud present during the period from January
1914 to 31 December 1949.
Midday 1 January 1950 to 30 June 1968
These symbols should have started on 1 January 1949 in accordance with the Handbook of Weather
Messages Codes & Specifications published in 1948 but were not used in the Daily Weather Report
until 1 January 1950.
Symbol Description Symbol Description
Sky clear (0 oktas) 5 oktas covered
1 okta covered 6 oktas covered
2 oktas covered 7 oktas covered
3 oktas covered Overcast sky 8 oktas
4 oktas covered Sky obscured
Figure 18. Symbols used to describe the total amount of cloud present during the period from midday
1 January 1950 to June 1968.1 July 1968 to the present
Symbol Description Symbol Description
Sky clear (0 oktas) 6 oktas covered
1 okta or less of sky covered but not zero 7 oktas covered
2 oktas of sky covered 8 oktas covered
Sky obscured by fog or other
3 oktas of sky covered
meteorological phenomena
Cloud cover obscured for other
4 oktas of sky covered
reasons or not observed
5 oktas of sky covered
Figure 19. Symbols used to describe the total amount of cloud present during the period from July 1968 to
the present.
Increasingly, automatic weather observations are being plotted on today’s charts. To differentiate
between a manned observation and an observation done automatically, a triangle is used instead of the
station circle. The station triangle is filled in according to the total amount of cloud observed at the station
and can be represented as follows:
Symbol Description Symbol Description
Sky clear (0 oktas) 6 oktas covered
1 okta or less of sky covered, but not zero 7 oktas covered
2 oktas of sky covered 8 oktas covered
3 oktas of skyPrevailing
covered wind No cloud data
Station plotted when a METAR
(METeorological Aerodrome Report)
4 oktas of sky covered
is reported–no total cloud
information is provided
5 oktas of sky covered
Figure 20. Symbols used to describe the total amount of cloud present as reported by automatic weather
stations and stations reporting using the METAR code.Cloud amount decode for METARs
SKC or CLR: 0 oktas
FEW: 1 to 2 oktas
SCT: 3 to 4 oktas
BKN: 5 to 7 oktas
OVC: 8 oktas
Cloud Types (CL, CM, CH)
Cloud symbols used on a synoptic chart for low cloud CL
CL = stratocumulus (Sc), stratus (St), cumulus (Cu) and cumulonimbus (Cb)
Symbol Code figure Description
0 No stratocumulus, stratus, cumulus or cumulonimbus
Cumulus with little vertical extent and seemingly flattened,
1
or ragged cumulus other than of bad weather#, or both
Cumulus of moderate or strong vertical extent, generally with
protuberances in the form of domes or towers, either accompanied
2
or not by other cumulus or by stratocumulus, all having their bases
at the same level
3 Cumulonimbus, the summits of which, at lease partially, lack sharp
outlines, but are neither clearly fibrous (cirriform) nor in the form of
an anvil, cumulus, stratosumulus or stratus may also be present
Stratocumulus formed by the spreading out of cumulus, cumulus
4
may also be present
5 Stratocumulus not resulting from the spreading out of cumulus
Stratus in a more or less continuous sheet or layer, or in ragged
6
shreads, or both, but not stratus fractus of bad weather
Stratus fractus of bad weather# or cumulus fractus of bad weather#,
7
or both (pannus), usually below altostratus or nimbo stratus
Cumulus and stratocumulus other than that formed from the
8 spreading of cumulus, the base of the cumulus is at a different level
from that of the stratocumulus
Cumulonimbus, the upper part of which is clearly fibrous
(cirriform), often in the form of an anvil, either accompanied or not
9
by cumuluonimbus without an anvil or fibrous part by cumulus,
stratocumulu, stratus or pannus
Stratocumulus, stratus, cumulus or cumulunimbus are invisible
/
owing to fig, darkness or other surface phenomena
#
‘Bad weather’ denotes the conditions, which generally exist during precipitation and a short time before and after
Figure 21. Symbols used to denote the types of low level cloud present when plotted on a synoptic chart.Cloud symbols used on a synoptic chart for medium cloud (CM)
CM = Altocumulus (Ac), Altostratus (As) and Nimbostratus (Ns)
Symbol Code figure Description
0 No altocumulus, altostratus or nimbostratus
Altostratus, the greater part of which is semi-transparent, though
1 this part of the sun or moon may be weakly visible, as seen through
ground glass
Altostratus, the greater part of which is sufficiently dense to hide the
2
sun or moon, or nimbostratus
3 Altocumulus, the greater part of which is semi-transparent, the
various elements of the cloud change only slowly and are all at a
single level
Patches (often in the form of almonds or fiches) of altocumulus,
the greater part of which is semi-transparent, the clouds occur
4
at one or more levels and the elements are continually changing
in appearance
Semi-transparent altocumulus in bands, or altocumulus in one
or more fairly continuous layers (semi-transparent or opaque),
5
progressively invading the sky, these altocumulus clouds generally
thicken as a whole
Altocumulus resulting from the spreading out of cumulus
6
(or cumulonimbus)
Altocumulus in two or more layers, usually opaque in places or an
7 opaque layer and not progressively invading the sky, or altocumulus
together with altostratus or nimbostratus
Altocumulus with sproutings in the form of small towers or
8 battlements, or altocumulus having the appearance of
cumuliform tufts
9 Altocumulus of a chaotic sky, generally at several levels
Altocumulus, altostratus or nimbostratus are invisible owing to fog,
/ darkness or other surface phenomena, or because of the presence of
a continuous layer of lower cloud
Figure 22. Symbols used to denote the types of medium level cloud present when plotted on a synoptic chart.Cloud symbols used on a synoptic chart for high cloud (CH)
CH = Cirrus (Ci), Cirrocumulus (Cc) and Cirrostratus (Cs)
Symbol Code figure Description
0 No cirrus, cirrocumulus or cirrostratus
Cirrus in the form of filaments, strands or hooks, not progressively
1
invading the sky
Dense cirrus, in patches or entangled sheaves, which usually do not
increase and sometimes seem to be the remains of the upper part of
2
cumulonimbus or cirrus with sproutings in the form of small turrets
or battlements or cirrus having the appearance of cumuilform tufts
Dense cirrus, often in the form of an anvil being the remains of the
3
upper parts of cumulonimbus
Cirrus in the form of hooks or of filaments, or both, progressively
4
invading the sky, they generally become denser as a whole
Cirrus (often in bands converging towards one point or two
opposite points of the horizon) and cirrostratus, or cirrostratus
5 alone, in either case, they are progressively invading the sky, and
generally growing denser as a whole, but the continuous veil does
not reach 45° above the horizon
Cirrus (often in bands converging towards one point or two
opposite points of the horizon) and cirrostratus, or cirrostratus
alone, in either case, they are progressively invading the sky, and
6
generally growing denser as a whole, but the continuous veil
exceeds more than 45° above the horizon, without the sky being
totally covered
7 Veil of cirrostratus covering the celestial dome
Cirrostratus not progressively invading the sky and not completely
8
covering the celestial dome
Cirrocumulus alone, or cirrocumulus accompanied by cirrus or
9
cirrostratus or both, but cirrocumulus is predominant
Cirrus, cirrocumulus or cirrostratus are invisible owing to fog,
/ darkness or other surface phenomena, or because of the presence
or a continuous layer of lower cloud
Figure 23. Symbols used to denote the types of high level cloud present when plotted on a synoptic chart.Cloud Symbols used on a Synoptic Chart (METAR Code C)
Symbol Code figure Description
0 Cirrus (Ci)
1 Cirrocumulus (Cc)
2 Cirrostratus (Cs)
3 Altocumulus (Ac)
4 Altostratus (As)
5 Nimbostratus (Ns)
Stratocumulus (Sc)
6
7 Stratus (St)
8 Cumulus (Cu)
9 Cumulonimbus (Cb)
Figure 24. Symbols used to denote the types of cloud present, using the METAR code, when plotted on a
synoptic chart.
Cloud heights
Cloud heights are measured in feet. For clouds at 5,000 feet or below, the bases are measured in
hundreds of feet, but for bases above 5,000 feet, the bases are measure in multiples of 1,000 feet. In the
METAR code, cloud heights are measured and reported in hundreds or thousands of feet. For example:
000 is a cloud base atTable 4. Cloud height codes. Actual Plotted Actual Plotted Actual Plotted Actual Plotted cloud cloud cloud cloud cloud cloud cloud cloud height height height height height height height height (feet) (feet) (feet) (feet)
Low cloud

             4/30                       6/25                       7/02                         4/15

                                                                                      4 oktas of cumulonimbus
 4 oktas of cumulus          6 oktas of stratocumulus   7 oktas of stratus
                                                                                      capillatus cloud at
 humilis at 3,000 feet       at 2,500 feet              nebulosus at 200 feet
                                                                                      1,500 feet

 Medium cloud

             8/60                       6/62                       4/60                         7/61

                                                                                      7 oktas of altocumulus
 8 oktas of altostratus      6 oktas of altocumulus     4 oktas of altocumulus
                                                                                      of a chaotic sky at
 opacus at 10,000 feet       (type 5) at 12,000 feet    lenticularis at 10,000 feet
                                                                                      11,000 feet

 High cloud

             4/75                       3/70                       8/75                         6/71

 4 oktas of cirrus uncinus   3 oktas of dense cirrus    8 oktas of cirrostratus       6 oktas of cirrocumulus
 (type 1) at 25,000 feet     (type 3) at 20,000 feet    at 25,000 feet                at 21,000 feet

Figure 25. Examples of cloud symbols and heights plotted on a synoptic chart.
Wind (ddff)
The surface wind direction is indicated on the station circle by an arrow flying with the wind, the point
touching the circle. Direction (dd) is measured in degrees from true North. The speed of the wind (ff) is
given by the number of ‘feathers’ on the arrow. The symbols used over the years are as follows:
Wind arrows (ff) used up to 31 December 1913

 Symbol             Beaufort force    Symbol            Beaufort force      Symbol             Beaufort force

                    0–1                                 5–7                                    >10

                    2–4                                 8–10

Figure 26. Wind arrows used before December 1913.
Wind arrows (ff) used between 1 January 1914 and 31 December 1924
Beaufort Speed Beaufort Speed
Symbol Wind Symbol Wind
force (mph) force (mph)
0 Calm =73
Breeze
Strong
6 25–31
breeze
Figure 27. Wind arrows used between January 1914 and December 1924.
Wind arrows (ff) used between 1 January 1925 and 29 March 1936
Beaufort Speed Beaufort Speed
Symbol Wind Symbol Wind
force (mph) force (mph)
0 Calm =73
Breeze
Strong
6 25–31
breeze
Figure 28. Wind arrows used between January 1925 and December 29 March 1936.Wind arrows (ff) used between 30 March 1936 and December 1954
Beaufort Speed Beaufort Speed
Symbol Wind Symbol Wind
force (mph) force (mph)
0 Calm =73
Breeze
Strong
6 25–31
breeze
Figure 29. Wind arrows used between 30 March 1936 and December 1954.Wind arrows (ff) used since 1 January 1955
Symbol Description Symbol Description Symbol Description
Calm 33–37 knots 73–77 knots
1–2 knots 38–42 knots 78–82 knots
3–7 knots 43–47 knots 83–87 knots
8–12 knots 48–52 knots 88–92 knots
13–17 knots 53–57 knots 93–97 knots
18–22 knots 58–62 knots 98–102 knots
Wind direction
23–27 knots 63–67 knots
variable
Wind direction
28–32 knots 68–72 knots given, wind
speed missing
Figure 30. Wind arrows used since January 1955.
Beaufort letters
A code of letters indicating the state of the weather, past or present. The code was originally introduced
by Admiral Beaufort for use at sea but it is equally convenient for use on land. Additions have been made
to the original schedule.
A fully comprehensive list of Beaufort letters follows. Note the symbols used for the individual weather
elements – not all Beaufort letters have a corresponding weather symbol and likewise, not all weather
elements have a Beaufort letter but may have a weather symbol.
State of sky
See cloud amount (pre 1914) section earlier in this fact sheet for Beaufort letters used to describe
cloud amount.Hydrometeors Beaufort letter Symbol Description r Rain r Freezing rain d Drizzle d Freezing drizzle s Snow h Snow pellets h Diamond dust h Hail h Small hail h Ice pellets sh Snow grains f Fog f Ice fog fe Wet fog fg/fs Patches of shallow fog over land/sea fg/fs More or less continuous shallow fog over land/sea
Beaufort letter   Symbol          Description

 m                                 Mist

 ks                                Drifting and blowing snow

 ks                                Drifting snow

 ks                                Blowing snow

                                   Spray

 w                                 Dew

 w                                 Advection dew

 w                                 White dew

 x                                 Hoar frost

 x                                 Advection hoar frost

                                   Rime

                                   Soft rime

                                   Hard rime

                                   Clear ice

                                   Glaze

                                   Sprout

Figure 31. Hydrometeors – a generic term for products of condensation and sublimation of atmospheric
water vapour.
Mixed precipitation
Beaufort letter Symbol Description
dr Drizzle and rain
rs Rain and snow (sleet)
hs Hail and snow
hr Hail and rain
Figure 32. Beaufort letters denoting mixed precipitation.
Lithometeors
Beaufort letter Symbol Description
z Haze
Dust haze
Smoke
Drifting and blowing dust or sand
Drifting dust or sand
Blowing dust or sand
Duststorm or sandstorm
Wall of dust or sand
Dust whirl or sand whirl (dust devil)
Figure 33. Lithometeors – a little-used generic term for non-aqueous solid particles suspended in the air or
lifted from the Earth’s surface.Electrometeors
Beaufort letter Symbol Description
tl Thunderstorm
l Lightning
St Elmo’s fire
Polar aurora
Figure 34. Electrometeors – a little-used generic term for the visible or audible manifestation of
atmospheric electricity.
Photometeors
Beaufort letter Symbol Description
Solar halo
Lunar halo
Solar corona
Lunar corona
Irisation
Glory
Rainbow
Fog-bow
Bishop’s ring
Mirage
Zodiacal light
Figure 35. Photometeors – a little-used generic term for optical phenomena in the atmosphere.Miscellaneous Beaufort letter Symbol Description j Phenomena within sight of but not at the station e Wet air, without rain falling y Dry air (less than 60% relative humidity) u Ugly threatening sky v Abnormally good visibility p Shower (used in conjunction with a type of precipitation) Figure 36. Beaufort letters used for miscellaneous meteorological phenomena. Surface wind Beaufort letter Symbol Description g Gale: mean speed 34–47 knots over a period of ten minutes or more G Storm: mean speed 48 knots or more over a period of ten minutes or more Q Squall kq Line squall Figure 37. Beaufort letters used to describe the strength of the surface wind.
Recording Beaufort letters
When recording Beaufort letters, it is helpful to give an indication of the intensity and continuity of
the weather elements being observed. More than one Beaufort letter can be used if, for example, the
precipitation is in the form of showers.
The type of precipitation is indicated by the appropriate Beaufort letter or combination of letters if there is
a mixture of precipitation. For example:

 Beaufort letter    Description

 d                  Drizzle

 r                  Rain

 dr                 Drizzle and rain

Figure 38. Beaufort letters used to describe the type of precipitation present.
If the precipitation is of the showery type (falling from convective cloud), the prefix ‘p’ is used in
combination with the type of precipitation. For example:

 Beaufort letter    Description

 pr                 Shower or rain

 ps                 Shower of snow

Figure 39. Beaufort letters used to describe the nature of precipitation present.
Beaufort letters can also be used to describe the intensity of the precipitation.
• Slight – by the addition of the subscript ‘o’ to a small Beaufort letter. For example:

 Beaufort letter    Description

 ro                 Slight rain

 so                 Slight snow

 pro                Slight shower of rain

Figure 40. Beaufort letters used to describe precipitation of slight intensity.
• Moderate – by a small Beaufort letter. For example:

 Beaufort letter    Description

 r                  Moderate rain

 s                  Moderate snow

 pr                 Shower of rain

Figure 41. Beaufort letters used to describe precipitation of moderate intensity.
• Heavy – by a capital Beaufort letter. For example:

 Beaufort letter    Description

 R                  Heavy rain

 S                  Heavy snow

 pR                 Heavy shower of rain

Figure 42. Beaufort letters used to describe precipitation of heavy intensity.
• Violent – by the addition of the subscript ‘2’ to the capital Beaufort letter. For example:

 Beaufort letter    Description

 pR2                Violent shower of rain

Figure 43. Beaufort letters used to describe precipitation of violent intensity.
When mixed precipitation occurs, such as drizzle and rain, or rain and snow, the intensity of each type is
not given separately, but the intensity of the heaviest precipitation is used to denote the intensity of all the
other types in the mixture. For example:

 Beaufort letter    Description

 dr                 Slight drizzle and moderate rain

Figure 44. Beaufort letters used to describe mixed precipitation of mixed intensities.
The intensity of a thunderstorm is judged by the intensity of the thunder and lightning, whilst the
intensity of the precipitation in the storm is indicated separately. For example:

 Beaufort letter    Description

 TLro               Heavy thunderstorm with slight rain

 tloR               Slight thunderstorm with heavy rain

Figure 45. Beaufort letters used to describe the intensity of thunderstorms and the intensity of the
precipitation falling during the thunderstorm.
When showers are reported, the qualification of intensity is given to the precipitation, but not to the
shower prefix ‘p’. For example:

 Beaufort letter    Description

 pro                Slight shower of rain

 pr                 Shower of rain

 pR                 Heavy shower of rain

Figure 46. Beaufort letters used to describe the intensity of showers.
The continuity of the precipitation can also be indicated using Beaufort letters. Precipitation falling
from layer cloud is described by letters referring to the continuity as well as to the type of intensity in
accordance to the following rules:
1. Intermittent precipitation – the Beaufort letters indicating the type and intensity of the precipitation
   are prefixed by the letter ‘i’. For example:

 Beaufort letter     Description

 iro                 Intermittent slight rain

 iS                  Intermittent heavy snow

 idr                 Intermittent moderate drizzle and rain

 The prefix indicates that there has been a break or breaks occurring at intervals of less than one hour in the
 overall period of the precipitation. Note that an individual break lasting one hour or more requires subsequent
 precipitation to be recorded as the commencement of another period.

Figure 47. Beaufort letters to describe the intermittent nature of the precipitation.
2. Continuous precipitation – the Beaufort letter(s) indicating the type and intensity of the precipitation
   are repeated. For example:

 Beaufort letter     Description

 roro                Continuous slight rain

 SS                  Continuous heavy snow

 dorodoro            Continuous slight drizzle and rain

 The repetition indicated that the period of precipitation has lasted for at least one hour without a break.

Figure 48. Beaufort letters to describe the continuous nature of the precipitation.
3. Precipitation not specified as intermittent or continuous: the Beaufort letter(s) indicating the type and
   intensity of the precipitation are used alone. For example:

 Beaufort letter    Description

 R                  Heavy rain

 do                 Slight drizzle

 dr                 Moderate drizzle and rain

 This indicates that the period of precipitation has not lasted for one hour to qualify as continuous, and that there
 have been no breaks to qualify it as intermittent.

Figure 49. Beaufort letters to describe the intensity of the precipitation.
4. Changes of type and/or intensity. During a period of precipitation a change of type and/or intensity
   is indicated by successive use of letters descriptive of each new type or intensity. Repetition of letters
   to indicate continuity will be appropriate only when precipitation of one particular type and intensity
   has continued for at least one hour without a break. A change in type or intensity of continuous
   precipitation where the new type or intensity does not last for one hour will require the use of a
   single letter as described above. At each change of type and/or intensity it is necessary to record all
   the appropriate letters in the order specified and a comma is placed between each group of letters.
   For example:

 Beaufort letter    Description

                    Total cloud amount 6/8-8/8 with continuous slight rain, then total cloud amount 6/8-8/8
 croro cr           with moderate rain, then total cloud amount 6/8-8/8 with slight rain, then total cloud
 cro cdoro          amount 6/8-8/8 with continuous slight drizzle and rain

Figure 50. Beaufort letters to describe the changes in intensity of the precipitation during the reporting period.
When reporting any type of atmospheric obscurity, for example, fog or mist, it is possible to give an indication as to the thickness of this type of phenomena. • Fog – whenever the visibility is reduced to less than 1,000 metres and the obscuration is caused by fog, the letter ‘f’ (fog) will be used down to and including 200 metres, and the capital letter ‘F’ (thick fog) when the visibility is less than 200 metres. When patches of fog exist, the prefix ‘i’ is used to denote intermittent fog. For example: Beaufort letter Description if Fog patches with visibility below 1,000 metres but at or above 200 metres F Thick fog with visibility below 200 metres iF Thick fog patches with visibility below 200 metres Figure 51. Beaufort letters to describe the thickness and/or continuous nature of fog. • Mist – this is when the visibility is 1,000 metres or more and the relative humidity is between 95 and 100 %. The Beaufort letter used is ‘m’. The capital letter ‘M’ is never used. • Haze – this is when the visibility is 1,000 metres or more but the relative humidity is less than 95%. The Beaufort letter used is ‘z’. When a given weather phenomena is within sight but not actually falling at the station it is possible to indicate this using Beaufort letters. The letter ‘j’ is used in combination with various other Beaufort letters to record phenomena occurring within sight of but not at the station. For example: Beaufort letter Description jp Precipitation within sight jf Fog within sight jks Drifting snow within sight No qualification of intensity or indication of the type of precipitation is applied to adjacent precipitation, ‘jp’, even though this might be surmised. Adjacent precipitation is not used to describe a shower which was previously reported at the station and is still visible on the horizon. Figure 52. Beaufort letters to describe the locality of the precipitation in relation to the position of the observer.
Present weather symbols used on a synoptic chart from manned stations

 Code figure        Symbol             Description

 ww=00 to 19: No precipitation, fog (except for 11 and 12), duststorm, sandstorm, drifting or blowing snow at
 the station at the time of observation or, except for 09 and 17, during the preceding hour

 00                                    Cloud development not observed or observable

                                       Cloud(s) dissolving or becoming less developed. Characteristic state of sky
 01                                    during the past hour

 02                                    State of sky on the whole unchanged

 03                                    Cloud(s) generally forming or developing

 04                                    Visibility reduced by smoke haze

 05                                    Haze

                                       Widespread dust in suspension in the air, not raised by wind at or near
 06                                    station at the time of observation

                                       Dust or sand raised by the wind at or near the station at the time of
 07                                    observation, but not well developed dust whirl(s), and no sandstorm seen;
                                       or, in the case od ships, blowing spray at the station

                                       Well developed dust whirl(s) or sand whirl(s) seen at or near the station
 08                                    during the preceding hour or at the time of observation, but no duststorm
                                       or sandstorm

                                       Duststorm or sandstorm within sight at the time of observation, or at the
 09                                    station during the preceding hour

 10                                    Mist

 11                                    Patches of shallow fog or ice fog

                                       More or less continuous shallow fog or ice fog less than 2 metres on land
 12                                    or 10 metres at sea

 13                                    Lightning seen, no thunder heard

 14                                    Precipitation with sight, not reaching the ground or the surface of the sea

                                       Precipitation with sight, reaching the ground or the surface of the sea,
 15                                    but distant (estimated to be more than 5 km from the station)

                                       Precipitation within sight, reaching the ground or the surface of the sea,
 16                                    near to, but not at the station

 17                                    Thunderstorm, but no precipitation at the time of observation

                                       Squall(s) at or within sight of the station during the preceding hour or at
 18                                    the time of observation

                                       Funnel cloud(s) at or within sight of the station during the preceding hour
 19                                    or at the time of observation

Figure 53. Present weather code and weather symbols.
Present weather symbols used on a synoptic chart from manned stations
Code figure Symbol Description
ww=20 to 29: Precipitation, fog, ice fog or thunderstorm at the station during the preceding hour not at the time
of observation
20 Drizzle (not freezing) or snow grains, not falling as showers
21 Rain (not freezing), not falling as showers
22 Snow, not falling as showers
23 Rain and snow or ice pellets, not falling as showers
24 Freezing drizzle or freezing rain, not falling as showers
25 Shower(s) of rain
26 Shower(s) of snow, or of rain and snow
27 Shower(s) of hail, or of rain and hail
28 Fog or ice fog
29 Thunderstorm (with or without precipitation)
ww=30 to 39: Duststorm, sandstorm, drifting or blowing snow
Slight or moderate duststorm or sandstorm – has decreased during
30 the preceding hour
Slight or moderate duststorm or sandstorm – no appreciable change
31 during the preceding hour
Slight or moderate duststorm or sandstorm – has begun or increased
32 during the preceding hour
33 Severe duststorm or sandstorm – has decreased during the preceding hour
Severe duststorm or sandstorm – no appreciable change during
34 the preceding hour
Severe duststorm or sandstorm – has begun or increased during
35 the preceding hour
36 Slight or moderate drifting snow, generally low (below eye level)
37 Heavy drifting snow, generally low (below eye level)
38 Slight or moderate drifting snow, generally high (above eye level)
39 Heavy drifting snow, generally high (above eye level)
Figure 53. Present weather code and weather symbols.Present weather symbols used on a synoptic chart from manned stations
Code figure Symbol Description
ww=40 to 49: Fog or ice fog at the time of observation
Fog or ice at a distance at the time of observation, but not at the station
40 during the preceding hour, the fog or ice fog extending to a level above
that of the observer
41 Fog or ice fog in patches
42 Fog or ice fog, sky visible, has become thinner during the preceding hour
43 Fog or ice fog, sky obscured, has become thinner during the preceding hour
44 Fog or ice fog, sky visible, no appreciable change during the preceding hour
45 Fog or ice fog, sky obscured, no appreciable change during the preceding hour
Fog or ice fog, sky visible, has begun or become thicker during the
46 preceding hour
Fog or ice fog, sky obscured, has begun or become thicker during the
47 preceding hour
48 Fog, depositing rime, sky visible
49 Fog, depositing rime, sky obscured
ww=50 to 59: Drizzle
50 Drizzle, not freezing, intermittent – slight at the time of observation
51 Drizzle, not freezing, continuous – slight at the time of observation
52 Drizzle, not freezing, intermittent – moderate at the time of observation
53 Drizzle, not freezing, continuous – moderate at the time of observation
54 Drizzle, not freezing, intermittent – heavy (dense) at the time of observation
55 Drizzle, not freezing, continuous – heavy (dense) at the time of observation
56 Drizzle, freezing, slight
57 Drizzle, freezing, moderate or heavy (dense)
58 Drizzle and rain, slight
59 Drizzle and rain, moderate or heavy (dense)
Figure 53. Present weather code and weather symbols.Present weather symbols used on a synoptic chart from manned stations Code figure Symbol Description ww=60 to 69: Rain 60 Rain, not freezing, intermittent – slight at the time of observation 61 Rain, not freezing, continuous – slight at the time of observation 62 Rain, not freezing, intermittent – moderate at the time of observation 63 Rain, not freezing, continuous – moderate at the time of observation 64 Rain, not freezing, intermittent – heavy at the time of observation 65 Rain, not freezing, continuous – heavy at the time of observation 66 Rain, freezing, slight 67 Rain, freezing, moderate or heavy 68 Rain, or drizzle and snow, slight 69 Rain, or drizzle and snow, moderate or heavy ww=70 to 79: Solid precipitation not in showers 70 Intermittent fall of snowflakes – slight at the time of observation 71 Continuous fall of snowflakes – slight at the time of observation 72 Intermittent fall of snowflakes – moderate at the time of observation 73 Continuous fall of snowflakes – moderate at the time of observation 74 Intermittent fall of snowflakes – heavy at the time of observation 75 Continuous fall of snowflakes – heavy at the time of observation 76 Diamond dust (with or without fog) 77 Snow grains (with or without fog) 78 Isolated star-like snow crystals (with or without fog) 79 Ice pellets Figure 53. Present weather code and weather symbols.
Present weather symbols used on a synoptic chart from manned stations

 Code figure       Symbol             Description

 ww=80 to 89: Showery precipitation, or precipitation with current or recent thunderstorms

 80                                   Rain shower(s), slight

 81                                   Rain shower(s), moderate or heavy

 82                                   Rain shower(s), violent

 83                                   Shower(s) or rain and snow mixed, slight

 84                                   Shower(s) or rain and snow mixed, moderate or heavy

 85                                   Snow shower(s), slight

 86                                   Snow shower(s), moderate or heavy

                                      Shower(s) of snow pellets or small hail, with or without rain or rain and
 87                                   snow mixed, slight

                                      Shower(s) of snow pellets or small hail, with or without rain or rain and
 88                                   snow mixed, moderate or heavy

                                      Shower(s) of hail, with or without rain or rain and snow mixed, not
 89                                   associated with thunder, slight

 ww=90 to 94: Thunderstorm during the preceding hour but not at the time of observation

                                      Shower(s) of hail, with or without rain or rain and snow mixed, not
 90                                   associated with thunder, moderate or heavy

 91                                   Slight rain at the time of observation

 92                                   Moderate or heavy rain at the time of observation

 93                                   Slight snow, or rain and snow, or hail at the time of observation

                                      Moderate or heavy snow, or rain and snow mixed, or hail at the time
 94                                   of observation

 ww=95 to 99: Thunderstorm at the time of observation

                                      Thunderstorm, slight or moderate, without hail but with rain and/or snow
 95                                   at the time of observation

 96                                   Thunderstorm, slight or moderate, with hail at the time of observation

                                      Thunderstorm, heavy, without hail but with rain and/or snow at the time
 97                                   of observation

                                      Thunderstorm, combined with duststorm or sandstorm at the time of
 98                                   observation

 99                                   Thunderstorm, heavy, with hail at the time of observation

Figure 53. Present weather code and weather symbols.
Weather elements used in the METAR code
Intensity Description Precipitation Obscuration Others
PO Well developed
– Light MI Shallow DZ Drizzle BR Mist
dust/sand whirls
Moderate PR Partial RA Rain FG Fog SQ Squalls
FC Funnel clouds
+ Heavy BC Patches SN Snow FU Smoke including tornadoes
and waterspouts
VC Vicinity DR Low drifting SG Snow grains VA Volcanic ash SS Sand storm
BL Blowing IC Ice crystals DU Widespread dust DS Dust storm
SH Showers PL Ice pellets SA Sand CB Cumulonimbus
TCU Towering
TS Thunderstorms GR Hail HZ Haze
cumulus
FZ Freezing GS Small hail PY Spray
UP Unknown
Figure 55. Present weather code and symbols used when plotting METAR observations.
Some examples of present weather codes used in a METAR
TSRA – Moderate thunderstorm with rain
RASH – Moderate rain shower(s)
VCFG – Fog in the vicinity
RASN – Moderate rain and snow (sleet)
MIFG – Shallow fog
+RA – Heavy rain
+SNSH – Heavy snow shower(s)
–RASH – Slight rain shower(s)
METAR observations only report the weather at the time of observation. No past weather elements are
reported as would be the case with the synoptic code.Present weather symbols used on early synoptic charts and Daily Weather Reports
Symbol Description
Rain
Snow
Rain and snow (sleet)
Hail
Fog
Mist
Thunder
Thunderstorm
Sea disturbance-rough
Sea disturbance-high
Figure 56. Present weather symbols used on early synoptic charts.Past weather symbols used on synoptic charts
Code figure Symbol Description
0 Cloud cover 1/2 or less of the sky throughout the appropriate period
Cloud cover 1/2 or less for part of the appropriate period and more than 1/2
1 for part of the period.
2 Cloud cover more than 1/2 of the sky throughout the appropriate period
3 Duststorm, sandstorm or blowing snow — visibility less than 1,000 metres
4 Fog or thick haze
5 Drizzle
6 Rain
7 Snow
8 Showers
9 Thunderstorm, with or without precipitation
Figure 57. Past weather symbols used on synoptic charts.Pressure tendency
Symbol Description of curve Pressure now compared with three hours ago
Rising, then falling Higher
Rising, then steady Higher
Rising Higher
Falling, then rising Higher
Falling, then rising Lower
Falling, then steady Lower
Falling Lower
Rising, then falling Lower
Figure 58. Pressure tendency.
Visibility
Surface visibilities as used in the Daily Weather Reports.
Code for surface visibility Objects not visible at: Description
0 55 yards Dense fog
1 220 yards Thick fog
2 550 yards Fog
3 1100 yards Moderate fog
4 1.25 miles Mist or haze
5 2.5 miles Poor visibility
6 6.25 miles Moderate visibility
7 12.25 miles Good visibility
8 31 miles Very good visibility
9 >31 miles Excellent visibility
Figure 59. Description of visibility used in Daily Weather Reports.Visibility values as used on synoptic charts
1. The 90-99 decade is always employed in ship reports for the reason that horizontal visibility cannot be
determined with greater accuracy at sea.
2. If the horizontal visibility is not the same in different directions, the shorter distance is coded.
3. If the observed horizontal visibility is between two of the distances given in the table, the code figure
for the shorter distance is reported.
4. In the international scale the distances for all code figures are expressed in metres. The visibilities listed
above are the equivalent distances in nautical miles.
Visibility values as used on synoptic charts
• For visibilities equal to or less than 5 km
Land stations only
Distance Distance Distance
Code Code Code
figure figure figure
km yards km yards km yards
00You can also read