Weinam Creek Weinam Creek - Redland City Council
←
→
Page content transcription
If your browser does not render page correctly, please read the page content below
Weinam Creek   Weinam Creek
               Market Assessment Report

               October 2013

               Prepared for Redland City Council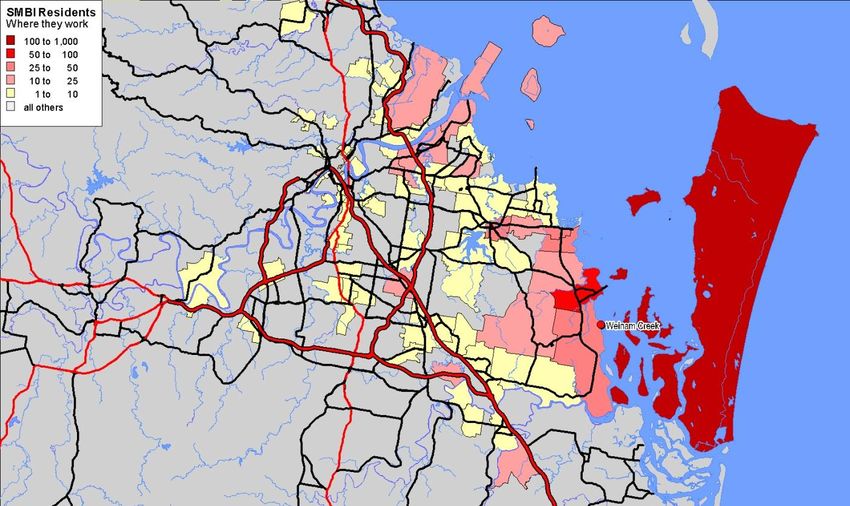
Table of Contents
1 Executive Summary                                                                        1
2 Introduction                                                                             4
  2.1   Weinam Creek Priority Development Area                                             4
3 Background Information Review                                                            6
  3.1   Redland Bay Centre and Foreshore Master Plan, 2009                                 6
  3.2   Recent and Emerging Development Activity                                           6
4 Demographic and Employment Trends                                                        8
  4.1   Population Forecasts for Retail Development                                      12
  4.2   Employment Trends in Redland Bay                                                 13
5 Retail Development Opportunities                                                       18
  5.1   Competition                                                                      18
  5.2   Future Demand at Weinam Creek                                                    19
6 Residential Market Opportunities                                                       24
  6.1   Residential Approvals and Recent Growth                                          24
  6.2   Median Sales Prices                                                              27
  6.3   Unit / Apartment Market                                                          27
  6.4   Waterfront Housing Market                                                        29
7 Marina Market                                                                          30
  7.1   Overview                                                                         30
  7.2   Competition                                                                      31
  7.3   Demand                                                                           34
8 Other Development Opportunities                                                        37
  8.1   Health Services                                                                  37
  8.2   Short-term Accommodation                                                         38
  8.3   Retirement Living and Aged Care                                                  39

                                                       Weinam Creek: Market Assessment Report
List of Tables
Table 1: Demographic Characteristics, Redland Bay Compared to Greater Brisbane, 2011 ........9
Table 2: Population Forecasts, Redland Bay and SMBI, 2011-2031 ...........................................12
Table 3: Employment in Redland Bay, 2011-2031 .......................................................................13
Table 4: Dining Precinct, Potential Demand at Weinam Creek PDA ...........................................23
Table 5: Retirement Units Forecasts, Redland Bay and Redland LGA .......................................42

List of Figures
Figure 1: Weinam Creek Priority Development Area .....................................................................4
Figure 2: Age Profile, Redland Bay/SMBI compared to Greater Brisbane, 2011 ........................10
Figure 3: Housing Ownership Profile, Redland Bay/SMBI compared to Greater Brisbane, 201110
Figure 4: Dwelling Stock Profile, Redland Bay/SMBI compared to Greater Brisbane, 2011 .......11
Figure 5: Family Type, Redland Bay/SMBI compared to Greater Brisbane, 2011 ......................11
Figure 6: Income Profile, Redland Bay/SMBI compared to Greater Brisbane, 2011 ...................12
Figure 7: Redland Bay Residents, Where they Work, 2011 .........................................................15
Figure 8: Redland Bay Workforce, Where they Reside, 2011 .....................................................16
Figure 9: SMBI and North Stradbroke Residents, Where they Work, 2011 .................................17
Figure 10: Building Approvals, Redland Bay and Redland LGA, 2007-2013 ...............................25
Figure 11: Population Density, Weinam Creek and Environs, 2011 ............................................26
Figure 12: Median House and Sales Prices, Redland Bay, 2005-2012 .......................................27
Figure 13: Queensland Boat Registrations, 1996-2012 ...............................................................31
Figure 14: Weinam Creek Marina Catchment Area Competition Map .........................................34
Figure 15: Registered Vessels over 10 Metres within Catchment*, 2002-2012 ...........................36

                                                                           Weinam Creek: Market Assessment Report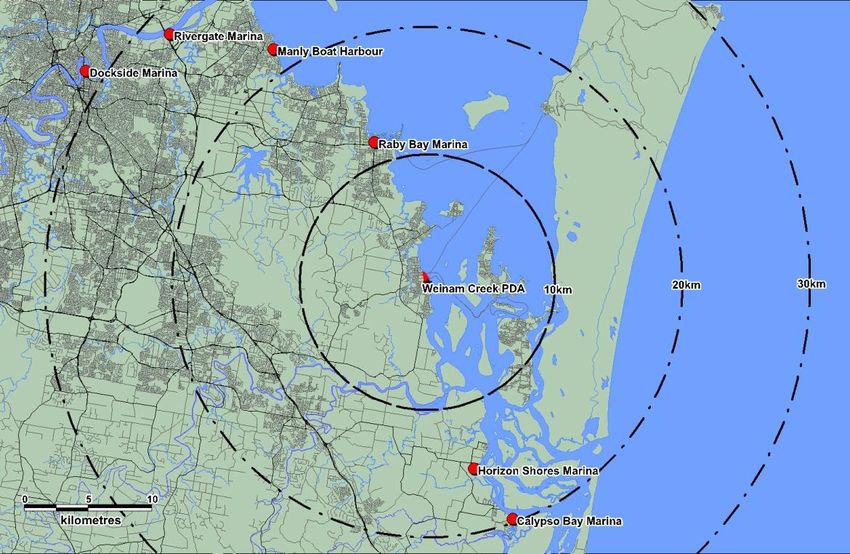
Disclaimer
The material contained in this report is confidential and was provided by Jones Lang LaSalle to
the party to whom it is addressed strictly for the specific purpose to which it refers and no
responsibility is accepted to any third party.

Neither Jones Lang LaSalle nor any of its associates have any other interests (whether
pecuniary or not and whether direct or indirect) or any association or relationships with any of its
associates that might reasonably be expected to be or have been capable of influencing Jones
Lang LaSalle in providing this report.

Neither the whole of the report nor any part or reference thereto may be published in any
document, statement or circular or in any communication with third parties or distributed without
Jones Lang LaSalle’s prior written approval.

Whilst the material contained in the report has been prepared in good faith and with due care by
Jones Lang LaSalle, no representations or warranties are made (express or implied) as to the
accuracy of the whole or any part of the report.

Jones Lang LaSalle, its officers, employees, subcontractors and agents shall not be liable
(except to the extent that liability under statute or by operation of law cannot be excluded) for
any loss, liability, damages or expense suffered by any party resulting from their use of this
report.

If a projection has been made in respect of future demand, business trends, property prices,
rentals and projected take up rates, such a projection is an estimate only and represents only
one possible result therefore should at best be regarded as an indicative assessment of
possibilities rather than absolute certainties. The process of making forward projections of such
key elements involves assumptions about a considerable number of variables that are acutely
sensitive to changing conditions and variations, and any one of which may significantly affect the
resulting projections. This must be kept in mind whenever such projections are considered.

The financial analysis and conclusions contained within this report do not purport to represent a
valuation in the conventional sense. It is an exercise involving only relatively few variables, such
as zoning information and a general knowledge of background market conditions; whereas, a
valuation involves a detailed investigation of the property including, where appropriate, the
nature of the locality, surrounding properties, full inspection, site peculiarities, the nature, quality
and condition of improvements, comparable sales, market trends, yields, competition, design
and layout and so on. The market value could be greatly affected by such factors, and by
encumbrances, restrictions, or other impediments on Title which have not been considered in
this report. Accordingly, the financial analysis contained herein is indicative only and not
authoritative. It is merely a precursor to a formal valuation and should not be taken as a
substitute for it.

                                                                 Weinam Creek: Market Assessment Report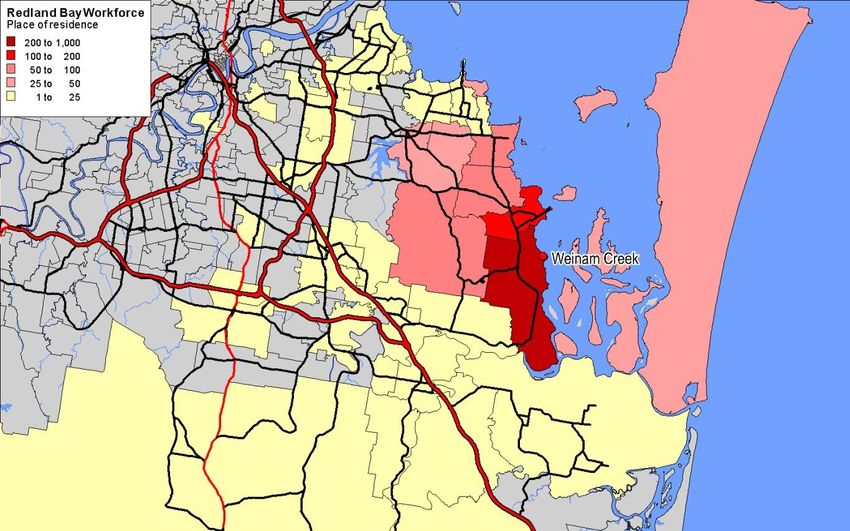
1 Executive Summary
The development opportunity at Weinam Creek will provide for a major catalyst to transform the
waterfront of Redland Bay and enhance the amenity and functionality of this busy local
community hub. Unique to the site is the role it plays as serving as the primary commuter node
for residents of the Southern Moreton Bay Islands (SMBI), some 5,800 people. The importance
of this role will only continue to increase as this population increases to around 9,000 by 2031.
The initial development strategy for the site has been informed by an analysis of the market
drivers and performance for the range of likely supportable land uses and considered in the
context of local market characteristics including demographic profile. This has been evaluated
against the site specifics including the unique elements of prime ocean frontage, a working
harbour element, commuter role, and proximity to surrounding influences including community
uses and the Redland Bay Village. A review of previous studies and background information
has also been undertaken to ensure a holistic approach to reviewing the site and forming a view
on the development potential.
A summary of this assessment is outlined below.
Economic and Demographic Profile
Weinam Creek is currently situated at the southern end of the Redland LGA within the suburb of
Redland Bay. It is an area that has a robust level of population growth, driven by coastal
lifestyle factors rather than a strong concentration of employment bases. This is highlighted by
the relatively low level of employment self-sufficiency for Redland Bay at 25.7% as at the 2011
Census.
The population of Redland Bay was 14,284 in June 2012, up from 14,006 in June 2011 (2.0%
growth). The estimated resident population of SMBI in June 2011 was 5,844, rising to an
estimated 5,914 in June 2012 (1.2% growth). This solid growth was in line with the growth within
the Greater Brisbane metropolitan area. Population growth is forecast to be particularly strong
for both Redland Bay and the SMBI catchments over the short and medium term, averaging
around 2.5% and 2.1% for the two catchments respectively for the decade to 2021.
The main characteristics of the Redland Bay population (compared with Greater Brisbane) are:
A relatively high proportion of children (24% under 15 years; 20.1% in Greater
Brisbane);
A large population from the UK (9.2%; 5.6% in Greater Brisbane);
Relatively high level of home ownership (73.9% either own or are buying their home;
65.5% in Greater Brisbane);
Dominance of separate dwellings – 98% of all dwellings;
Dominance of family households with very few lone person and group households;
Individual incomes for Redland Bay residents are in line with Greater Brisbane while average
household incomes are 5.5% higher, reflecting the larger average household size, which
translates to more households with more than one income earner. Incomes of SMBI residents
are considerably lower.
Weinam Creek: Market Assessment Report, Page 1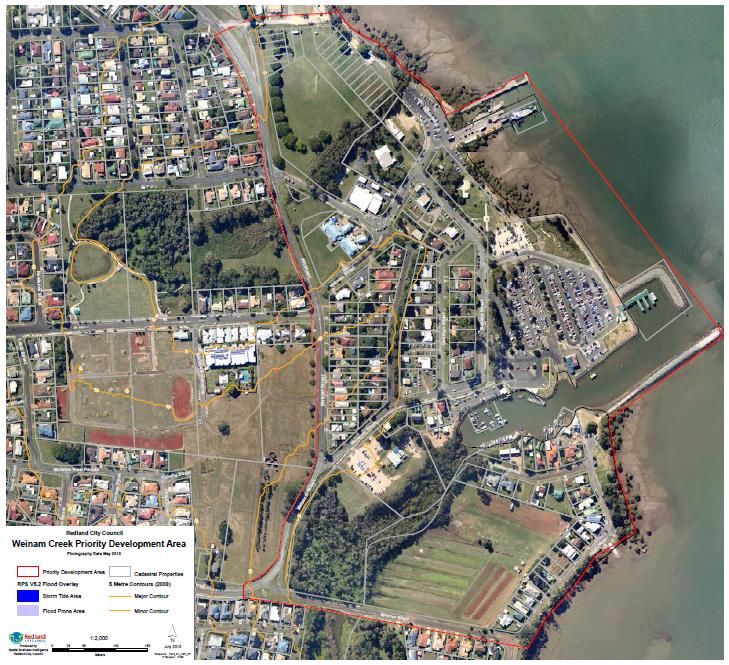
Retail Development Opportunities

Retail development within the PDA is a critical component of the urban renewal of Weinam
Creek, helping to create activity, a sense of community and identity as well as supporting other
commercial and residential activity.

Weinam Creek should complement rather than compete with the existing nearby Redland Bay
Shopping Village, which has been rezoned to develop as a District Shopping Centre,
incorporating a large supermarket.

Achieving both local buy-in from its primary catchment of Redland Bay as well as providing
services to residents of SMBI are critical to the success of a retail development at Weinam
Creek.

While a full-line supermarket could be supported at Weinam Creek, Redland Bay Shopping
Village is recommended as a superior location for such an anchor tenant. This is for a wide
range of reasons including but not limited to: to the better retailing alignment with grocery
shopping with other town centre uses, the ability to fully utilise high value waterfront land for
higher and better uses delivering a stronger economic return, and enabling waterfront land to be
utilised for activities that are consistent with the vision for the site in creating a strong mixed use
destination.

Retailing at Weinam Creek could focus on leisure / lifestyle and incorporate a restaurant / dining
precinct of 800-900 square metres. Possible uses include day spas, health and beauty services,
boating related retail products, leisure wear, specialty food retailing and local services to serve
both residents and ferry patrons.

Café / dining precincts are difficult to support in isolation but are a core land use in most
successful waterfront precincts. Leveraging the water views will be important, but design will be
critical to ensure maximum potential for activation and through linkages to other activators on or
adjoining the site.

The amount of retailing supportable will largely depend on how much of a destination Weinam
Creek can become. We do not consider that the retail component will be the primary attraction at
Weinam Creek. A marina, tourism associated with it being the gateway to SMBI and its
waterfront location are considered more likely to create the destination appeal.

Residential Development Opportunities

Redland Bay has experienced limited residential development in the past two years, but has
seen strong growth over the past decade.

Residential estates of note in Redland Bay include AMEX Corporation’s Valencia Springs and
Fiteni Homes’ Redland Bay Grove. Longer term, the proposed development of Shoreline has the
potential to provide significant population growth for an extended period of time for the suburb.

The market for apartments and units is expected to be shallow, at least in the short to medium
term as 98% of all stock is detached housing. However, factors such as proximity to a new
marina, water views, high quality amenity and proximity to services will all drive the market for
higher density residential development.

In the early stages of development, we recommend providing small lot terrace and townhouse
packages as a first step towards increased residential densities. This would be followed by
smaller apartment projects as densities increase"

                                                         Weinam Creek: Market Assessment Report, Page 2
Marina Development Opportunities

A marina at Weinam Creek would provide direct access to open water and the Southern
Moreton Bay Islands (SMBI).

A marina has the potential to anchor an attractive precinct, incorporating retailing (convenience
based; leisure / lifestyle; cafes and restaurants), a tavern, housing and marine related uses.

The main market for wet berths will come from boat owners with vessels at least 10 metres in
size, from Redland LGA and to a lesser extent, from Logan LGA and Brisbane South.

Weinam Creek may be preferred to alternative locations such as Manly Boat Harbour due to its
smaller scale.

We consider a marina of around 200 berths should be supportable over the next 15-20 years,
with demand coming from existing nearby boat owners with a preference for Weinam Creek over
their existing berth as well as expected growth in boat ownership in the main catchment of
Redland LGA, Logan LGA and Brisbane South.

The marina could be developed in three stages to take into account the growing demand for
marina berths as the population base increases.

The marina appears particularly well suited to Weinam Creek due to two key factors. The first is
financial feasibility due to existing deeper water conditions requiring less dredging and pre-
existing infrastructure. Secondly, the ability to develop the marina as a stand-alone component
is considered a major plus that enables the marina to be ‘bolted on’ as market demand
conditions support it.

Other Development Opportunities

The main location for health services in Redland LGA is at Cleveland (two hospitals and
supporting allied health services). With solid population growth, there is expected to be future
demand for a more comprehensive medical and health services clinic, such as a GP Super
Clinic. A GP Super Clinic is expected to require a site of around 5,000 square metres. Weinam
Creek could accommodate such a facility.

We see a major opportunity for future retirement living with Redland LGA set to experience very
strong growth in its population aged 65 and over (from 21,496 in 2011 to 52,728 in 2031, an
increase of 31,252). This will support additional retirement villages / accommodation.

Over 3,000 additional retirement units will be supportable across Redland LGA to 2031. With
large sites in the northern suburbs of Redland LGA becoming rarer, a sizable proportion of this
demand could be accommodated in Redland Bay, including Weinam Creek.

Over time, integrated communities including retirement living and other complementary uses,
multi-storey complexes and small clusters of retirement units are likely to be demanded by an
ever evolving sector. The lifestyle / leisure attributes of Weinam Creek are well suited to attract
this important market sector.

                                                       Weinam Creek: Market Assessment Report, Page 3
2 Introduction
2.1 Weinam Creek Priority Development Area
The Weinam Creek Priority Development Area (PDA) was declared by the Minister for State
Development, Infrastructure and Planning in response to a request from Redland City Council
on 21 June 2013. The declared area is located in Redland Bay, covers an area of 42 hectares
and incorporates the Weinam Creek Marina.
It is envisaged that the designated area will support a mixed use residential, tourism and retail
based development. The importance of Weinam Creek and its ferry terminal is of particular
significance as the gateway to the Southern Moreton Bay Islands, providing access for the
island residents to shopping, health, education, employment and entertainment opportunities
throughout the Redlands and the greater Brisbane area. It is therefore an important link between
the Southern Moreton Bay Islands and the mainland. It has the potential to provide a regional
focus for Redland Bay; an area that continues to grow.
Figure 1: Weinam Creek Priority Development Area
Weinam Creek: Market Assessment Report, Page 4The vision for the Weinam Creek PDA as outlined on the Department of State Development,
Infrastructure and Planning’s website is reproduced below:
Establishing new water transport services and support facilities at Weinam Creek
Improving water front amenity through the consolidation of facilities and the
improvements of public open space
Providing appropriate infrastructure that meets market expectations for safety, comfort,
convenience, information and service delivery
Creating an accessible and connected place, featuring high quality public transport
integrated with a safe and convenient walking and cycling network
Reinforcing Weinam Creek as a community focus and a regional Gateway to Moreton
Bay
Creating a sense of place with communal areas providing opportunities for networking
and social interaction
Creating opportunities for mixed use and medium density residential development
Weinam Creek: Market Assessment Report, Page 53 Background Information Review
3.1 Redland Bay Centre and Foreshore Master Plan, 2009
The Redland Bay Centre and Foreshore Master Plan (the Master Plan) articulates Redland City
Council’s vision for the future development of this area. It was undertaken prior to the State
granting the Weinam Creek Precinct Priority Development Area (PDA) status.
The area covered by the Master Plan extends to the north of the PDA, encompassing Redland
Bay Centre, a small commercial and retail precinct and the main retail precinct located in
Redland Bay. Weinam Creek and Redland Bay Centre are surrounded by adjoining residential
areas.
The Master Plan identifies a number of aims, issues and priorities for realising the potential of
this important foreshore area. Some of the key points are summarised briefly below:
Transport issues / Marine activity – The Master Plan recognises the long-term importance of
the marine industry in providing ferry services to and from the Southern Moreton Bay Islands is a
significant land use, but recognises that some of the infrastructure needs rationalising /
upgrading. The use of Weinam Creek as long term parking for commuters dominates large
areas of government owned land, providing a poor amenity potentially to the detriment of other
land uses. Improved public transport (aimed in part at reducing reliance on private transport) is
recommended.
Retailing – Redland Bay Centre expected to be expanded to district level (rezoned from
Neighbourhood to District Centre Zone). Other smaller scale retailing to satisfy local / commuter
needs.
Tourism / Recreation – The Master Plan recognises the potential of the area for tourism and
recreation and seeks to provide a range of appropriate facilities to support these activities
including tourism information, accommodation and hospitality.
Higher density residential / mixed use development – recognises that the current residential
development is at very low densities and aims to increase densities throughout the Master Plan
area. Also promotes mixed use developments particularly near Weinam Creek Community
Village.
3.2 Recent and Emerging Development Activity
We have undertaken a review of recent major development projects within the suburb of
Redland Bay and more specifically, within the PDA. The following provides a short summary of
the main development activity:
The majority of the recent development applications have been for residential lot subdivisions,
including Redland Heights Estate; Valencia Springs Estate; Unwin Road; Bankswood Drive;
Muller Street, and Redland Bay Grove Estate.
Development proposals within the study area include:
10, two storey townhouses at 95-101 Hamilton Street. Approval was granted but we
understand the project has been abandoned;
Extensions to the Palm Lakes Retirement Village, providing an additional 41 units –
Approved but the project has not proceeded; and
Weinam Creek: Market Assessment Report, Page 6 Upgrades to the Redland Bay Marina Bus Station
Outside of the study area, there has been some low-medium density residential development,
notably a 33 unit development at 245-247 Main Street by Fiteni Homes (Pine Terrace Redland
Bay). This is located approximately 1km west of the subject site. Four bedroom duplexes are
advertised for sale at between $435,000 and $455,000.
Southern Redland Bay Investigation Area
The Southern Redland Bay Investigation Area (SRBIA) has been identified as a potential land
bank for medium to longer term urban development. To date, it is yet to be determined whether
the area will be developed as a new community and included in the Urban Footprint for South
East Queensland. SRBIA is located approximately 5km south of Weinam Creek and comprises
approximately 310 hectares of land.
The Developers’ Fox and Bell together with Fiteni Homes are the major land owners of the
SRBIA and have proposed a future urban village, marketed as Shoreline Redlands, on the
SRBIA. Fox and Bell’s proposal comprises the development of a community for up to 10,000
residents in 3,600 homes, and includes a village centre with shops, restaurants and a tavern
adjacent to a 2.2km foreshore park.
The proposal is planned as a master planned community incorporating schools, community
facilities as well as business opportunities within the village centre. While most of the
development would comprise relatively low density housing, some medium density housing is
proposed adjacent to the village centre.
Should the SRBIA be approved for a new community, it will provide for considerable ongoing
population growth within Redland Bay over the next 20 years.
While the project’s proposed village centre would provide many of daily and weekly services
required by its residential population, residents of Shoreline would also access services in
nearby communities, including Weinam Creek / Redland Bay Village and Victoria Point. Future
development at Weinam Creek may therefore benefit from a significant increase in the
residential population within a relatively short drive.
Weinam Creek: Market Assessment Report, Page 74 Demographic and Employment Trends
This section focusses on the demographic and employment trends for the suburb of Redland
Bay, which includes Weinam Creek. We consider the existing residential population of Redland
Bay provides an insight into the potential local market for residential and commercial
development at Weinam Creek. We also provide brief analysis of the population of the Southern
Moreton Bay Islands (SMBI), which shows quite different characteristics. SMBI residents enjoy
quite a unique lifestyle and are not seen as being as representative of a future Weinam Creek
residential market as Redland Bay residents. However, they will naturally gravitate to, and utilise
the facilities and services that may be provided at Weinam Creek.
The population of Redland Bay SA2 (Redland Bay) was 14,284 in June 2012, up from 14,006 in
June 2011 (2.0% growth). This strong growth was in line with the growth within the Greater
Brisbane metropolitan area. The estimated resident population of SMBI in June 2011 was 5,844,
rising to an estimated 5,914 in June 2012 (1.2% growth).
The main characteristics of the Redland Bay population (compared with Greater Brisbane) are:
A relatively high proportion of children (24% under 15 years; 20.1% in Greater
Brisbane);
A large population from the UK (9.2%; 5.6% in Greater Brisbane);
Relatively high level of home ownership (73.9% either own or are buying their home;
65.5% in Greater Brisbane);
Dominance of separate dwellings – 98% of all dwellings;
Dominance of family households with very few lone person and group households; and
Individual incomes are in line with Greater Brisbane while average household incomes
are 5.5% higher, reflecting the larger average household size, which translates to more
households with more than one income earner.
SMBI has a very different demographic profile than Redland Bay and Greater Brisbane,
characterised by:
Dominance of older residents, with 46.5% aged 55 and over;
Few children with only 16.2% aged 14 and under (24% for Redland Bay; 20.1% for
Greater Brisbane);
Very few young adults. Just 2.5% of the residents were aged 20-24 (4.5% in Redland
Bay; 7.6% across Greater Brisbane);
A high level of outright home ownership (40.6%), reflecting the older age profile and
number of long-time residents living on the islands;
A dominance of separate dwellings (99%);
A dominance of couples with no children and single person households, again
reflecting the older generation with children no longer living at home; and
A very low income profile with household income less than half that of Redland Bay
residents and Greater Brisbane residents.
Weinam Creek: Market Assessment Report, Page 8Table 1: Demographic Characteristics, Redland Bay Compared to Greater Brisbane, 2011
Southern Moreton Benchmark to
Selected Characteristic
Redland Bay Bay Islands Greater Brisbane
Population 14,006 5,625 2,146,577
Age Distribution
0-4 years 7.5% 5.7% 7.0%
5-14 years 16.5% 10.5% 13.1%
15-19 years 7.5% 4.3% 6.9%
20-24 years 4.5% 2.5% 7.6%
25-34 years 11.0% 6.4% 14.8%
35-44 years 16.4% 10.9% 14.8%
45-54 years 13.8% 13.2% 13.2%
55-64 years 11.3% 21.7% 10.8%
65 years & over 11.5% 24.8% 11.8%
Birthplace
Australia 78.2% 75.7% 74.0%
UK 9.2% 8.5% 5.6%
Europe 1.9% 2.8% 2.2%
Asia 1.0% 2.0% 6.1%
Other 9.8% 11.0% 12.0%
Housing Status
Owner 28.1% 40.6% 27.9%
Purchaser 45.8% 28.0% 37.6%
Renter 25.7% 31.1% 33.7%
Other 0.4% 0.4% 0.8%
Dwelling Structure
Separate house 98.0% 98.8% 79.1%
Semi-det, row/terrace, townhouse 0.7% 0.1% 8.5%
Flat, unit, apt 1.2% 0.5% 11.7%
Other dwelling 0.1% 0.6% 0.7%
Family Composition
Couple - No Children 36.9% 54.7% 37.0%
Couple - Dependant Children 37.3% 15.1% 31.6%
Couple - Non-dependant Children 13.1% 6.0% 13.3%
One Parent - Dependant Children 7.1% 14.9% 8.8%
One Parent - Non-dependant Children 4.9% 8.0% 7.3%
Other Family 0.8% 1.4% 2.0%
Households
Family Households 85.9% 59.6% 72.9%
Lone Person Households 12.1% 35.8% 21.8%
Group Households 2.0% 4.7% 5.2%
Income
Average Personal Income $41,455 $24,519 $41,468
- Variation from benchmark 0.0% -40.9%
Average Household Income $90,455 $40,865 $85,761
- Variation from benchmark 5.5% -52.4%
Average Household Size 2.9 2.0 2.6
Source: Australian Bureau of Statistics, Jones Lang LaSalle Research & Consulting
Weinam Creek: Market Assessment Report, Page 9The following brief analysis focuses on the population of Redland Bay compared with Greater
Brisbane. For comparison, we have also shown SMBI residents in the charts.
Redland Bay’s population has:
A relatively high proportion of children (24% under 15 years; 20.1% in Greater
Brisbane);
A higher representation of residents in the mid to later part of their working career 35+
and relatively low proportion of residents in their early part of their career (20-34 years)
Figure 2: Age Profile, Redland Bay/SMBI compared to Greater Brisbane, 2011
30%
25%
20%
15%
10%
5%
0%
0-4 years 5-14 years 15-19 years 20-24 years 25-34 years 35-44 years 45-54 years 55-64 years 65 years &
over
Redland Bay SMBI Greater Brisbane
Source: Australian Bureau of Statistics, Jones Lang LaSalle Research & Consulting
The Redland Bay population has a relatively high level of home ownership (73.9% either own or
are buying their home; 65.5% in Greater Brisbane) indicating a strong sense of ownership as an
important driver of investment in any new housing;
Figure 3: Housing Ownership Profile, Redland Bay/SMBI compared to Greater Brisbane,
2011
50%
45%
40%
35%
30%
25%
20%
15%
10%
5%
0%
Owner Purchaser Renter
Redland Bay SMBI Greater Brisbane
Source: Australian Bureau of Statistics, Jones Lang LaSalle Research & Consulting
Weinam Creek: Market Assessment Report, Page 10Redland Bay is dominated by detached housing stock, representing 98% of all housing in the
area;
Figure 4: Dwelling Stock Profile, Redland Bay/SMBI compared to Greater Brisbane, 2011
120%
100%
80%
60%
40%
20%
0%
Separate house Semi-det, row/terrace, townhouse Flat, unit, apt
Redland Bay SMBI Greater Brisbane
Source: Australian Bureau of Statistics, Jones Lang LaSalle Research & Consulting
The Redland Bay age profile highlights a strong family composition with a relatively high
representation of couples with dependent children, consistent with a higher need for larger
dwellings. Families make up 85.9% of all households, compared with 72.9% of households
across Greater Brisbane;
Figure 5: Family Type, Redland Bay/SMBI compared to Greater Brisbane, 2011
60%
50%
40%
30%
20%
10%
0%
Couple - No Children Couple - Dependant Couple - Non- One Parent - One Parent - Non-
Children dependant Children Dependant Children dependant Children
Redland Bay SMBI Greater Brisbane
Source: Australian Bureau of Statistics, Jones Lang LaSalle Research & Consulting
Weinam Creek: Market Assessment Report, Page 11Incomes for Redland Bay are in line with average individual incomes for the wider metro area
but higher for household incomes, indicating that more households have dual incomes
compared to Greater Brisbane;
Figure 6: Income Profile, Redland Bay/SMBI compared to Greater Brisbane, 2011
100,000
90,000
Average Annual Income ($)
80,000
70,000
60,000
50,000
40,000
30,000
20,000
10,000
0
Average Personal Income Average Household Income
Redland Bay SMBI Greater Brisbane
Source: Australian Bureau of Statistics, Jones Lang LaSalle Research & Consulting
4.1 Population Forecasts for Retail Development
The following forecasts are based on current Queensland government forecasts. We have
considered the primary catchment of future retail development to be Redland Bay Statistical
Local Area and the secondary catchment to be the Southern Moreton Bay Islands (SMBI).
The potential development of Fox and Bell’s Shoreline urban village would not be incorporated
into the forecasts as it is a concept plan only. Shoreline is located approximately 4.5km south of
Weinam Creek and if approved, could eventually be home to around 10,000 residents (3,600
homes; 2.8 residents per home).
Should population growth over the period 2021-2031 continue at a similar rate to that expected
over the period 2016-2021, then the primary catchment could reach 22,000 residents by 2031
(i.e. 1.9% per annum growth continuing through to 2031).
Table 2: Population Forecasts, Redland Bay and SMBI, 2011-2031
Catchment 2011 2016 2021 2026 2031
Primary Catchment - Redland Bay 14,006 16,675 18,279 19,382 19,858
Secondary Catchment - SMBI 5,844 6,548 7,245 7,990 8,795
Total Catchment 19,850 23,222 25,524 27,372 28,653
Population Growth - per annum 2011-16 2016-21 2021-26 2026-31
Primary Catchment - Redland Bay 3.5% 1.9% 1.2% 0.5%
Secondary Catchment - SMBI 2.3% 2.0% 2.0% 1.9%
Total Catchment 3.2% 1.9% 1.4% 0.9%
Source: Australian Bureau of Statistics, Jones Lang LaSalle Research & Consulting
Weinam Creek: Market Assessment Report, Page 124.2 Employment Trends in Redland Bay
This section provides a brief overview of the existing employment within Redland Bay and
nearby SMBI, highlighting the relatively low level of employment jobs in comparison to its
population. The development of the Weinam Creek PDA provides an opportunity to increase the
employment base within Redland Bay and may improve opportunities for residents to find work
locally.
The following table provides a summary of the residential labour force of Redland Bay compared
with the workforce within Redland Bay.
Redland Bay has a very low level of “Employment Self-Sufficiency”, measured as the ratio of
jobs in the area to employed persons residing in the area. As at the 2011 Census, Employment
Self-sufficiency was just 25.7%. Every industry group has less jobs than resident employees.
The employment make-up is quite typical of outer suburbs without major activity centres or large
populations to support a larger, more diverse workforce. Most jobs would likely serve a local
market, including a range of health and community services, retail and food catering businesses,
and a mix of local tradespeople that loosely fit into the construction sector and may work from
home.
Table 3: Employment in Redland Bay, 2011-2031
Jobs in Workers
Redland % by Residing in % by
Industry Sector Bay Industry Redland Bay Industry
Agriculture, forestry and fishing 61 3.5% 67 1.0%
Mining 9 0.5% 85 1.3%
Manufacturing 105 6.1% 734 10.9%
Electricity, gas, water and waste services 7 0.4% 59 0.9%
Construction 284 16.5% 894 13.3%
Wholesale trade 90 5.2% 350 5.2%
Retail trade 150 8.7% 752 11.2%
Accommodation and food services 127 7.4% 310 4.6%
Transport, postal and warehousing 68 3.9% 393 5.9%
Information media and telecommunications 20 1.2% 79 1.2%
Financial and insurance services 33 1.9% 183 2.7%
Rental, hiring and real estate services 42 2.4% 133 2.0%
Professional, scientific and technical services 104 6.0% 356 5.3%
Administrative and support services 57 3.3% 206 3.1%
Public administration and safety 77 4.5% 362 5.4%
Education and training 150 8.7% 482 7.2%
Health care and social assistance 184 10.7% 719 10.7%
Arts and recreation services 24 1.4% 75 1.1%
Other services 90 5.2% 285 4.2%
Inadequately described/Not stated 43 2.5% 186 2.8%
Total 1,725 100.0% 6,710 100.0%
Employment Self Sufficiency 25.7%
Total 1,725 6,710
Source: Australian Bureau of Statistics, Jones Lang LaSalle Research & Consulting
Weinam Creek: Market Assessment Report, Page 13The following maps illustrate where Redland Bay workers come from and go to. We have also
provided a map showing where Redland Bay Island residents work. These maps indicate that
Redland Bay residents travel far and wide to access work.
Weinam Creek: Market Assessment Report, Page 14Redland Bay residents work across a very broad region of South East Queensland with concentrations within other parts of Redland LGA, including the
Cleveland, Capalaba and Victoria Point centres and the health precinct surrounding the Redland Hospital and Mater Private Hospital Redland.
Figure 7: Redland Bay Residents, Where they Work, 2011
Source: Australian Bureau of Statistics, Jones Lang LaSalle Research & Consulting, PBBI Mapinfo
Weinam Creek: Market Assessment Report, Page 15Workers employed in Redland Bay primarily reside in Redland Bay or nearby. As noted earlier, employment opportunities are quite limited and future
development at Weinam Creek has the potential to provide some employment opportunities.
Figure 8: Redland Bay Workforce, Where they Reside, 2011
Source: Australian Bureau of Statistics, Jones Lang LaSalle Research & Consulting, PBBI Mapinfo
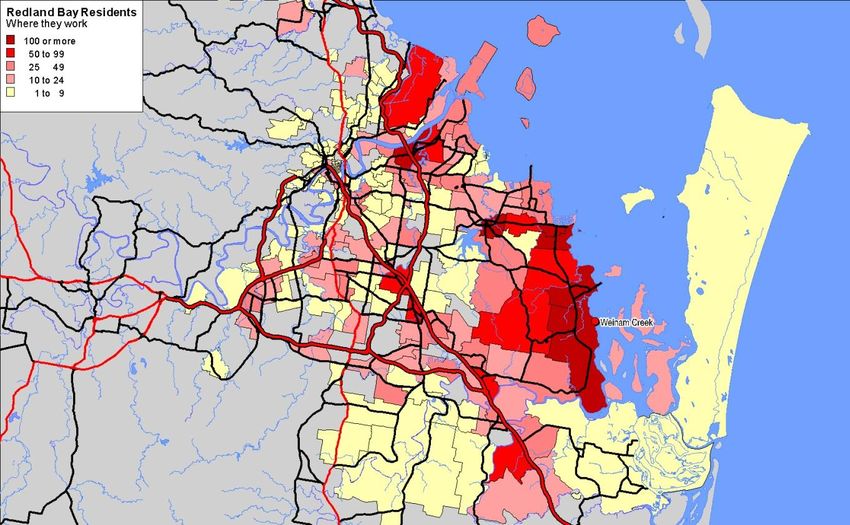
Weinam Creek: Market Assessment Report, Page 16A significant amount of SMBI and North Stradbroke residents work on the mainland across a large part of SE Queensland. More are employed at Victoria
Point than Redland Bay, reflecting the greater availability of working opportunities there.
Figure 9: SMBI and North Stradbroke Residents, Where they Work, 2011
Source: Australian Bureau of Statistics, Jones Lang LaSalle Research & Consulting, PBBI Mapinfo
Weinam Creek: Market Assessment Report, Page 175 Retail Development Opportunities
Key Points
Retail development within the PDA is a critical component of the urban renewal of Weinam Creek, helping to create
activity, a sense of community and identity as well as supporting other commercial and residential activity.
Weinam Creek should complement rather than compete with the existing nearby Redland Bay Shopping Village,
which has been rezoned to develop as a District Shopping Centre, incorporating a large supermarket.
Achieving both local buy-in from its primary catchment of Redland Bay as well as providing services to residents of
SMBI are critical to the success of a retail development at Weinam Creek.
While a full-line supermarket could be supported at Weinam Creek, Redland Bay Shopping Village is recommended
as a superior location for such an anchor tenant. This is for a wide range of reasons including but not limited to: to the
better retailing alignment with grocery shopping with other town centre uses, the ability to fully utilise high value
waterfront land for higher and better uses delivering a stronger economic return, and enabling waterfront land to be
utilised for activities that are consistent with the vision for the site in creating a strong mixed use destination.
Retailing at Weinam Creek could focus on leisure / lifestyle and incorporate a restaurant / dining precinct of 800-900
square metres. Possible uses include day spas, health and beauty services, boating related retail products, leisure
wear, specialty food retailing and local services to serve both residents and ferry patrons.
Café / dining precincts are difficult to support in isolation but are a core land use in most successful waterfront
precincts. Leveraging the water views will be important, but design will be critical to ensure maximum potential for
activation and through linkages to other activators on or adjoining the site.
The amount of retailing supportable will largely depend on how much of a destination Weinam Creek can become.
We do not consider that the retail component will be the primary attraction at Weinam Creek. A marina and tourism
associated with it being the gateway to SMBI with its waterfront location are more likely to create the destination
appeal. The inclusion of a well-branded pub/hotel as the anchor to the precinct would provide a level of destination
appeal and provide an important anchor to the specialty retail component.
5.1 Competition
This section considers the competing retail centres serving Redland Bay and SMBI residents
(existing and future) and how Weinam Creek fits into this hierarchy. We have highlighted the
main neighbourhood, sub-regional and regional centres that do not necessarily compete directly
with the subject site, but would consider residents of Redland Bay and SMBI as part of their
catchment.
Redland Bay Village Shopping Centre – Convenience Retailing
This centre is located approximately 1km north of Weinam Creek and straddles both the
northern and southern sides of Stradbroke Street between Broadwater Terrace and Gladstone
Street. The centre is owned and managed by local developers Fox and Bell.
Currently the centre is anchored by a small IGA supermarket and comprises around 45
tenancies. Larger tenants include a BWS liquor store and a discount pharmacy.
It is understood that there are future plans to redevelop the shopping centre to incorporate a
larger supermarket. The recent rezoning of the retail centre zone from neighbourhood to District
Centre Zone provides an opportunity for this centre to grow in response to increased demand.
The combined size of the northern and southern site of the Redland Bay Shopping Village is
approximately 11,100sqm. This is quite restrictive in terms of future retail growth.
Weinam Creek: Market Assessment Report, Page 18Rededge, Redland Bay
This is a small local centre comprising an small IGA supermarket, a medical centre and
approximately 10 specialty shops. The centre is located on School of Arts Road and located
approximately 1.6km south west of Weinam Creek.
Victoria Point – Sub-regional Retailing
Victoria Point is a sub-regional shopping and entertainment destination accommodating several
supermarkets, a Bunnings store and a Kmart discount department store of around 6,000 sqm
together with cinemas and entertainment, specialty shops, dining and commercial tenancies. It is
located less than 5km to the northwest of the subject site. With a diverse range of anchor
tenants at Victoria Point, residents within its catchment use the destination for more than
convenience based shopping. It attracts residents from a relatively large catchment, including
SMBI and Redland Bay, being the closest destination for full-line supermarkets, a discount
department store and cinemas.
Victoria Point comprises three main components:
Leda Holdings’ Victoria Point Shopping Centre includes both Coles and Woolworths
supermarkets, a Kmart discount department store and arounf 90 specialty stores. Total
floor area is approximately 27,000sqm. Approval has been granted for an 8,000sqm
extension to include an additional discount department store and specialty stores.
Lakeside Victoria Point is anchored by a 9 screen Cineplex, Aldi supermarket and
dining precinct and incorporates a range of commercial tenancies as well as retailing.
The Town Centre at Victoria Point comprises a Woolworth’s supermarket, Dan
Murphy’s liquor, Bunnings Warehouse and specialties. Total floor area is over
13,000sqm.
Logan Hyperdome Shopping Centre, Regional Retailing
Logan Hyperdome is a large regional shopping centre approximately 15km to the west of
Weinam Creek. It is the closest regional scale shopping centre to Weinam Creek / Redland Bay
and comprises a Myer department store, two discount department stores (Kmart and Big W) and
four supermarkets (Coles, BiLo, Woolworths and Aldi). Approximately 220 specialty retailers
complement the main anchor tenants. There is also a Pacific cinema complex with 12 screens.
Total floor area is approximately 74,600sqm. Plans have been approved for a 40,00sqm
extension to include an additional discount department store, supermarket and specialties.
Bulky Goods Retailers
The nearest bulky goods / homewares retailing is at Victoria Point, although this is quite limited
with the main retailer being a Bunnings Warehouse. Further afield, there are homewares
retailers located at Cleveland (e.g. Harvey Norman) and more substantial offerings at both
Loganholme and Capalaba (both approximately 15km away).
Bulky goods retailing require relatively large catchment. We do not consider Redland Bay to be
a strong market for bulky goods retailers.
5.2 Future Demand at Weinam Creek
Given the proximity of Redland Bay Village to Weinam Creek, we have considered the demand
potential of the two locations together and then comment on the role each may play to
complement one another rather than compete with each other.
Weinam Creek: Market Assessment Report, Page 19Supermarket Opportunities
Previous analysis undertaken by Urbis highlighted the current under-supply in supermarket floor
space in the Weinam Creek Catchment, estimated at around 4,500 square metres across the
main trade area. This was based on a population of 17,300 as at 2010. Assuming a population
of 30,000 residents by 2031, the under-supply become more pronounced and may reach around
9,500 square metres. This is equivalent to three large supermarkets of around 3,200 square
metres each.
In broad terms, each 10,000 residents can support around 3,000-4,000 square metres of
supermarket space, or the equivalent of a large supermarket. Currently the catchment has none,
with supermarket spending leakage to higher order centres such as Victoria Point.
What this means is that there is sufficient existing and future demand to support more than one
supermarket within the Weinam Creek catchment, and possibly three large supermarkets by
2031. The future distribution of new supermarkets could be as follows:
An expanded Redland Bay Village anchored by a full-line supermarket;
A larger supermarket offering on Macleay / Russell Island;
A supermarket (smaller than full-line) at Weinam Creek; and
A supermarket to support future residential growth either to the south or west of
Weinam Creek (potentially as part of the proposed Shoreline development should this
proceed within the next 20 years).
The main issue is whether a full-line (3,000 square metre plus) supermarket is warranted at both
Redland Village and Weinam Creek. Our view is that the two retail nodes are too close to one
another to serve a similar role and function, and similar sized supermarkets at both centres may
lead to the two locations competing to serve the daily / weekly needs of Redland Bay residents.
The economic value of waterfront compared to Village centre land also suggests that far greater
returns can be achieved from other higher and better uses, particularly when taking account of
the large car parking requirement for a full-line supermarket. Excluding a full-line supermarket
from the mix will also support the vision for Weinam Creek to be developed into a vibrant, unique
destinational precinct that has strong appeal to both residents and visitors.
We recommend that the roles of Weinam Creek and Redland Bay Village remain distinct. This
could be achieved by Redland Bay Village being developed in line with its district centre status
(anchored by a full-line supermarket) and Weinam Creek being more leisure / lifestyle focussed.
The two nodes would then complement one another rather than compete.
Local “Convenience” Retail
Weinam Creek should support local level of retailing without undermining the district function of
Redland Village. Furthermore, Weinam Creek is expected to build on its local residential
population within the PDA. This population will support a small selection of retail outlets aimed at
providing for the day to day needs of residents. Patrons of the ferry service to SMBI will also use
local facilities and services, and services within a short walking distance of the ferry terminal will
be best placed to cater to this demand.
A small supermarket (say 500sqm), hairdresser, café, bakery, and the like are expected to be
the main retailers serving this local retail function at Weinam Creek.
Weinam Creek: Market Assessment Report, Page 20Discount Department Store
We do not consider a discount department store is viable at Weinam Creek / Redland Bay. Such
a store typically requires a catchment in the vicinity of 50,000 residents. Our assessment of the
future catchment suggests that the population will grow to around 30,000 residents by 2031. The
closest existing discount department store to Redland Bay is at Victoria Point, less than 5km to
the north. This provides reasonable access for this form of retailing.
Cinemas
Similarly, we do not consider cinemas will be viable at Weinam Creek / Redland Bay. Victoria
Point provides a 9 screen Cineplex and would certainly serve the Redland Bay catchment.
Previous analysis undertaken of the potential for cinemas at Cleveland highlighted that demand
for cinemas in this market was only marginal, despite Cleveland having a far larger catchment
than Weinam Creek / Redland Bay.
Restaurant / Dining Precinct
A restaurant precinct may provide a commercially viable opportunity at Weinam Creek, however
this is likely to be part of a more extensive waterfront precinct offering, including residential
(permanent; short-term), marina, lifestyle and retail.
Our assessment of the opportunity for a restaurant precinct draws on previous case studies of
waterfront dining precincts as completed for Toondah Harbour. Some of the features of
successful precincts are:
Complementary dining establishments, clustering together to create an appealing
destination and to drive reciprocal demand between offerings within the site. This is
evidenced in a number of ‘eat streets’ around Brisbane which successfully leverage off
each other to drive demand;
Quality operators that build a strong client base and attract repeat visitation;
Iconic restaurants. This has successfully activated dining precincts such as Eagle
Street Pier in Brisbane, with celebrity chefs opening bars / restaurants;
Alfresco dining opportunities with an appealing outlook;
Accessible car parking for patrons;
Support from local residents and workers – dining precincts that rely too heavily on a
visitor market are likely to be difficult to sustain;
Proximity to a workforce. The CBD workforce is a key market segment and it will be
important to make sure that there are easy and quick transport options between the
two sites; and
Large catchment. The existing Redland Bay retail catchment (i.e. the catchment for
supermarket / convenience retailing) is not large. A successful restaurant precinct will
need to draw customers from a much larger catchment.
An iconic tavern or pub/hotel may complement and provide an anchor to a restaurant precinct.
This would serve to reinforce the nearby Redland Bay Hotel which is an iconic hotel and
provides for a greater cluster and choice of prime retail/entertainment venues.
Table 3 highlights the potential demand for ‘Restaurant, Bar, Café and Take-away’ food floor
space at Weinam Creek. The analysis highlights demand for around 650-850sqm of floor space
Weinam Creek: Market Assessment Report, Page 21for these categories, which we believe should be skewed towards restaurants, bars and cafes
rather than take-away food. Key inputs and findings of the analysis include:
The primary trade area, and forecast population, for the previous retail assessments
have been adopted. This utilises official state government forecasts for Redland Bay
SLA;
An annual Restaurant, Bar, Café and Take-away spending rate of $1,400 per capita
has been applied. This has been determined based on the 2010 ABS Household
Expenditure Survey (HES). $1,400 per capita per annum reflects the higher income
profile of primary trade area residents and is consistent with those households
between the third and fourth income quintile in the HES.
By applying this rate to the total catchment size equates in a total available
Restaurant, Bar, Café and Take-away spend of around $23 - 28 million.
A reasonable market share of 15% has been applied to the total spending market.
Considering that spending is likely to leak to lunch-time spend at establishments
around places of work, we believe this is reasonable. The rate of 15% is further
supported by the fact that around 50% of the per capita spend is dedicated to ‘take-
away’ food expenditure, a market that any retail at Weinam Creek is unlikely to capture
due to the lack of a large nearby worker market.
A high proportion of spend (some 30%) is anticipated to be generated from residents
from beyond the trade area due to the number of visitors using ferry services and
visiting Weinam Creek.
Total turnover for a Restaurant, Bars, Café and Take-away precinct is forecast
turnover to reach $6.0 million by 2031.
A reasonable supportable rate of turnover per sqm for food catering retailers is $8,000
per sqm per annum. By applying this rate to the captured spend, it shows demand for
around 625sqm in 2016 and 745sqm in 2031 for Restaurant, Bar, Café and Take-away
floor space.
An allowance of 15% has been allowed for ‘other’ retail shops, bringing total floor area
within a dining precinct to 876sqm by 2031.
This analysis shows support for a relatively modest dining precinct and highlights the need for
the precinct to draw very strong demand from beyond its immediate catchment in order to
support a larger offering. This needs to be considered in the context of both existing dining
options at Victoria Point and Cleveland as well as future competing precincts at locations such
as Toondah Harbour.
Weinam Creek: Market Assessment Report, Page 22Table 4: Dining Precinct, Potential Demand at Weinam Creek PDA
2011 2016 2021 2026 2031
Population
Primary Trade Area (persons) 14,006 16,675 18,279 19,382 19,858
Spending per person ($ per annum)
Restaurant, Bars, Café and Take-away 1,400 1,400 1,400 1,400 1,400
Available Spending ($ million)
Restaurant, Bars, Café and Take-away 19.6 23.3 25.6 27.1 27.8
Market Share
Restaurant, Bars, Café and Take-away 15% 2.94 3.50 3.84 4.07 4.17
Beyond Trade Area
Restaurant, Bars, Café and Take-away 30% 1.26 1.50 1.65 1.74 1.79
Total Spend Catchment
Restaurant, Bars, Café and Take-away 4.2 5.0 5.5 5.8 6.0
Turnover per sqm.
Restaurant, Bars, Café and Take-away 8,000 8,000 8,000 8,000 8,000
Supportable Floor Area
Restaurant, Bars, Café and Take-away 525 625 685 727 745
Allowance for 'Other' Retail 15% 93 110 121 128 131
Total 618 736 806 855 876
Source: Australian Bureau of Statistics, Jones Lang LaSalle Research & Consulting
Note: All values are in constant dollar (inflation adjusted) terms
Lifestyle / Leisure Retailing
Lifestyle / leisure retailing may include a range of specialty retailers aimed at the tourist market
attracted to Weinam Creek such as day spas, health and beauty services, boating related retail
products, leisure wear, and specialty food retailing.
One of the difficulties with this sector of the retail market is that it can be quite seasonal, being
strongest in holiday periods and during the warmer months. Sales may also be skewed towards
the weekend. These factors can make it difficult to successfully operate a viable business.
Business operations that also derive trade from the local residents are best placed to succeed.
A small quantity of lifestyle / leisure retailing is expected to be viable in association with either a
marina or short-term visitor accommodation, or preferably both.
Weinam Creek: Market Assessment Report, Page 236 Residential Market Opportunities
Key Points
Redland Bay has experienced limited residential development in the past two years, but has seen strong growth over
the past decade.
Residential estates of note in Redland Bay include AMEX Corporation’s Valencia Springs and Fiteni Homes’ Redland
Bay Grove. Longer term, the proposed development of Shoreline has the potential to provide long-term population
growth in the suburb.
The median sales price has hovered between $450,000 and $500,000 over the past 6 years. A relatively small portion
of the market (19%) has been sales above $600,000.
The market for apartments and units is expected to be shallow for existing stock. However, factors such as proximity
to a new marina, water views, high quality amenity and proximity to services will all assist in building a market for
denser residential development moving forward.
In the early stages of development, we recommend providing small lot house and land packages as a first step
towards increased residential densities. This would be followed by smaller apartment projects as densities increase.
This section highlights the market opportunities for residential development within the PDA Our
point of reference is the suburb of Redland Bay, while we also consider the broader residential
trends across the Redland LGA.
We have focussed on the potential for medium density forms of residential development, which
has been quite rare at Redland Bay. Where such development has occurred in the Redland
LGA, it has typically offered view over water and good access to a range of services and
facilities, including access to public transport. A redeveloped Weinam Creek potentially offers
some of these characteristics.
6.1 Residential Approvals and Recent Growth
Figure 11 below provides the residential building approvals by financial year for Redlands LGA
and Redland Bay. Approvals two most recent years for Redland Bay (40 and 62 approvals
respectively) are well down on levels experienced in the year to June 2007 (315 approvals).
Across the Redlands LGA, approvals have been relatively buoyant in the last two years, due in
part to relatively strong numbers for the Cleveland-Stradbroke region.
Weinam Creek: Market Assessment Report, Page 24Figure 10: Building Approvals, Redland Bay and Redland LGA, 2007-2013
1,400
1,200
1,000
Number of Dwelling Approvals
800
600
400
200
0
2007 2008 2009 2010 2011 2012 2013*
Redland Bay Redland LGA
Source: Australian Bureau of Statistics, Jones Lang LaSalle Research & Consulting
Note: Data is for financial years
* 2013 data is for financial year to date (May 2013)
Between the 2001 and 2011 Census, total occupied private dwellings in Redland Bay grew from
2,438 to 4440, or 2,002 in 10 years (200 per annum). While growth since the 2011 Census has
deteriorated, this is more an indication of the recent subdued housing market than a lack of
future opportunities at Redland Bay. There are numerous recent land releases and greenfield
sites that provide future residential opportunities while the proposed Shoreline development,
which is located within the Redland Bay region, may provide longer term opportunities for
significant growth.
Current and recent major residential projects are highlighted below:
Project Name Details Developer
Valencia Springs A 250 lot residential development commenced in AMEX Corporation
2004. Final stage was released in September 2012.
Redland Bay Grove Predominantly completed. Stage 4 is being Fiteni Homes
marketed, comprising 43 lots.
Pine Terrace Redland Bay A 33 dwelling development backing onto a reserve. Fiteni Homes
Unwin Road A 135 lot subdivision has been granted subdivision Fiteni Homes
approval.
Redland Heights Estate An 85 lot subdivision (Stage 2) has been approved. Philip Usher Constructions
The following map highlights the relatively low density of existing residential development
surrounding the Weinam Creek site. Much of the land within 5km of Weinam Creek is farmland
or bushland and existing urban areas are less densely populated than other Redland suburbs
such as Victoria Point, Cleveland, Capalaba and Thornlands.
Weinam Creek: Market Assessment Report, Page 25You can also read