WEST AFRICAN ECONOMIC AND MONETARY UNION - International ...
←
→
Page content transcription
If your browser does not render page correctly, please read the page content below
IMF Country Report No. 21/50

             WEST AFRICAN ECONOMIC AND
             MONETARY UNION
             SELECTED ISSUES
March 2021
             This Selected Issues Paper on the West African Economic and Monetary Union regional
             member countries was prepared by a staff team of the International Monetary Fund as
             background documentation for the periodic consultation with the member countries. It is
             based on the information available at the time it was completed on January 25, 2021.

                              Copies of this report are available to the public from

                               International Monetary Fund • Publication Services
                                     PO Box 92780 • Washington, D.C. 20090
                                Telephone: (202) 623-7430 • Fax: (202) 623-7201
                             E-mail: publications@imf.org Web: http://www.imf.org
                                          Price: $18.00 per printed copy

                                     International Monetary Fund
                                           Washington, D.C.

             © 2021 International Monetary Fund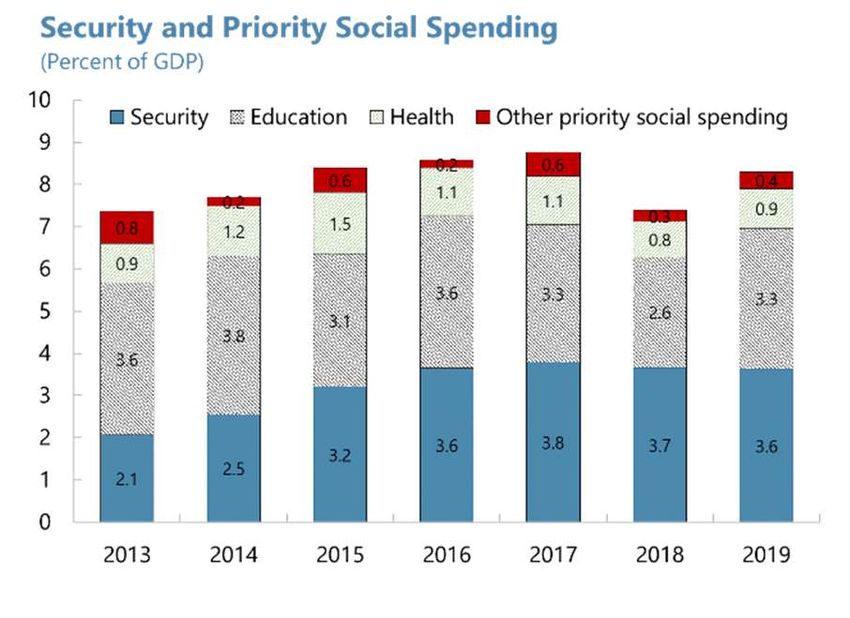
WEST AFRICAN ECONOMIC
AND MONETARY UNION
SELECTED ISSUES
January 25, 2021
Approved By Prepared Nordine Abidi, Goran Amidzic, Alain Féler,
African Department Alexandre Nguyen-Duong, and Hoda Selim, with research
assistance provided by Zarina Bentum and Hilary Devine
CONTENTS
WAEMU—INITIAL POLICY RESPONSE TO THE COVID-19 CRISIS ________________ 4
A. Short-Term Health and Economic Impacts of the Pandemic in the WAEMU ______ 4
B. National Fiscal Policy Responses __________________________________________________ 6
C. Regional Monetary Policy Response _____________________________________________ 10
D. Regional Regulatory and Supervisory Response ________________________________ 12
FIGURES
1. Cumulative COVID-19 Cases in WAEMU and SSA _________________________________ 5
2. COVID-19 Related Deaths Across Regions ________________________________________ 5
3 Real GDP Growth __________________________________________________________________ 5
4. EMBIG Spreads, Jan. 2019–Nov. 2020 _____________________________________________ 6
5. Overall Fiscal Balance _____________________________________________________________ 6
6. Revision of the 2020 Aggregate Fiscal Deficit Relative to Initial Budget
Plans_________________________________________________________________________________ 7
7. Fiscal Expenditure and Revenue, 2020 ____________________________________________ 7
8. Revisions to 2020 Fiscal Balance from Initial Budget Plans ________________________ 8
9. Sources of the 2020 Fiscal Balance Revisions from Initial Budget Plans ___________ 8
10. Net Financing of Governments’ Budget Deficits _________________________________ 9
11. Composition of External Emergency Financing in 2020 __________________________ 9
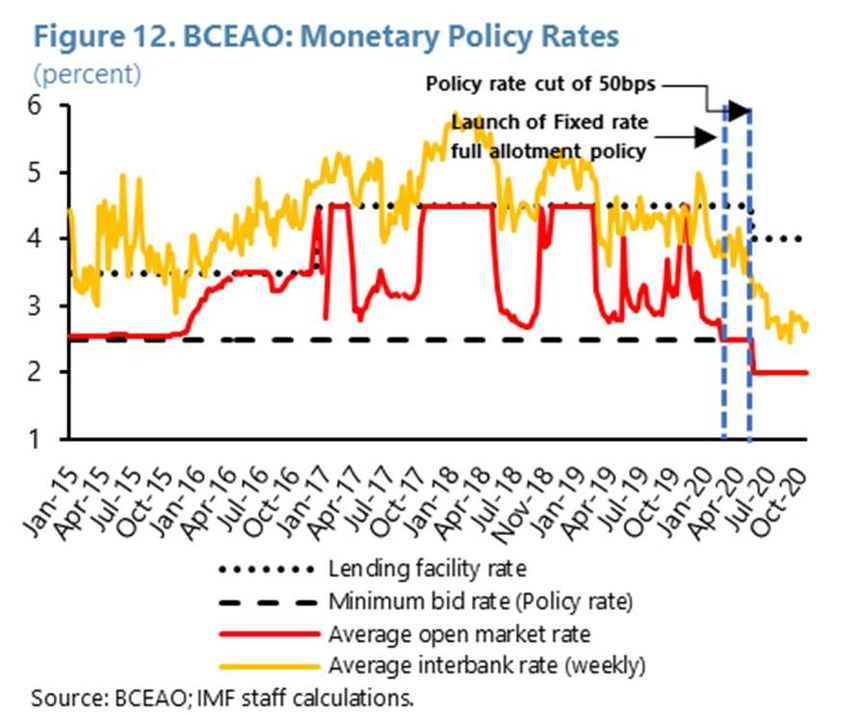
12. BCEAO: Monetary Policy Rates __________________________________________________ 10
13. SSA: Changes in Monetary Policy Rates Between January and November 2020 _ 10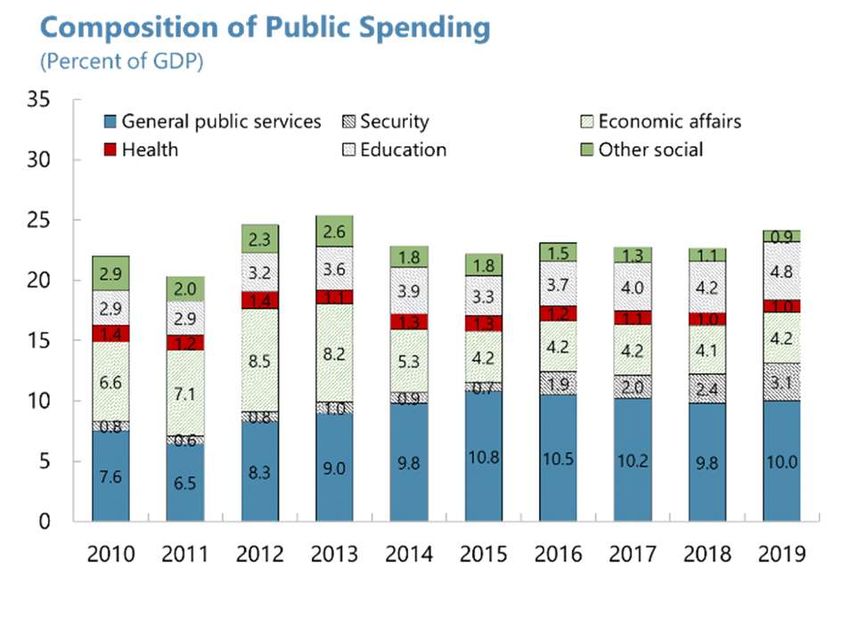
WEST AFRICAN ECONOMIC AND MONETARY UNION

      TABLES
      1. Covid-19 T-Bill Program, 2020 ________________________________________________________ 12
      2. Regulatory Capital Requirements _____________________________________________________ 13

      THE ECONOMIC AND POLICY IMPLICATIONS FOR THE WAEMU OF INSECURITY IN THE
      SAHEL ___________________________________________________________________________________ 14
      A. Origin and Scope of Insecurity in the Sahel ___________________________________________ 14
      B. The Impact of Insecurity on Economic Activity ________________________________________ 17
      C. Fiscal Impact of Insecurity in WAEMU’s Sahel Countries ______________________________ 21
      D. Macroeconomic Policy Implications of Insecurity _____________________________________ 28
      E. Conclusions ___________________________________________________________________________ 29

      References_______________________________________________________________________________ 31

      FIGURES
      1. WAEMU: Terrorism Incidents and Social Unrest in the Sahel, 2011–20 ________________ 16
      2. WAEMU: Fatalities Linked to Security Incidents _______________________________________ 16
      3. Mali: Real GDP Growth and Components, 2001–19 ___________________________________ 18
      4. WAEMU: Real GDP Growth, 2001–19__________________________________________________ 18
      5. WAEMU: Provinces Including Zones Mainly Afflicted by Ongoing Violence: Area,
      Population and Night Lights_____________________________________________________________ 19
      6. WAEMU: Conflict Locations, 2012, 2015, 2018 ________________________________________ 19
      7. WAEMU: Terrorism, Fiscal Deficit, and Public Debt, 2010–19 __________________________ 22
      8. Mali: Terrorism and Public Finances, 2010–19 _________________________________________ 24
      9. Burkina Faso: Terrorism and Public Finances, 2010–19 ________________________________ 25
      10. Niger: Terrorism and Public Finances, 2010–19 ______________________________________ 27

      TABLES
      1. Impact of Conflict on Night Lights ____________________________________________________ 20
      2. Impact of Violent Conflict on Real GDP Growth, 2014–19 _____________________________ 21
      3. Impact of Violent Conflict on Fiscal Revenues, 2014–19 _______________________________ 23

      ANNEXES
      I. Burkina Faso, Mali And Niger; Summary Statistics 2010–19 (Percent of GDP) __________ 33
      II. Overview Of Security Systems in The G5-Sahel Countries _____________________________ 34

2   INTERNATIONAL MONETARY FUND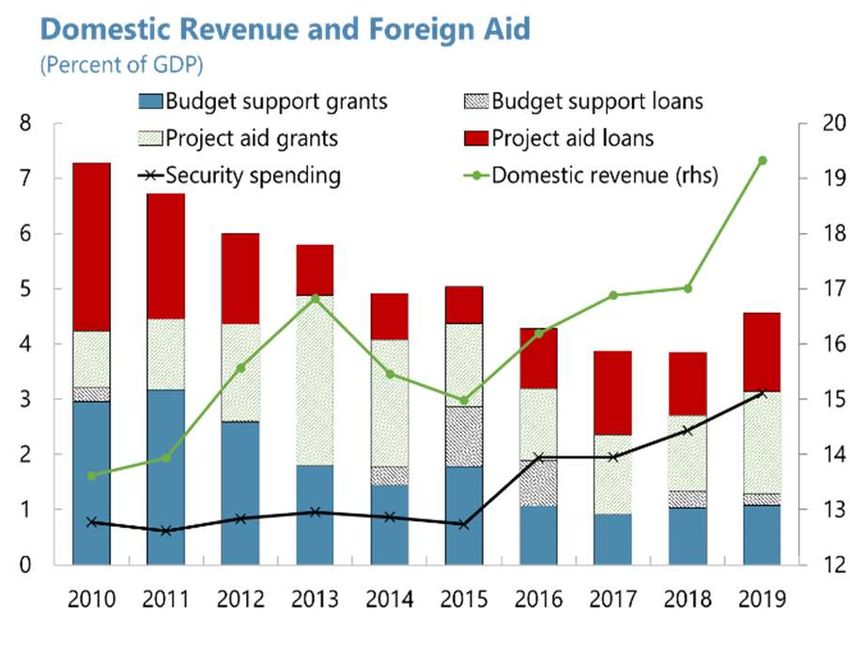
WEST AFRICAN ECONOMIC AND MONETARY UNION

STRENGTHENING THE REGIONAL FISCAL FRAMEWORK IN THE WAEMU __________ 35
A. Well-Designed and Enforceable Fiscal Rules __________________________________________ 35
B. Public Financial Management Reforms________________________________________________ 42
C. Some Fiscal Coordination _____________________________________________________________ 44

References_______________________________________________________________________________ 47

BOXES
1. Convergence Criteria in Effect Until 2019 _____________________________________________ 38
2. Public Debt Dynamics and Below-the-Line Operations in the WAEMU over 2012–19 _ 43

TABLE
1. Implementation of Reforms in Public Financial Management, 2019 ___________________ 44

MODERNIZING THE MONETARY POLICY FRAMEWORK AND ITS TRANSMISSION
IN THE WAEMU ________________________________________________________________________ 48
A. Introduction __________________________________________________________________________ 48
B. Continuing the Reform of the Monetary Policy Framework ___________________________ 50
C. Improving Monetary Policy Transmission _____________________________________________ 61
D. Conclusions___________________________________________________________________________ 70

References_______________________________________________________________________________ 71

BOXES
1. BCEAO’s Monetary Policy Instruments and Related Market Rates _____________________ 51
2. What Are the Macroeconomic Factors Behind the BCEAO Monetary Policy
Decisions? _______________________________________________________________________________ 56
3. Bank Heterogeneity and Monetary Policy Transmission _______________________________ 63

FIGURES
1. BCEAO Objectives and Instruments ___________________________________________________ 50
2. BCEAO Policy and Market Interest Rates ______________________________________________ 51
3. Cross-Country Dispersion of Inflation Rates, 2000–19 _________________________________ 52
4. Real Effective Exchange Rate of SSA and WAEMU ____________________________________ 53
5. Simplified Monetary Policy Transmission Mechanisms ________________________________ 62
6. Private Sector Credit-to-GDP Growth in WAEMU and Selected SSA Countries, 2019 __ 66
7. NPLs and CAR for the WAEMU and SSA Median, 2010–19 ____________________________ 66

                                                          INTERNATIONAL MONETARY FUND           3
WEST AFRICAN ECONOMIC AND MONETARY UNION

WAEMU—INITIAL POLICY RESPONSE TO THE COVID-
19 CRISIS1
1.       During the eight years preceding the global Covid-19 pandemic, WAEMU countries
recorded strong economic growth supported by broadly sound policies. Real GDP growth
exceeded 6 percent (much above the 3.7 percent SSA average) during 2012–19 on the back of
robust domestic demand, while inflation remained subdued. This performance was supported by
expansionary fiscal and monetary policies until 2016, followed by some monetary tightening and
fiscal consolidation, which allowed the aggregate fiscal deficit to decline below the regional
convergence criterion of 3 percent of GDP in 2019.

2.      The global Covid pandemic halted the WAEMU’s strong growth dynamics and led
national and regional authorities to significantly relax macroeconomic policies. The weaker
global environment together with broad containment and mitigation measures by WAEMU
countries are estimated to have a strong contractionary impact on economic activity in 2020,
notwithstanding a substantial relaxation of both fiscal and monetary policies and significant
additional external financing from donors.

3.       This chapter provides an analysis of the early policy response to the unfolding crisis.
The analysis aims at documenting the nature and extent of the policy measures taken in the first
eight months of the Covid crisis (until November 2020). After documenting the current impact of the
crisis on health and economic indicators, the chapter presents the fiscal response by national
authorities and the main measures taken by regional authorities in the areas of monetary and
financial sector policies.

A. Short-Term Health and Economic Impacts of the Pandemic in the
WAEMU

4.      Although severe, the health crisis has, so far, been more contained than in other parts
of Africa. All WAEMU countries have put in place, relatively early on, mitigation and containment
measures, such as quarantine and self-quarantine, border closures, air travel restrictions, restrictions
on public gatherings as well as closures of schools, universities and places of worship. In part
because of these drastic measures, the Covid-19 virus seems to have spread at a slower pace and
with a lower fatality rate in WAEMU countries than in the SSA average (Figures 1 and 2). As of
December 2020, the number of cumulative cases represented less than 0.1 percent of the WAEMU’s
population. That said, many active cases may remain undetected because of constraints on testing
capacity, and the true extent of the epidemic could be underreported.

1
  Prepared by Nordine Abidi, Goran Amidzic, Alain Féler, and Hoda Selim. The authors are grateful for comments
received from Annalisa Fedelino (AFR) and Luc Eyraud (AFR).

4    INTERNATIONAL MONETARY FUND
WEST AFRICAN ECONOMIC AND MONETARY UNION

5.       On the economic front, the 8-year growth spell ended abruptly with the Covid
pandemic. The WAEMU real GDP growth is expected to have declined sharply to 0.3 percent in
2020, from 6.0 percent in 2019 (Figure 3). This is
almost 6 percentage points below the 2020 pre-
Covid forecast. Combined with the deterioration
of the external environment, the implementation
of containment measures from March, in particular
lockdowns and border closures, have contributed
to a sharp decline in economic activity at the end
of the first quarter and during the second quarter
of 2020, particularly in the construction,
commerce, transportation and hospitality sectors.
Some rebound in activity has been underway since the third quarter of 2020, following the easing of
containment measures that started in June. The growth deceleration was broadly similar to that
observed in other SSA countries, although the WAEMU region started from a higher growth level.

6.       No WAEMU economy is being spared by the Covid-related downturn. The hardest-hit
countries are expected to be Burkina Faso, Guinea Bissau, Mali and Senegal, where GDP contractions
of respectively 2.8, 2.4, 2.0, and 0.7 percent are projected for 2020. Real GDP in 2020 is expected to
be flat in Togo, and to be moderately positive in the other three member-countries. In any event,
real per capita GDP growth turned negative in 2020 in all WAEMU countries, for the first time since
2011.

                                                                INTERNATIONAL MONETARY FUND         5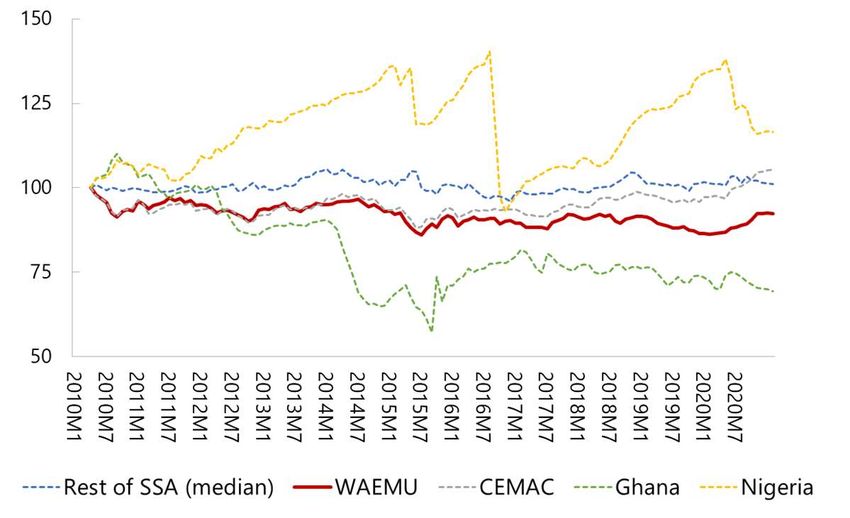
WEST AFRICAN ECONOMIC AND MONETARY UNION

7.        The Covid crisis also made access to international financial markets more difficult for
the frontier market economies of the union. The
repricing of risks caused by the global pandemics
initially resulted in a significant widening of
spreads on Eurobonds issued by WAEMU
sovereigns with access to international capital
markets (Benin, Côte d’Ivoire and Senegal),
although to a somewhat lesser extent than for
other frontier countries in sub-Saharan Africa
(Figure 4). That said, Côte d’Ivoire was able to issue
a EUR 1 billion eurobond at a historically low rate
of 5 percent In November 2020.

B. National Fiscal Policy Responses

8.      Fiscal convergence was broadly achieved in 2019 prior to the global Covid outbreak.
The reform of the WAEMU’s fiscal rule framework in 2015 had set a global fiscal deficit ceiling of
3 percent of GDP to be observed by 2019. This convergence objective was broadly achieved through
a reduction of WAEMU’s aggregate fiscal deficit from 3.6 percent of GDP in 2016 to 2.3 percent of
GDP in 2019, mainly due to improved revenue mobilization by 1.2 percentage points of GDP. Fiscal
consolidation, and a better control of below-the-line operations in the second half of the period,
slowed down the accumulation of public debt, which reached the equivalent of 44.8 percent of GDP
at end-2019.

9.      To allow for a swift response to the pandemic emergency, national authorities
adopted supplementary 2020 budgets implying a relaxation of the fiscal stance by about
3 percent of GDP. The aggregate fiscal deficit was initially expected to remain below the 3 percent
of GDP convergence criterion in 2020. However, to
help contain the virus transmission, expand medical
capacity and support most vulnerable populations
and firms, the WAEMU countries adopted
emergency health and economic packages which,
combined with cyclical declines in revenue, are
expected to raise the aggregate fiscal deficit by
about 3½ percentage points of GDP relative to
2019 (Figure 5). The size of the fiscal relaxation is
broadly similar to the impulse observed in the rest
of the SSA region (see October 2020 Regional
Economic Outlook: Sub-Saharan-Africa).

10.    In this context, the Conference of Heads of States declared a temporary suspension of
the WAEMU convergence criteria. In April 2020, the WAEMU’s Heads of States adopted a
Declaration putting in abeyance the application of the Union’s Pact for Convergence, Stability,
Growth and Solidarity among member-countries. This suspension applies to all convergence criteria,

6   INTERNATIONAL MONETARY FUND
WEST AFRICAN ECONOMIC AND MONETARY UNION

including the 3 percent of GDP deficit ceiling and the 70 percent of GDP ceiling on government
debt. While noting that the suspension was temporary to address the needs related to the Covid
crisis, the Declaration did not specify a time horizon or other condition for reinstating these rules.

11.     At the aggregate WAEMU level, the 2020 fiscal relaxation was due, in equal parts, to
lower revenues and higher spending. The 2020 fiscal deficit ratio has been revised upward by
3.4 percent of GDP when comparing initial budgetary plans to the most recent projections (Figures 6
and 7). Of this 3.4 percentage points revision, 1.4 percent of GDP is due to the fall in nominal GDP,
which mechanically increases the expenditure ratio.2 The “discretionary” stimulus mainly reflects can
higher expenditure (1.2 percent of the pre-Covid GDP) mainly due to new spending on goods,
services and transfers (1.1 percentage point of GDP) but also some higher non-discretionary current
spending (0.1 percentage point of GDP), with capital spending unchanged in percent of the pre-
Covid GDP. On the revenue side, the large shortfall in tax and non-tax revenue ratios (1.2 percentage
points of GDP), has been partly compensated by higher external grants (0.5 percentage points of
GDP).

12.

13.       Nonetheless, the magnitude and composition of the fiscal response varied
significantly across WAEMU countries (Figures 8 and 9). The fiscal expansion projected in 2020
relative to what was anticipated prior to the Covid outbreak (based on initial budget plans) is the
highest for Togo (4.7 percentage points of GDP) and the lowest for Burkina Faso (2.6 percentage
points of GDP). The revenue loss is projected to be particularly large for Mali (-2.7 percentage points
of GDP), potentially reflecting revenue losses due to the political turbulence that compounded the
shortfalls due to the pandemic. Tax and non-tax revenue losses are also projected to be important in
Benin (2.2 percentage points of GDP) as well as in Senegal (1.9 percentage points of GDP).
Notwithstanding such projected losses, higher grants equivalent to 2.2 percentage points of GDP
have allowed Senegal to finance new discretionary current expenditure of 2.3 percentage points of
GDP with marginal capital spending cuts. The anticipated smaller revenue loss by Côte d’Ivoire

2
  The expenditure ratio is corrected for the cycle by freezing the GDP at its pre-Covid crisis estimate. The revenue
ratio is not corrected for the cycle. Indeed, assuming a standard elasticity of revenue to GDP of 1, a cyclical decline in
GDP should be broadly offset by a cyclical decline in revenues, leaving the ratio unchanged. Therefore, changes in
the revenue ratio are attributed to structural factors, including tax policy measures, revenue administration measures,
and various forms of relaxation of tax compliance.

                                                                             INTERNATIONAL MONETARY FUND                7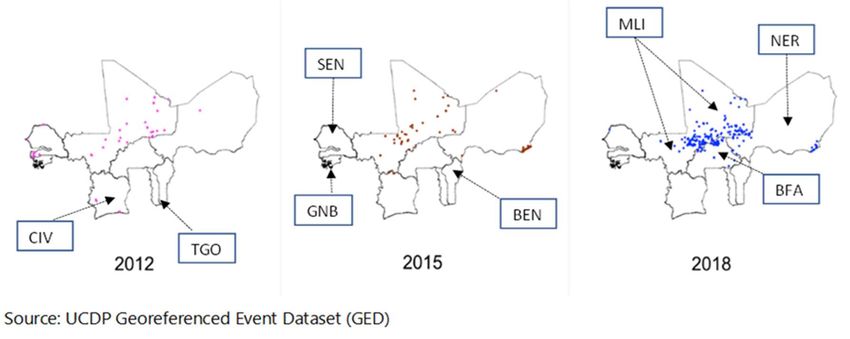
WEST AFRICAN ECONOMIC AND MONETARY UNION
(0.4 percentage point of GDP) should help this country increase expenditure the most (2 percentage
points of GDP excluding the impact of a lower GDP).
14. Turning to the types of emergency measures, the fiscal packages have primarily
focused on i) reinforcing national health systems, ii) supporting vulnerable households, and
iii) supporting businesses and protecting jobs. Consistent with the experience of other SSA
countries (see October 2020 Regional Economic Outlook: Sub-Saharan Africa), the announced fiscal
response in the region foresaw that about one quarter of the response measures would be spent on
addressing health needs, with the remainder on crisis-related transfers and safeguarding
macroeconomic stability. Specific measures adopted in the WAEMU fall in three main categories:
Health sector reinforcement measures were widespread across all member-countries, albeit
adapted to capacity levels of health sectors in each member-country. They comprised
monitoring and containing the spread of the pandemic, and strengthening the medical
infrastructure, personnel, and communication, including the purchase of medical equipment and
the construction of temporary health facilities.
Provision of social assistance varied greatly and was delivered via mobile money or electronic
cash transfers (Togo and Mali) or as in-kind support (i.e. food distribution in Guinea-Bissau and
Niger).3
Economic response plans to support businesses included several direct (i.e. subsidies to
companies in hard-hit sectors in Côte d’Ivoire) and indirect measures (i.e. temporary tax
deferrals for affected businesses in Burkina Faso and Senegal, or guarantee funds in Benin and
Mali to incentivized banks to extend credit to SMEs).
3
In Togo, Novissi (a mobile cash-transfer program) was launched in April 2020 to mitigate the impact of the
pandemic on workers in the informal sector. The state grants cover at least 30 percent of the minimum wage, with
payouts from CFAF 10,500 ($18) to CFAF 20,000 ($34). The beneficiaries are identified through their voter IDs and
receive the grants through mobile money, with a top-up for women. As of December 2020, about 1.4 million
individuals have registered and close to 600,000 have received a NOVISSI payment, of which 65 percent are women.
While eligibility was relatively unrestricted during the first three months, the grants now target workers in specific
districts recording a high coronavirus contagion rate.
8 INTERNATIONAL MONETARY FUND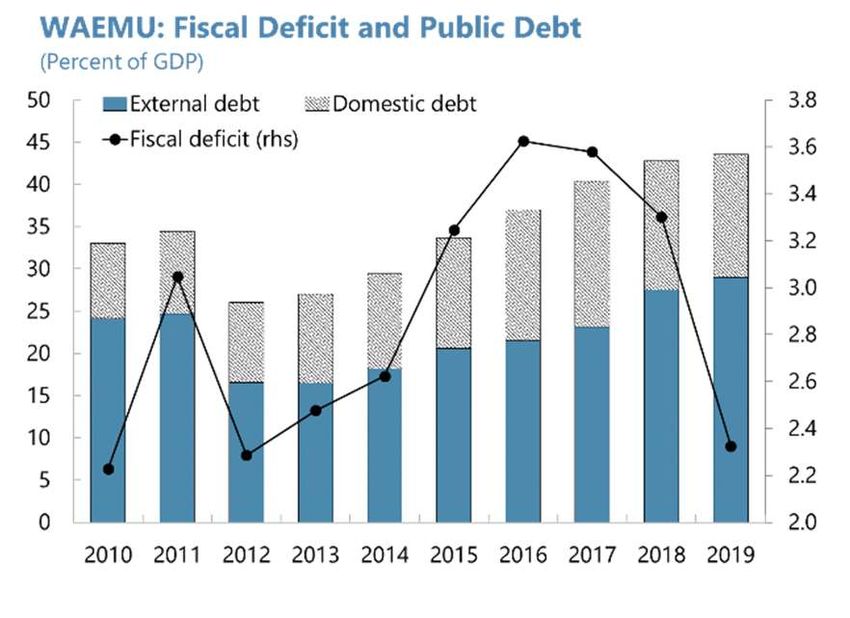
WEST AFRICAN ECONOMIC AND MONETARY UNION

15.      Higher fiscal deficits in 2020 are estimated to have been almost entirely financed by
external financial assistance from donors. The fiscal response was financed through a mix of
grants and additional borrowing, equivalent to about 3½ percent of GDP (Figure 10). About
40 percent of the external financing came from the IMF in the form of program augmentations,
emergency financing (RCF and RFI) and debt-service relief through the Catastrophe Containment
and Relief Trust (CCRT) (Figure 11). As a result, the public debt ratio is expected to have increased
further in 2020 and peak at 47.7 percent of GDP in 2021, while it was projected to gradually decline
from its peak in 2019 at 46.1 percent of GDP based on pre-Covid budget plans.

16.     To catalyze external support, WAEMU country authorities have made commitments to
improved transparency and accountability in the use of the funds provided by the
international community. Countries have put in place enhanced governance measures to track
Covid-related spending. While most member-states have announced that they would conduct
independent ex-post audits of crisis-related spending, some have also committed to their
publication (i.e. Mali and Niger), in addition to publishing crisis-related procurement contracts (i.e.
Benin, Mali, and Senegal) and identifying the companies awarded the contract and their beneficial
owners (i.e. Benin, Côte d’Ivoire, Mali, and Senegal). The authorities in Burkina Faso, Niger, Senegal
and Togo have set up new mechanisms to monitor expenses executed through the budget, by
donors, and in-kind support.4

C. Regional Monetary Policy Response

17.     Amid limited fiscal space, emergency support has also been provided by the regional
central bank. Like in other countries in SSA, the policy response to the Covid crisis also involved a
relaxation of monetary policy through a mix of additional liquidity provision and lower interest rates.
This accommodative monetary policy package is aimed at addressing initial liquidity shortages and
preventing market freezes. In addition, a key feature of central banks’ responses during the Covid
crisis worldwide has been the widespread deployment of complementary measures to support the

4
 These commitments were taken in the context of emergency financing arrangements provided to WAEMU
countries by the IMF in 2020. For example, for Benin, see country report n o. 2020/175.

                                                                   INTERNATIONAL MONETARY FUND       9
WEST AFRICAN ECONOMIC AND MONETARY UNION
flow of credit to households and non-financial corporations while enhancing the use of electronic
payments.
18. Since the beginning of the Covid-19 crisis, the primary aim of the BCEAO’s monetary
policy measures has been to prevent liquidity shortages. Before the crisis, the BCEAO provided
pre-set amounts of refinancing to banks through auctions against collateral in the form of
government securities.5 Since the Covid-19
financial crisis began, the BCEAO has introduced
several monetary policy measures to provide
ample liquidity to banks. As witnessed by the
lack of financial market pressures, these
measures have proven a very efficient way of
offsetting liquidity risk by ensuring banks’
continued access to liquidity. Average auction
rates for central bank refinancing operations
declined by about 0.75 percentage points
relative to March and are now at an historically
low level (Figure 12).
In March, the BCEAO shifted to a fixed-rate full
allotment (FRFA) tender procedure for the
refinancing auctions. This implied satisfying the
market’s demand for central bank liquidity in full at a
set interest rate. 6 Eligible WAEMU financial
institutions have now unlimited access to central
bank liquidity at the main refinancing rate, as always
subject to adequate collateral and financial
soundness. At the time of its introduction, the FRFA
policy (where all allocations have been served at the
minimum rate) reduced the average rate of
refinancing operations by about 25 basis points
compared to before the crisis.
In June, the BCEAO Monetary Policy Committee also cut by 50 basis points both the ceiling and
the floor of the interest rate corridor, to 4 and 2 percent respectively. This may seem limited
compared to the rate cuts observed in other SSA countries, but these countries do not operate
under a fixed exchange rate regime and the WAEMU policy rate is already one of the lowest in
Africa (Figure 13).
5
In the WAEMU, banks could not easily lend or borrow from each other in the interbank market to fulfil their
liquidity needs because of the financial fragmentation in the region (IMF, 2018, 2019, 2020).
6
Previously, the BCEAO auctioned a pre-set amount of central bank liquidity in variable rate tender procedures.
10 INTERNATIONAL MONETARY FUNDWEST AFRICAN ECONOMIC AND MONETARY UNION
19. Collateral-easing measures were also introduced by the BCEAO to complement its
liquidity-providing measures. In March the BCEAO extended the collateral framework for central
bank refinancing to include bank loans to prequalified 1,700 private companies. In combination with
the other measures, the new collateral framework has contributed to maintaining bank access to
ample liquidity at favorable terms and created a supportive environment for them to continue
lending to the economy. The collateral-easing measures has enlarged the pool of collateral available
for commercial banks and should facilitate the implementation of BCEAO refinancing operations.7 By
acting promptly and decisively, the BCEAO has, so far, avoided a situation in which banks would
have experienced an acute shortage of eligible collateral with adverse procyclical feedback effects.
20. Finally, the BCEAO implemented in 2020 the “Covid-19 T-Bill” program with the aim of
smoothing WAEMU governments’ cashflows and supporting orderly functioning of financial
markets. The purpose of the special short-term refinancing window was to help governments meet
their immediate financing needs in the first months of the crisis, before the emergency financing of
donors is disbursed later in 2020. This program supported market functioning by minimizing the
immediate impact of raising additional funding in regional security and money markets. In practice,
the program allowed banks to refinance special 3-month “Covid-19 T-Bills” issued in limited
amounts by WAEMU member states on the regional financial market with the assistance of the
WAEMU’s agency in charge of operating and developing the regional market for sovereign security
auctions (Agence UEMOA-Titres). The banks were able to submit these T-Bills for refinancing at a
special BCEAO window at the prevailing refinancing operations interest rate from the day of their
issue and at the latest one month after their acquisition for the remaining term of the security. The
"Covid-19 T-Bills" were the only eligible assets on this special window. The program, which was
introduced in April-May for a global amount of 1.3 percent of WAEMU GDP, was extended through
partial rollovers until the end of 2020 (Table 1).
21. The BCEAO has also introduced measures to promote the use of electronic payments.
Since the beginning of the crisis, the WAEMU authorities has encouraged the population to limit
physical contact by making more room for the use of digital payments. Several measures were taken
with the objective of reducing the costs of electronic money transactions. These included: free
nationwide bank money transfers (below a certain threshold); free electronic payments for electricity
and water bills via mobile phone; lower commissions paid by retailers for the use of electronic
payments; increase the ceiling of electronic wallets; reduction in fees applied to bank transfers; and
elimination of fees for cash ATM withdrawal within the GIM network (Groupement Interbancaire
Monétique de l'Union Economique et Monétaire Ouest Africaine).
7
As of end-December 2020, private sector claims accounted for 4.3 percent of the collateral portfolio held by the
BCEAO
INTERNATIONAL MONETARY FUND 11WEST AFRICAN ECONOMIC AND MONETARY UNION
Table 1. WAEMU: Covid-19 T-Bill Program, 2020
Phase 1 Rollover Phases 2-4 in CFAF bilion
(Apr-May) 1 (Jul-Aug) 1 (Oct-Nov) 2 (Nov-Dec) 2
CFAF bln % of Total % of GDP CFAF bln % of GDP CFAF bln % of GDP CFAF bln % of GDP
BEN 133.0 11.3 1.5 133.0 1.5 133.0 1.5 133.0 1.5
BFA 80.0 6.8 0.8 50.0 0.5 0.0 0.0 0.0 0.0
CIV 535.0 45.6 1.5 200.0 0.6 300.0 0.8 310.0 0.9
GNB 15.5 1.3 1.9 10.0 1.2 0.0 0.0 0.0 0.0
MLI 88.0 7.5 0.9 55.0 0.5 25.0 0.2 0.0 0.0
NER 110.0 9.4 1.4 100.0 1.3 110.0 1.4 0.0 0.0
SEN 103.0 8.8 0.7 103.1 0.7 103.1 0.7 103.1 0.7
TGO 108.0 9.2 3.2 70.0 2.1 0.0 0.0 0.0 0.0
WAEMU 1,172.5 100.0 1.3 721.1 0.8 671.1 0.7 546.1 0.6
Source: Agence UMOA Titres (AUT).
1
Three-month maturity.
2
One-month maturity.
D. Regional Regulatory and Supervisory Response
22. The BCEAO has taken swift and forceful supervisory measures to mitigate
procyclicality. As soon as the first containment measures were adopted in the WAEMU, the BCEAO
took decisions aimed at further increasing the WAEMU banking sector’s capacity to absorb losses
and support distressed firms and households, with a view to mitigating procyclicality.
23. The BCEAO has encouraged banks to work with their clients to help them weather the
crisis. A new “forbearance” framework was introduced in March 2020 and expired at end-2020.
Banks and microfinance institutions were encouraged to accommodate demands from solvent
clients with Covid-related repayment difficulties by postponing, for a 3-month renewable period,
debt service falling due, without reclassifying such postponed claims as non-performing. For
borrowers that were unable to obtain such deferral agreement with their banks without conciliation,
the BCEAO set up a monitoring and facilitation structure called "Covid-19 mechanism” which aimed
at strengthening the dialogue between firms and their financial intermediaries. As of the end-
August 2020 and according to the BCEAO, the total amount of bank loans for which some
repayment was deferred was equivalent to 5 percent of bank credit outstanding for the whole of
WAEMU.
24. The BCEAO also decided to extend by one year the five-year period for the transition
to Basel II/III bank prudential requirements. The transition started in 2018 and was initially
supposed to end in 2022. It will now end in 2023 (Table 2). The extra time will help banks rebuild
their capital buffers, which are likely to be eroded by potential losses on their assets. Also, the
regulatory capital adequacy ratio will remain unchanged at end-2020 from its 2019 level of
12 INTERNATIONAL MONETARY FUNDWEST AFRICAN ECONOMIC AND MONETARY UNION
9.5 percent, before gradually increasing to 11.5 percent by 2023. This approach was considered
more effective than allowing banks to draw down their capital conservation buffer. In addition, in
November 2020 and in order to ensure that the WAEMU banking sector continues financing the real
economy and has enough capital buffers to absorb losses, the BCEAO took actions to preserve
banks’ capital resources by temporarily limiting the distribution of dividends (related to 2020 profits)
for all banks.
Table 2. WAEMU: Regulatory Capital Requirements
2018 2019 2020 2021 2022 2023
In percent Initial Revised Initial Revised Initial Revised Initial Revised
Regulatory Risk Weighted CAR 8.6 9.5 10.4 9.5 11.3 10.4 11.5 11.3 11.5 11.5
Minimum 8.0 8.3 8.5 8.3 8.8 8.5 9.0 8.8 9.0 9.0
Conservation buffer 0.6 1.3 1.9 1.3 2.5 1.9 2.5 2.5 2.5 2.5
Memo items
CAR (Common Equity Tier 1) 5.0 5.0 5.0 5.0 5.0 5.0 5.0 5.0 5.0 5.0
CAR (Tier 1) 6.0 6.0 6.0 6.0 6.0 6.0 6.0 6.0 6.0 6.0
Source: BCEAO.
25. Nonetheless, regional authorities have not relaxed the prudential and accounting
requirements. In line with best practices, the BCEAO has not relaxed its standards, since this would
only incentivize excessive risk-taking and encourage banks to hide poor underwriting practices.
Regulatory constraints are not supposed to be lifted during crises. Various elements of flexibility are
embedded in banking regulation that can be used; buffers that have been built in good times can
be used in bad times.
INTERNATIONAL MONETARY FUND 13WEST AFRICAN ECONOMIC AND MONETARY UNION THE ECONOMIC AND POLICY IMPLICATIONS FOR THE WAEMU OF INSECURITY IN THE SAHEL 1 1. The WAEMU region experienced significant episodes of violent conflicts over the past two decades. During the 2000s, they mainly stemmed from political instability, particularly in Côte d’Ivoire, the WAEMU’s economic hub. Niger also suffered from political instability during the same decade culminating in a military coup in 2010. The restoration of peace in Côte d’Ivoire and the election of a democratic government in Niger in 2011 ushered in an era of stronger economic growth throughout the WAEMU until the Covid crisis in early 2020. 2 However, this progress is now coming under threat from the mushrooming conflict in the Sahel, which first emerged in Mali in 2012, grew in intensity there, spread to Burkina Faso from 2014, and exposes Niger to increasingly vicious cross-border attacks. In the context of pervasive corruption, widespread poverty, and high rates of youth unemployment and underemployment, observers fear that, absent stronger actions to stem the violence and address its root causes, the conflict could spread all the way to the coastal countries of West Africa.3 2. This chapter analyzes the regional economic impact of the deteriorating security situation and lays out options for economic policy responses. Economically, the conflict and the risk of dislocation of state authority affects growth prospects, development outcomes, and public finances of the afflicted countries, but there are also important potential repercussions for the entire WAEMU. Not only could the conflict spread to other members if not forcefully addressed in Burkina Faso, Mali, and Niger, but there could also be spillovers from the public finances of these three countries on the currency union’s shared external stability and exchange rate peg. It therefore takes a coordinated or common policy response to confront insecurity and at the same time preserve macroeconomic stability. Moreover, since spillovers do not stop at the WAEMU’s doorstep, success is in the interest of the wider region and beyond. Foreign aid makes it less hard for the WAEMU to square its twin objective of security and macroeconomic stability. A. Origin and Scope of Insecurity in the Sahel 3. The current security crisis in the Sahel region began with the Tuareg rebellion in Northern Mali in 2012. The independence drive by the rebel group National Movement for the Liberation of Azawad (MNLA) became a rebellion when the collapse of the Gaddafi regime in Libya 1 Prepared by Alain Féler, Martha Woldemichael, and Jiaxiong Yao under the overall guidance of Christoph Klingen. The authors are also grateful for comments received from Annalisa Fedelino (AFR), and Dominique Desruelle (AFR), Luc Eyraud (AFR), the WAEMU Commission and other regional authorities. 2 The analysis of this Chapter focuses on the situation until end-2019, before the Covid pandemic outbreak that has brought to an abrupt end the near-decade long period of high growth in the WAEMU. It therefore does not cover either event related to the August 2020 coup d’Etat in Mali. 3 “The geographic focus of terrorist attacks has shifted eastwards from Mali to Burkina Faso and is increasingly threatening West African Coastal States,” briefing to the UN Security Council of the Secretary General’s Special Representative to West Africa and the Sahel, January 8, 2020. 14 INTERNATIONAL MONETARY FUND
WEST AFRICAN ECONOMIC AND MONETARY UNION

in 2011 triggered an influx of Tuareg and heavy weaponry, Mali’s president was ousted in a military
coup in 2012, and the group Ansar Dine joined the fight. Most of Northern Mali fell into rebel hands.
They were pushed back when France launched its operation “Serval” in December 2012 and
deployed troops. Nonetheless and despite the installation of the 13,000-man-strong UN
peacekeeping mission MINUSMA, a newly elected government, and a peace agreement with the
rebel groups, state control in Northern Mali remains tenuous and insecurity persists.

4.       Insecurity spread to Burkina Faso in late 2014. The home-grown Ansarul Islam
movement, the Islamic State in the Greater Sahara, and the Al-Qaeda linked Group to Support Islam
and Muslims exploited the circumstances created by the ouster of the president in a popular
uprising and long-standing discontent in Northeastern Burkina Faso with the perceived neglect by
the central government. They recruited heavily from the discriminated ethnic Fulani minority, which
in turn triggered reprisals, vigilante groups were formed, and armed groups became radicalized.
Burkina Faso’s capital Ouagadougou suffered major attacks in 2016, against a luxury hotel and
restaurants, and in 2018, against the military headquarters and the French embassy. Since April
2019, terrorists have targeted churches, undermining Burkina Faso’s culture of religious
co-existence, and violence has spread from the northern border with Mali to the eastern border
region with Niger, making Burkina Faso the “epicenter” of the conflict in the Sahel.

5.      Separately, the terror group Boko Haram in Northeastern Nigeria became more and
more deadly. Founded in 2002 as a non-violent group seeking to purify Islam, Boko Haram became
increasingly radicalized. Government forces successfully fought it at first, but Boko Haram
reconstituted itself and by 2014 controlled vast swarths of land in Northeastern Nigeria. It pledged
allegiance to the Islamic State in Iraq and the Levant in 2015. While it lost territory in 2019, Boko
Haram remains one of the world’s deadliest terror groups with incessant attacks in the Lake Chad
region, comprising territories in Nigeria, Chad, Cameroon, and Niger.

6.      Niger is now surrounded by violence. Conflict rages along its porous borders with Mali
and Burkina Faso, Boko Haram terrorizes the Lake Chad region, and chaos reigns in Libya to the
north. Terrorism has generally not become entrenched in Niger itself, but it suffers increasingly
ferocious cross-border incursions. Two attacks on military camps close to the border with Mali in
December 2019 and January 2020 left over 150 soldiers dead. The fight against terrorism is further
complicated by it being intertwined with other criminal activity, such as the trafficking of drugs,
weapons, and migrants along its ancient cross-Saharan trading routes.

7.      The security situation in the Sahel keeps deteriorating rapidly. Terrorist incidents rose
70 percent in 2019 alone to reach 800 in the G5-Sahel countries (Burkina Faso, Chad, Mali,
Mauritania, and Niger).4 Burkina Faso has narrowly overtaken Mali as the country with the worst
violence. Niger and Chad each report about one-third of the level recorded in Burkina Faso or Mali.

4
 Incident data are sourced from “Risk Control.” This provider defines a terrorist incident as “violent incidents
conducted by non-state actors against state or civilian targets to advance an ideological cause by influencing a wider
audience, e.g. bombings, assassinations, hostage-taking, attacks using chemical, biological, radiological or nuclear
agents (CBRN).”

                                                                           INTERNATIONAL MONETARY FUND             15
WEST AFRICAN ECONOMIC AND MONETARY UNION
Mauritania remained largely free of terrorist incidents. Attacks have also become more ferocious,
with more victims per incident and the targeting of village chiefs to inflict maximum damage to the
social fabric of rural communities.
8. The violence is taking a heavy humanitarian toll on countries already facing multiple
challenges, including the Covid pandemic. The Sahel has long been grappling with fragilities,
including high poverty levels, inequality and exclusion, climate change, food crises, rapid population
growth, and the illicit trafficking of migrants, drugs, and weapons across borders. 5 Fatalities from
violent events involving extremist groups have doubled every year since 2015, reaching 5,500 in the
G5-Sahel countries in 2019, of which 4,000 occurred in Burkina Faso, Mali, and Niger. 6 There are now
1.1 million internally displaced people and 750,000 refugees in the G5-Sahel countries.7 Urgent food
assistance needs have doubled to 2.4 million people in Burkina Faso, Mali, and Niger.8 An estimated
2,000 schools are closed in the conflict zones of Burkina Faso, Mali, and Niger, putting 10,500
teachers out of work and interrupting the education of some 400,000 children.9
9. Foreign assistance has, so far, not been able to turn the tide. In August 2014, the French
“Serval” operation with its mandate for Mali was replaced by the operation “Barkhane,” which is
tasked with fighting terrorism throughout the Sahel and comprises 4,500 men. In the wake of the
January 2020 summit in Pau, France committed 600 additional troops and joint command and
control with the G5-Sahel militaries was agreed. Some 800 American military personnel are
stationed in Niger for training and intelligence purposes, as well as for operating a newly built drone
base, which serves the entire region. European countries provide another 600 men to provide
training and there is the mainly African-staffed MINUSMA blue helmets mission. On the civilian side,
the Sahel Alliance was launched in July 2017 by France and Germany, with other countries and
5
In turn, together with pervasive corruption, widespread poverty and high rates of youth unemployment and
underemployment is creating fertile ground for terrorist groups to recruit and to sow violence.
6
According to the Armed Conflict Location and Event Data (ACLED) project. On an annualized basis, during the first
7 months of 2020, fatalities surged by 65 percent while incidents declined by about a third relative to 2019.
7
According to the UNHCR.
8
According to the Food Crises Prevention Network and the World Food Program (WFP).
9
In early 2019, according to UN Security Council, CS/13810, May 2019.
16 INTERNATIONAL MONETARY FUNDWEST AFRICAN ECONOMIC AND MONETARY UNION
institutions, including the World Bank, subsequently joining. It aims to implement over 800 projects
at a cost of €11.6 billion until 2022 to address all current challenges—security, demographic,
economic, and social. At the August 2019 Biarritz G7 summit France and Germany announced the
Partnership for Security and Stability for the Sahel (P3S), encompassing the countries of the region
and their partners in a spirit of shared responsibility. It has yet to be launched. At the Pau Summit in
January 2020, the International Coalition for the Sahel was launched by the Heads of State of France,
Burkina Faso, Chad, Mali, Mauritania and Niger. The Coalition ambitions to provide a collective
response to the challenges of the Sahel region by pooling the work undertaken by the G5 Sahel
States and their international partners.
10. Regional initiatives have yet to develop their potential, despite external pledges and
regional commitments of substantial new resources. To better tackle the cross-border nature of
terrorism, the G5-Sahel Joint Fighting Force was established in July 2017. It is due to include 5,000
military personnel from Burkina Faso, Chad, Mali, Mauritania, and Niger. The necessary €414 million
to train and equip it have been pledged, though not fully disbursed as of now, and the force is not
yet fully operational. Separately, there is also a Multinational Joint Task Force of the Lake Chad Basin
made up by the militaries of Cameroon, Chad, Niger, and Nigeria to fight Boko Haram. The WAEMU
has committed US$500 million over 2020-24 to fight terrorism in the region and it announced a first
disbursement of US$100 million for the benefit of Burkina Faso, Mali, and Niger. At its December
2019 summit, the ECOWAS adopted an action plan of US$2.3 billion for regional security, including
US$1 billion from internal resources. As spending on these initiatives grows and accelerates,
adequate controls must be continually implemented to prevent the leakage of donor and internally
generated funds, whether to corruption or to mismanagement.
B. The Impact of Insecurity on Economic Activity
11. Empirical research finds large and persistent adverse growth effects from conflict in
sub-Saharan Africa. According to the SSA Regional Economic Outlook (IMF, 2019), annual real GDP
growth in the average country with high-intensity conflict is 3.2 percentage points lower than it
would have been in the absence of conflict, which translates into a cumulative loss of 15-20 percent
in per-capita income for episodes that last five years or longer. Together with the destruction of
human and physical capital, conflict reduces growth via lower investment, trade, and productivity.10
Conflict intensity is the key determining factor for the size of the adverse growth effect, but it also
matters whether conflicts afflict a county’s commercial hub or just economically peripheral regions.
Also, everything else equal, stronger institutions and better fiscal fundamentals seem to have a
mitigating effect.11
10
A conflict that claims 29 or more deaths per million of people per month is considered “high intensity.”
11
IMF Sub-Saharan African Regional Economic Outlook: “The Economic Consequences of Conflict”, Spring 2019.
INTERNATIONAL MONETARY FUND 17WEST AFRICAN ECONOMIC AND MONETARY UNION
12. As predicted by this empirical research, Mali’s economic performance in 2012 and
2013 suffered substantially. GDP contracted by 1.5 percent in 2012, when the military coup
destabilized the domestic political
Figure 3. Mali: Real GDP Growth and Components,
situation, insurgents took control of
2001–19 (Percent)
Northern Mali, and half a million people 16
were displaced. In the absence of a
14
12
legitimate government, donors 10
8
suspended all budget support and slowed 6
down project aid. Construction, public
4
2
works, and tourism suffered. But strong 0
-2
performance in gold mining, cotton, and -4
2001 2002 2003 2004 2005 2006 2007 2008 2009 2010 2011 2012 2013 2014 2015 2016 2017 2018 2019
a recovery in agriculture helped soften
Primary Sector Secondary Sector Tertiary S ector Other Total
the blow. In 2013, GDP grew by
2.3 percent, as the normalization of the political situation allowed for the organization of
presidential and legislative elections in the second semester and the security situation started to
improve following early successes of the French-led military intervention in Northern Mali. The
decline of the 2012–13 growth performance to 0.7 percent from 4.3 percent previously appears
broadly in line with the estimations for the effect of conflict in sub-Saharan Africa.
13. In contrast, GDP estimates for Burkina Faso, Mali, and Niger do not point to a
significant growth slowdown since Figure 4. WAEMU: Real GDP Growth, 2001–19
2014 when violence started (Percent)
escalating. During 2014–19, annual real 12
10
GDP growth averaged 5.7 percent, 8
broadly in line with the growth 6
4
performance of other WAEMU 2
0
members, except for Côte d’Ivoire, -2
which rebounded from a decade of -4
-6
political instability and civil war. This
points to terrorist-related violence
WAEMU BFA-MLI-NER CIV BEN-GNB-SEN-TGO
having had a materially smaller growth
impact than the estimations for
sub-Saharan Africa would suggest.
14. The seemingly muted impact of violence on the GDPs of Burkina Faso, Mali, and Niger
could be due to the concentration of security incidents in regions of relatively low economic
activity. Incidents have mainly taken the form of sporadic terrorist attacks along the borders of
Burkina Faso, Mali, and Niger, often in desert regions. Specifically: (i) the northern parts of the
border provinces “Sahel,” “Centre Nord,” and “Nord” in Burkina Faso, as well as the “Centre Est”
province bordering Benin; (ii) the provinces “Gao,” “Kidal,” and “Mopti” in Mali; and (iii) in Niger
along the borders with Mali in the provinces “Tahoua” and “Tillabéry,” as well as in the “Diffa” region
18 INTERNATIONAL MONETARY FUNDWEST AFRICAN ECONOMIC AND MONETARY UNION
near Lake Chad in the
Figure 5. WAEMU: Provinces Including Zones Mainly Afflicted
Southeast. While accounting
by Ongoing Violence: Area, Population and Night Lights
for a large part of the
(Percent of National Data)
countries’ territories, 40
relatively low population 35
30
density and economic 25
activity disproportionately 20
15
concentrated in subsistence
10
farming, their economic 5
0
weight is bound to be much
Burkina Faso Mali Niger
lower. In the absence of Nightlights Population Area
subnational data on
economic activity, regional
economic activity is measured by night-light intensity. 12 On this basis, the conflict areas account for
9, 4, and 13 percent of the national GDP in Burkina Faso, Mali and Niger, respectively.13
Figure 6. WAEMU: Conflict Locations, 2012, 2015, 2018
12
For some research finding showing that night-light intensity is a good proxy for real GDP, see Henderson,
Storeygard and Weil, 2012. The independent nature of night-light intensity means that this measure of economic
activity is less susceptible to systematic measurement error. It is also a useful variable for conflict cases, when data on
economic activity is unavailable or unreliable.
13
Livelihood zoning maps and reports from USAID provide also useful information on the spatial distribution of
economic activity in Burkina Faso, Mali and Niger.
INTERNATIONAL MONETARY FUND 19WEST AFRICAN ECONOMIC AND MONETARY UNION
15. Econometric analysis clarifies that the surge in violence does have a statistically
significant and detrimental impact on growth in the afflicted regions but that it is
quantitatively much smaller than
in sub-Saharan Africa on average. Table 1. WAEMU: Impact of Conflict on Night Lights
An estimation tailored to the
WAEMU region shows a significant VARIABLES Night Lights Growth
World SSA WAEMU
effect of conflict intensity on night-
light growth. A conflict causing Deaths per 1000 people -0.312 ** -0.411 *** -0.182 ***
Robust standard error (0.130) (0.141) (0.057)
7 fatalities per million of population
in one month is estimated to Control variables
Night Lights (lag)
reduce annual night lights by about Country x Time Fixed Effects
State/Province Fixed Effects
0.13 percent, equivalent to Observations 179,681 41,481 4,835
0.06 percent of annual GDP.14 For R-squared 0.539 0.490 0.503
No of States/Provinces 2,948 615 71
79 fatalities per million, the
*** p ˂ 0.01; ** p ˂ 0.05; * p ˂ 0.1;
negative growth effect comes to an
estimated 0.7 percent of annual GDP . Estimations for all of sub-Saharan Africa or the world find an
effect of violence on economic activity more than two times stronger than in the WAEMU. This may
reflect non-linearities in the association between conflict intensity and economic activity. For all its
dramatic consequences, the conflict in the WAEMU is far below the intensity of full-fledged civil wars
that other parts of Africa and the world had to endure over the years.
16. The concentration of the conflict in the economically weaker areas of Burkina Faso,
Mali, and Niger, together with its relatively low intensity make for an overall limited growth
impact, consistent with the evolution of the macroeconomic headline numbers. Using the
economic-impact coefficient derived from the customized WAEMU regression and adding up the
regional effects yields a cumulative real GDP loss of between 0.5 and 1.4 percent for the three
countries, depending on whether population or night-light weights are used in the aggregation over
regions. The corresponding output loss for the WAEMU as a whole comes to between 0.1 and
0.4 percent of GDP.
17. That said, the toll on economic activity could easily escalate if violence is not
expeditiously contained and rolled back. First, the growth effect for the three countries would
become much stronger if violence were to creep closer to the centers of economic activity. Second,
the situation would altogether change for the worse if violence spread to more WAEMU counties,
particularly the economic heavyweights Côte d’Ivoire and Senegal. Third, if the violence were to
escalate further in Burkina Faso, Mali, and Niger, the relatively weak association with economic
activity observed in the rest of the WAEMU so far could increase substantially. Fourth, violence could
have long-term effects on economic development because of the disruptions it causes to education
and health care. Finally, the dynamic effects of sustained violence are not yet fully understood and
may not be sufficiently captured in the regressions.
14
The impact on night-light growth is obtained by multiplying the estimated coefficient for the change in night
growth per thousand fatalities (-0.182) by the conflict density (7 per million or .007 per thousand fatalities).
20 INTERNATIONAL MONETARY FUNDWEST AFRICAN ECONOMIC AND MONETARY UNION
Table 2. WAEMU: Impact of Violent Conflict on Real GDP Growth, 2014–19
2014 2015 2016 2017 2018 2019 2014-19
(avg) (cum)
(Regions weighted by population shares)
WAEMU 0.0 0.0 0.0 0.0 -0.1 -0.2 -0.1 -0.4
BFA-MLI-NER 0.0 -0.1 -0.1 -0.1 -0.3 -0.8 -0.2 -1.4
BFA 0.0 0.0 0.0 0.0 -0.1 -1.1 -0.2 -1.1
MLI -0.1 -0.1 -0.1 -0.3 -0.6 -0.9 -0.3 -2.1
NER 0.0 -0.2 -0.1 -0.1 -0.1 -0.4 -0.2 -1.0
Other WAEMU 0.0 0.0 0.0 0.0 0.0 0.0 0.0 0.0
(Regions weighted by night-light shares)
WAEMU 0.0 0.0 0.0 0.0 0.0 0.0 0.0 -0.1
BFA-MLI-NER 0.0 -0.1 -0.1 -0.1 -0.1 -0.2 -0.1 -0.5
BFA 0.0 0.0 0.0 0.0 0.0 -0.5 -0.1 -0.6
MLI 0.0 0.0 0.0 -0.1 -0.1 0.0 0.0 -0.3
NER 0.0 -0.2 -0.1 -0.1 -0.1 0.0 -0.1 -0.6
Other WAEMU 0.0 0.0 0.0 0.0 0.0 0.0 0.0 0.0
Sources: ACLED; and IMF staff estimates.
C. Fiscal Impact of Insecurity in WAEMU’s Sahel Countries
18. The conflict puts multiple pressures on the public finances of the afflicted countries.
The most direct effect comes from the necessary increase of budgetary outlays for the military, the
national guard, the gendarmery, and the police to confront the security challenge. Fiscal revenue
collection could also be disrupted. These pressures could be attenuated to the extent that donors
provide more aid and governments manage to implement revenue measures. Otherwise they are
bound to crowd out other spending or increase fiscal deficits. Room to let deficits rise is limited—for
the WAEMU as a whole they have just been brought down from the high levels in the mid-2010s to
underwrite the currency union’s external stability.
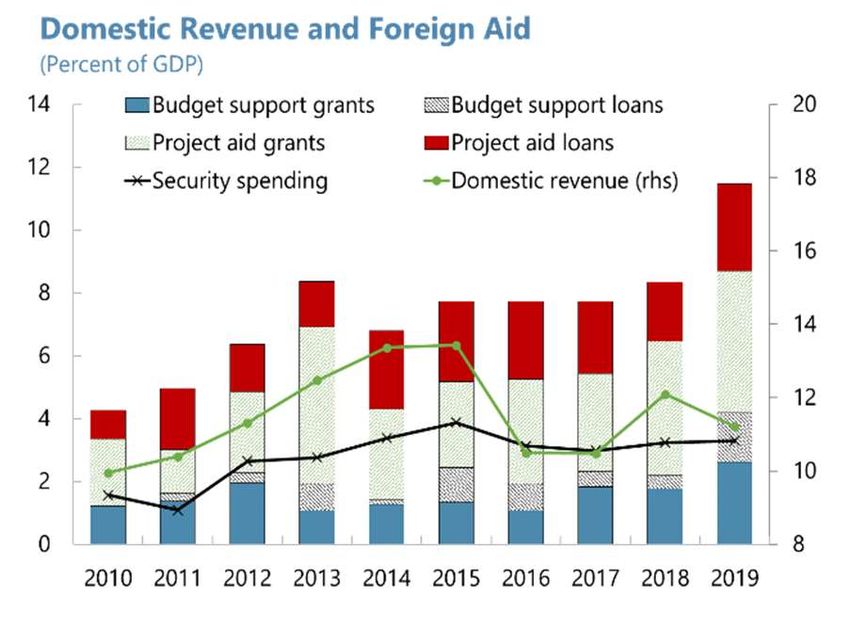
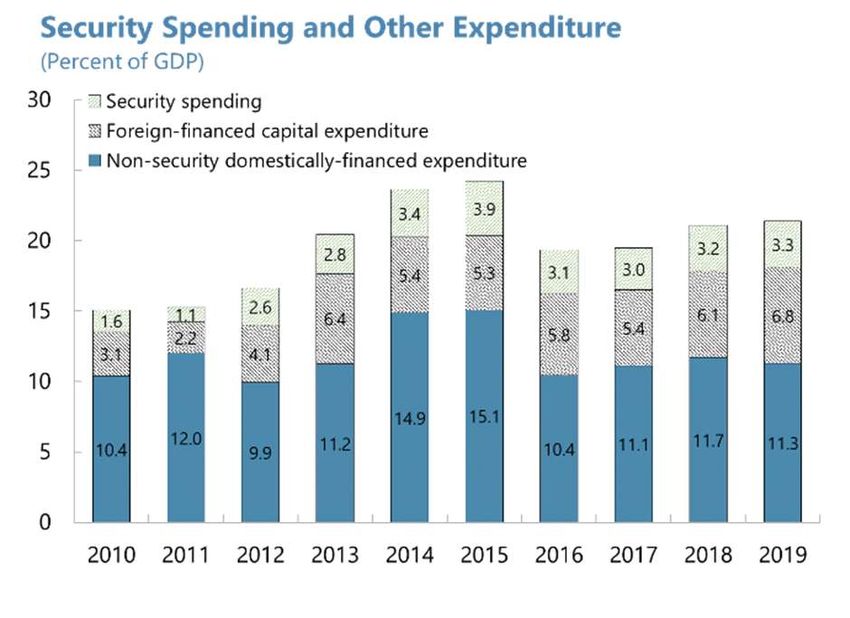
19. The budgetary burden of increased security spending is high. Security spending has
rightly been a top priority in the WAEMU Sahel countries, as security is a prerequisite for achieving
development and social objectives. From the onset of insecurity until end-2019, military spending
has roughly doubled, equivalent to an increase of 2 percent of GDP (equivalent to about US$850
million). This weighs heavily on the public finances of countries that face challenges in mobilizing
domestic revenues.
20. The worsening security situation in Burkina Faso, Mali, and Niger has hampered
domestic revenue mobilization efforts, albeit only to a limited extent until 2019. Terrorism can
erode the tax base and weaken the efficiency of tax administration through physical destruction of
businesses (Ndikumana, 2011). While some researchers identify material adverse effects of conflict
on the revenue-to-GDP ratio (IMF, 2019), other studies find only a marginal impact (Cevik and Ricco,
2015) or no statistically significant effect at all (Gupta et al., 2004). In the Sahel, one would expect
the loss of state control in some areas, disruptions to cross-border trade, increased smuggling, and
the collapse of the tourism industry to all weigh on revenue mobilization. Since most of these
channels play into reduced economic activity, applying the GDP loss derived in the previous section
to countries’ revenue-to-GDP ratio gives a rough estimate of the revenue loss. With the output loss
INTERNATIONAL MONETARY FUND 21WEST AFRICAN ECONOMIC AND MONETARY UNION
so far limited, the revenue loss is also small, ranging from 0.1 to 0.4 percent of GDP cumulatively for
the period 2014–19, depending on the country and the weighing of the afflicted regions within
them. That said, just as with the growth impact, the revenue loss could be magnitudes higher if the
conflict was further prolonged, spread to the economic centers of the three countries, or started to
afflict other WAEMU countries.
Figure 7. WAEMU: Terrorism, Fiscal Deficit, and Public Debt, 2010–19
Sources: Control Risk; WEO; country authorities; and IMF staff calculations.
22 INTERNATIONAL MONETARY FUNDYou can also read