West Coast Trade Report - Pacific ...
←
→
Page content transcription
If your browser does not render page correctly, please read the page content below
West Coast Trade Report
                                                                                                             March 2021

A First Glimpse at February’s TEU Counts
Note: The ports we survey take anywhere from a few days       2018. Outbound loads from LA were meanwhile off from
to a few weeks to report their container trade statistics.    a year earlier by 24.7% and by 29.0% from the February
Because West Coast ports are generally much quicker in        before that. Total container traffic through the port this
releasing their monthly TEU tallies than their rival ports    February amounted to 799,315 TEUs, a 46.9% surge over
elsewhere in the country, these “First Glimpse” numbers are   the same month last year but also a handy 13.3% gain
necessarily incomplete and may give a misleading indication   over February 2019.
of the latest trends.                                         Next door at the Port of Long Beach, this year’s second
A few ports have already announced their February             month was its busiest February ever, with a total of
container tallies. But remember, we’re entering a period      771,735 loaded and empty TEUs crossing its docks.
in which the customary year-over-year comparisons we          Inbound loads (373,756 TEUs) were up 2.6% from January,
provide will be severely skewed by last year’s outbreak       up 50.3% from a year earlier, and 23.4% ahead of February
of the COVID-19 virus and the lockdowns (of varying           2019. Outbound loads (119,416 TEUs) were up 2.7% from
intensity) imposed in hopes of stemming the plague’s          the previous month, down 4.9% year-over-year, but up
spread. So for the time being, we’ll cite an additional       13.4% from two years ago.
number for the inbound loads through each port we             No less impressive was February’s 26.2% year-over-year
monitor: the change from the month before, from the           jump in inbound loads at Oakland to 80,200 TEUs. That
same month in 2020, and from the same month in 2019, a        was up 3.6% from January and 14.6% above the port’s
year in which things were arguably less chaotic.              inbound loaded traffic back in February 2019. Outbound
Let’s start with February in sunny Southern California.       loads at the East Bay port were off by 11.1% from a year
                                                              earlier, but up 2.6% from February 2019.
At the Port of Los Angeles, inbound loads for the month
totaled 412,884 TEUs, down 5.7% from January but up           At the Ports of Tacoma and Seattle, operating jointly as
a stunning 52.9% over the 270,025 TEUs discharged at          the Northwest Seaport Alliance, import loads in February
the port a year earlier. February’s inbound loads also        totaled 101,091 TEUs, down 11.4% from the preceding
represented a more modest 18.5% bump over February            month but up 10.3% over a year earlier and up 1.4% from
2019 and even more humble 7.8% increase over February         February 2019. Export loads, meanwhile, were down

Pacific Merchant Shipping Association
70 Washington Street, Suite 305, Oakland, CA 94607
                                                                                                 pmsaship.com
510-987-5000 info@pmsaship.com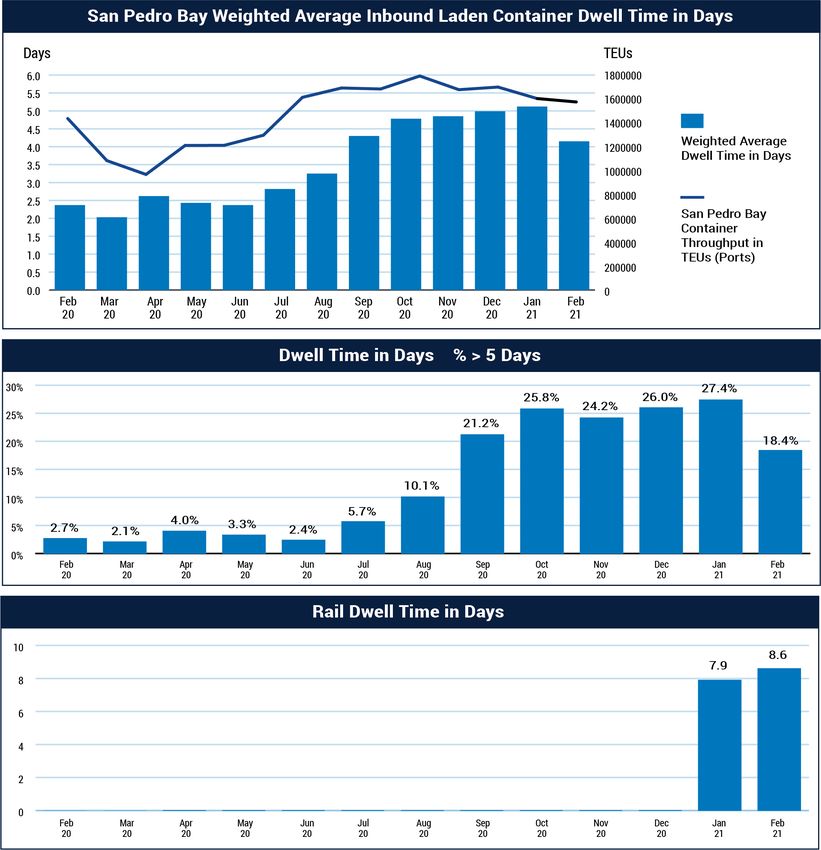
West Coast Trade Report

A First Glimpse at February’s TEU Counts Continued

13.6% year-over-year and were 9.9% below February             326,853 TEUs, off by 1.5% from a year earlier and by 1.9%
2019’s level.                                                 from February 2019.
Collectively, the major USWC maritime gateways handled        Now back East, Boston had a dreadful February with
967,931 inbound loads in February. That was down by           import loads down 54.6% and outbound loads off by
2.6% from the 993,350 loaded inbound TEUs the ports had       27.6%. Elsewhere on the East Coast, Virginia saw its
handled in January, but it was up 43.6% from a year earlier   February inbound load volume slide by 15.7% from
and 17.9% higher than in February 2019. Outbound loads        January but increase by 8.2% from a year earlier and by
from the USWC ports totaled 349,430 TEUs, a decline of        4.7% from February 2019. Outbound loads were up from
14.1% from the previous February and 8.4% below the           January and from all previous Februarys. At Charleston,
381,289 outbound loads the same ports handled in the          inbound loads in February, the port’s least busy import
second month of 2019.                                         month since last July, fell by 14.2% from January and by
                                                              7.1% from a year earlier. They were up, however, by 5.6%
Up across the border in British Columbia, Vancouver
                                                              over February 2019. Outbound loads declined by 9.2%
posted an 8.7% year-over-year increase in inbound loads,
                                                              year-over-year.
but that was erased by a huge plunge of 32.0% at Prince
Rupert, leaving the two Canadian ports with a February        On the Gulf Coast, Houston’s inbound loads plummeted
import total of 162,083 loaded TEUs, off sharply from         by 24.0% a month earlier and were down by 28.0% from
the 211,426 TEUs of imports they received in January.         February 2020. They were up 6.3% from February 2019.
February’s inbound loads were also down 4.6% from last        Outbound loads were down sharply both from January
year and were 0.2% below their February 2019 volume.          (-19.9%) and year-over-year (-28.0%). The 198,763 total
Outbound loads from the two amounted to 136,285 TEUs,         TEUs (full + empty) Houston handled in February was the
up 2.0% from a year ago and 9.5% from February 2019.          lowest volume of container traffic at the port in any month
Total container traffic through the two ports came to         since February 2019.

Parsing the January 2021 TEU Numbers
Please note: The numbers here are not derived from            Next door at the Port of Los Angeles, inbound loads
forecasting algorithms or the partial information available   totaled 437,609 TEUs, up 5.5% from a year earlier but
from U.S. Customs and Border Protection but instead           down 5.0% from December. As was the case at Long
represent the actual TEU counts as reported by the major      Beach, January yielded the smallest number of inbound
North American seaports we survey each month. The U.S.        loads at the port in any month since June.
mainland ports we monitor collectively handle over 90% of     Together, the two San Pedro Bay ports posted a 10.6%
the container movements at continental U.S. ports.            (+77,172 TEUs) increase in inbound loads over January
The Port of Long Beach reported that inbound loaded           2020. However, that was 7.5% shy of December, when
TEUs in the year’s first month totaled 364,255. While that    the two ports handled 866,937 TEUs. Inbound loads in
represented a 17.5% (+54,294 TEUs) jump over the first        January were at the lowest level since last June.
month of 2020, it marked a 10.3% fall-off from the 406,072    Up the coast, the Port of Oakland continued to be
inbound loads the port handled in December. January was       impaired by congestion at San Pedro Bay. Inbound loads
Long Beach’s least busy month for inbound loads since         in January were down 11.9% (-10,466 TEUs) from a year
last June.                                                    earlier. The East Bay port’s inbound traffic in January

                                                                                                March 2021        Page 2
West Coast Trade Report
Parsing the January 2021 TEU Numbers Continued
was also down 14.2% from December.
Exhibit 1 January 2021 - Inbound Loaded TEUs at Selected Ports
Further up the coast, the Northwest
Seaport Alliance (NWSA) Ports of Jan 2021 Jan 2020 % Jan 2021 Jan 2020 %
Tacoma and Seattle started the year Change YTD YTD Change
with a 10.9% (+11,205 TEUs) year-over-
year increase in import loads. January’s Los Angeles 437,609 414,731 5.5% 437,609 414,731 5.5%
imports were also down 6.8% from Long Beach 364,255 309,961 17.5% 364,255 309,961 17.5%
December.
San Pedro Bay
801,864 724,692 10.6% 801,864 724,692 10.6%
Altogether, the five major U.S. West Totals
Coast container ports saw an 8.5%
Oakland 77,403 87,869 -11.9% 77,403 87,869 -11.9%
(+77,911 TEUs) increase in inbound
loads from January 2020. This NWSA 114,083 102,878 10.9% 114,083 102,878 10.9%
January’s volume was also down 8.0%
USWC Totals 993,350 915,439 8.5% 993,350 915,439 8.5%
(-86,276 TEUs) from December.
Boston 10,851 13,402 -19.0% 10,851 13,402 -19.0%
The two ports in British Columbia we
track both recorded year-over-year NYNJ 371,392 322,643 15.1% 371,392 322,643 15.1%
gains in January. Inbound loads at
Maryland 43,576 45,268 -3.7% 43,576 45,268 -3.7%
Prince Rupert edged up 2.2% (+1,095
TEUs), while Vancouver posted a 12.2% Virginia 130,777 108,884 20.1% 130,777 108,884 20.1%
(+17,577 TEUs) increase over January
South Carolina 95,478 90,665 5.3% 95,478 90,665 5.3%
2020. Together, the two saw a 9.7%
(+18,672 TEUs) year-over-year increase. Georgia 232,645 188,762 23.2% 232,645 188,762 23.2%
However, January inbound loads were
down 6.7% from December. Jaxport 33,560 26,698 25.7% 33,560 26,698 25.7%
Port Everglades 26,832 26,451 1.4% 26,832 26,451 1.4%
Along the Eastern Seaboard, the
nine ports we track reported 996,371 Miami 51,260 35,225 45.5% 51,260 35,225 45.5%
inbound loaded TEUs in January. That
was up 4.2% from the 955,807 inbound USEC Totals 996,371 857,998 16.1% 996,371 857,998 16.1%
loads that had arrived in December. New Orleans 9,414 12,514 -24.8% 9,414 12,514 -24.8%
This January’s inbound loads were
up 16.1% over the 857,998 TEUs they Houston 121,578 105,047 15.7% 121,578 105,047 15.7%
had handled in January 2020 and USGC Totals 130,992 117,561 11.4% 130,992 117,561 11.4%
13.3% higher than the 879,149 TEUs in
January 2019. Vancouver 161,183 143,606 12.2% 161,183 143,606 12.2%
The most impressive year-over-year Prince Rupert 50,243 49,148 2.2% 50,243 49,148 2.2%
gain was recorded by Savannah. There, BC Totals 211,426 192,754 9.7% 211,426 192,754 9.7%
import loads rose 23.2% (+43,883
TEUs) over January 2020 and 3.6% US/BC Totals 2,353,358 2,079,760 13.2% 2,353,358 2,079,760 13.2%
(+7,989 TEUs) over December 2020.
US Total 2,120,713 1,890,998 12.1% 2,120,713 1,890,998 12.1%
Virginia also posted strong gains, 20.1%
(+21,893 TEUs) from a year earlier as USWC/BC 1,204,776 1,108,193 8.7% 1,204,776 1,108,193 8.7%
Source Individual Ports
March 2021 Page 3West Coast Trade Report
Parsing the January 2021 TEU Numbers Continued
well as a 6.1% (+7,559 TEUs) increase Exhibit 2 January 2021 - Outbound Loaded TEUs at
over December. Charleston reported a Selected Ports
more modest year-over-year bump of
5.3% (+4,813 TEUs) in the year’s first
Jan 2021 Jan 2020 % Jan 2021 Jan 2020 %
month. Miami saw the sharpest rate Change YTD YTD Change
of year-over-year growth with a 45.5%
Los Angeles 119,327 148,206 -19.5% 119,327 148,206 -19.5%
(+16,035 TEUs) burst. By contrast, Port
Everglades recorded a 1.4% increase Long Beach 116,254 108,624 7.0% 116,254 108,624 7.0%
over a year earlier, and a 3.9% fall-off
San Pedro Bay
from December. Jaxport posted a 25.7% 235,581 256,830 -8.3% 235,581 256,830 -8.3%
Totals
gain (+6,862 TEUs) in January from a
year earlier. Oakland 69,147 77,932 -11.3% 69,147 77,932 -11.3%
Along the Gulf Coast, Houston NWSA 57,517 66,410 -13.4% 57,517 66,410 -13.4%
recorded a 15.7% (+16,531 TEUs) jump
USWC Totals 362,245 401,172 -9.7% 362,245 401,172 -9.7%
in inbound loads over the previous
January. However, that was down 4.1% Boston 6,692 6,965 -3.9% 6,692 6,965 -3.9%
from December. New Orleans suffered NYNJ 108,738 118,488 -8.2% 108,738 118,488 -8.2%
a 24.8% year-over-year drop in inbound
loads. Maryland 19,904 20,361 -2.2% 19,904 20,361 -2.2%
Export numbers along the USWC in Virginia 84,688 79,328 6.8% 84,688 79,328 6.8%
January were down by 9.7% (-38,927 South Carolina 67,937 68,505 -0.8% 67,937 68,505 -0.8%
TEUs) from a year earlier. Long Beach
did post a 7.0% year-over-year gain in Georgia 113,365 121,960 -7.0% 113,365 121,960 -7.0%
outbound loads, but that was more Jaxport 43,614 41,941 4.0% 43,614 41,941 4.0%
than offset by a 19.5% plunge at Los
Angeles, leaving the San Pedro Bay Port Everglades 30,795 33,483 -8.0% 30,795 33,483 -8.0%
ports 8.3% (-21,249 TEUs) shy of the Miami 27,610 35,324 -21.8% 27,610 35,324 -21.8%
previous January’s export load tally.
Oakland saw an 11.3% fall-off (-8,785 USEC Totals 503,343 526,355 -4.4% 503,343 526,355 -4.4%
TEUs), while export shipments from New Orleans 21,436 26,213 -18.2% 21,436 26,213 -18.2%
the two NWSA ports tumbled by 13.4%
(-8,893 TEUs). Houston 99,694 118,782 -16.1% 99,694 118,782 -16.1%
Elsewhere, Savannah’s outbound loads USGC Totals 121,130 144,995 -16.5% 121,130 144,995 -16.5%
were down 7.0% (-8,595 TEUs), while Vancouver 79,194 78,156 1.3% 79,194 78,156 1.3%
Charleston’s exports dipped by 0.8%
(-568 TEUs). Boston slipped by 3.9% Prince Rupert 16,619 9,735 70.7% 16,619 9,735 70.7%
(-273 TEUs). On the other hand, Virginia British Columbia
reported a 6.8% (+5,360 TEUs) gain over 95,813 87,891 9.0% 95,813 87,891 9.0%
Totals
January 2020. Most astonishing was
US/Canada Total 1,082,531 1,160,413 -6.7% 1,082,531 1,160,413 -6.7%
the 70.7% (+6,884 TEUs) year-over-year
leap in outbound loads reported by US Total 986,718 1,072,522 -8.0% 986,718 1,072,522 -8.0%
Prince Rupert. Combined with a more
USWC/BC 458,058 489,063 -6.3% 458,058 489,063 -6.3%
modest 1.3% (+1,038 TEUs) increase
Source Individual Ports
March 2021 Page 4West Coast Trade Report
Parsing the January 2021 TEU Numbers Continued
at Vancouver, the two British Columbia ports we track recorded a Exhibit 3 January Year-to-Date
strong 9.0% (+7,922 TEUs) gain from a year earlier. Total TEUs (Loaded and
Empty) Handled at Selected Ports
Weights and Values
We acknowledge that the TEU is the container shipping industry’s
preferred metric. Here, though, we offer two alternative measures – Jan 2021 Jan 2020 %
Change
the declared weight and value of the goods housed in those TEUs.
The percentages in the following exhibits are derived from data Los Angeles 835,516 806,144 3.6%
compiled by the U.S. Commerce Department that are published with
a five-week time-lag. Long Beach 764,006 626,829 21.9%
Exhibit 4: USWC Ports and the Worldwide Container Trade. As NYNJ 721,284 617,024 16.9%
usual, this exhibit features some interesting and possibly counter-
intuitive data on containerized imports (regardless of point of Georgia 459,607 377,671 21.7%
origin) entering mainland U.S ports. Even with an armada of loaded Vancouver 319,972 265,599 20.5%
vessels waiting offshore, the two San Pedro Bay ports saw their
combined percentage of the nation’s containerized import tonnage NWSA 288,289 263,816 9.3%
in January slip to 27.5% from 29.4% a month earlier and from 27.7%
Virginia 270,969 227,234 19.2%
in January of 2020. Those numbers were reflected in the two ports’
combined share of the value of the nation’s containerized import Manzanillo 270,603 264,138 2.4%
trade, with a 33.9% share in January down from 34.9% in December
and from 35.5% a year earlier. Meanwhile, the Port of Oakland’s Houston 255,039 268,773 -5.1%
January share of import tonnage edged lower to 3.6% from 3.8% in
South Carolina 216,265 211,020 2.5%
December and from 4.3% in the first month in 2020. Oakland’s share
of import value also slid to 3.2% from December’s 3.5% share and Oakland 199,098 211,251 -5.8%
from the 3.7% share the port held the year before. Further north,
the two NWSA ports saw their combined share of import tonnage Montreal 140,456 136,589 2.8%
in January decline to 4.6% from 4.7% in their December share and
JaxPort 122,770 109,141 12.5%
from 5.2% in the previous January. In value terms, the NWSA ports’
import share in January equaled the 6.0% share they enjoyed in Miami 113,835 94,064 21.0%
December, which was higher than their 5.8% share of January 2020.
Prince Rupert 101,585 81,487 24.7%
On the export side, the Southern California ports’ market share in
January declined from both the preceding month and from January Lazaro Cardenas 97,640 119,432 -18.2%
2020. Owing to the increased prices of certain commodities the
Port Everglades 88,139 85,992 2.5%
two ports handle, their share of the declared value of containerized
exports in January was up slightly over both December and January Maryland 85,166 90,290 -5.7%
2020. Oakland saw its export share deteriorate across the boards,
while the NWSA ports slipped from December in tonnage but Philadelphia 52,301 54,851 -4.6%
was up on a year-over-year basis. In value terms, the NWSA share
New Orleans 40,291 54,636 -26.3%
remained unchanged at 4.3%.
Boston 22,325 25,874 -13.7%
Exhibit 5: USWC Ports and the East Asia Trade. Plagued by
congestion (and by the plague), the Ports of Los Angeles and Long US/Canada Total 5,096,912 4,608,285 10.6%
Beach in January sustained a substantial drop in their combined
share of the nation’s containerized import tonnage from East Asia US Mainland 4,534,899 4,124,610 9.9%
Only
in January. That month’s 43.3% share was down from 46.5% in
Source Individual Ports
March 2021 Page 5West Coast Trade Report
Parsing the January 2021 TEU Numbers Continued
Exhibit 4 USWC Ports Shares of Worldwide U.S. Exhibit 5 USWC Ports Shares of U.S. Mainland
Mainland, January 2021 Trade With East Asia, January 2021
Jan 2021 Dec 2020 Jan 2020 Jan 2021 Dec 2020 Jan 2020
Shares of U.S. Mainland Ports Containerized Import Tonnage Shares of U.S. Mainland Ports’ East Asian Container Import Tonnage
LA/LB 27.5% 29.4% 27.7% LA/LB 43.3% 46.5% 44.0%
Oakland 3.6% 3.8% 4.3% Oakland 3.9% 4.2% 5.1%
NWSA 4.6% 4.7% 5.2% NWSA 6.8% 6.7% 6.7%
Shares of U.S. Mainland Ports Containerized Import Value Shares of U.S. Mainland Ports’ East Asian Container Import Value
LA/LB 33.9% 34.9% 35.5% LA/LB 49.3% 52.1% 51.4%
Oakland 3.2% 3.5% 3.7% Oakland 3.8% 4.2% 4.4%
NWSA 6.0% 6.0% 5.8% NWSA 8.7% 8.6% 8.2%
Shares of U.S. Mainland Containerized Export Tonnage Shares of U.S. Mainland Ports’ East Asian Container Export Tonnage
LA/LB 19.4% 22.4% 21.2% LA/LB 31.9% 35.7% 34.9%
Oakland 6.1% 6.7% 6.3% Oakland 7.9% 8.2% 9.0%
NWSA 7.3% 7.4% 7.1% NWSA 11.4% 11.0% 11.1%
Shares of U.S. Mainland Conatainerized Export Value Shares of U.S. Mainland Ports’ East Asian Container Export Value
LA/LB 20.7% 20.4% 20.4% LA/LB 37.6% 37.1% 39.0%
Oakland 6.8% 7.7% 7.4% Oakland 11.6% 12.2% 11.8%
NWSA 4.3% 4.3% 4.3% NWSA 8.1% 7.9% 8.5%
Source: U.S. Commerce Department. Source: U.S. Commerce Department.
December and from 44.0% one year earlier. The ports’ January were here and there. The market shares held
decline in market share was paralleled in value terms by the Ports of Los Angeles and Long Beach dropped
with declines from both December and January of in tonnage terms between January and December but
2020. Elsewhere along the coast, Oakland’s 3.9% share rose in value terms over the previous month. Oakland’s
of containerized import tonnage from East Asia was export shares declined from December to January in both
off from 4.2% a month earlier and from a 5.1% share a tonnage and value, while the NWSA ports recorded market
year earlier. Oakland’s 3.8% export value share was also share gains in January from December.
down. Further north, the two NWSA ports’ 6.8% share of
containerized import tonnage from East Asia in January
was higher than either December or January of 2020. The Who’s #1?
NWSA ports’ collective share of the value of containerized The Port of Los Angeles was the nation’s busiest container
imports from East Asia was similarly above December port in January with 835,516 TEUs of total traffic (loaded +
empty). The Port of Long Beach ran second with 764,006
and a year earlier.
TEUs, while the Port of New York/New Jersey (PNYNJ)
USWC shares of containerized exports to East Asia in placed well behind in third place with 721,284 TEUs.
March 2021 Page 6West Coast Trade Report
Parsing the January 2021 TEU Numbers Continued
Leading the second tier of U.S. ports was Savannah with of Tacoma and Seattle, operating as the Northwest
459,607 total TEUs. Seaport Alliance, had a 38.4% share of February’s inbound
trade. The Port of Vancouver and the Port of Prince
For nitpickers who believe empty boxes shouldn’t count,
Rupert in British Columbia had 47.2% and 14.4% shares,
the rankings don’t change. Los Angeles remained the big
dog with 556,936 loaded TEUs crossing its docks in the respectively. Exhibit 6 captures the downs, ups, and
year’s first month. In second place with 480,509 loaded downs in containerized imports through the crossborder
TEUs was the Port of Long Beach, narrowly edging out region’s ports since the beginning of last year.
PNYNJ’s 480,130 total TEUs. Savannah was well behind The binational import trade peaked in October at 375,395
with 346,010 TEUs.
TEUs in British Columbia and a month later at the NWSA
In the category of inbound loads, Los Angeles (437,609 ports. That was 23.8% higher than a year earlier. By this
TEUs) exceeded PNYNJ (371,392 TEUs) which – here’s February, the import surge had subsided to 263,174 TEUs,
some news -- topped Long Beach (364,255 TEUs). up just 0.6% from last February. The shares had changed
Inbound loads at Savannah totaled 232,645 TEUs. a bit, with the NWSA ports up slightly to 35.0%, while
Prince Rupert’s share subsided to 15.4%. Vancouver, with
As for outbound loads in January, the most intriguing
news is that Savannah (113,365 TEUs) bested PNYNJ an increase to 49.5%, appears to have benefited from the
(108,738 TEUs) while falling shy of Los Angeles (119,327 fall-off at Prince Rupert in January.
TEUs) and Long Beach (116,254 TEUs). Throughout the 14 months depicted in Exhibit 6, the four
ports combined to handle 4,283,363 loaded import TEUs.
That was 41.1% of the 10,413,884 laden TEUs imported
Crossborder Competition during the through the Ports of Los Angeles and Long Beach during
Months of Plague the same period.
A year ago February, the four major ports in the binational
Pacific Northwest region handled 263,174 loaded inbound As Exhibit 7 points out, Prince Rupert’s inbound traffic
TEUs, 11.0% below January’s traffic of 295,632 loaded generally mirrors Vancouver’s, although clearly Vancouver
import TEUs. On the U.S. side of the border, the Ports is pulling most of the sled in British Columbia.
Exhibit 6 NWSA vs. BC Ports’ Import Trades: January 2020-February 2021
Source: Northwest Seaport Alliance, Ports of Vancouver and Prince Rupert
300,000
NWSA
250,000
BC Ports
200,000
150,000
100,000
50,000
0
Jan Feb Mar Apr May June July Aug Sept Oct Nov Dec Jan Feb
March 2021 Page 7West Coast Trade Report
Parsing the January 2021 TEU Numbers Continued
Exhibit 7 Intramural BC Import Competition: January 2020-February 2021
Source: Ports of Vancouver and Prince Rupert
200,000
Vancouver
Prince Rupert
150,000
Inbound Loaded TEUs
100,000
50,000
0
Jan Feb Mar Apr May June July Aug Sept Oct Nov Dec Jan Feb
Summing Up the Port of Oakland’s Century… last three years have seen import loads exceed export
So Far loads. And that has most certainly been the case so far
From the start of the 21st century twenty years ago on this year, with inbound loads outnumbering export loads
January 1, 2001 through December 31, 2020, the Port of by 157,603 TEUs to 138,735 TEUs.
Oakland handled 44,988,002 total TEUs (loads + empties).
For most of those years, Oakland was preeminently an The Ongoing Surge in San Pedro Bay
export gateway, with outbound loads accounting for There’s a good chance, figuratively speaking, that less
52.9% of all loaded TEUs the port handled. However, the ink is currently being spilled on the NCAA basketball
Exhibit 8 Two Decades of Container Traffic at the Port of Oakland
Source: Port of Oakland
3,000,000
Import Loads
2,500,000
Export Loads
2,000,000
Total Loads +
Empties
In TEUs
1,500,000
1,000,000
500,000
0
2001 2002 2003 2004 2005 2006 2007 2008 2009 2010 2011 2912 2013 2014 2015 2016 2017 2018 2019 2020
March 2021 Page 8West Coast Trade Report
Parsing the January 2021 TEU Numbers Continued
tournament than on the plight of shippers trying to get What immediately jumps out is how extraordinary the
their goods through the two big Southern California ports. months since last summer have been. Starting last July,
This year, at least, the phrase “March Madness” seems the dark blue columns tower over all others. But what
to better capture the angst of the nation’s importers and is also interesting is not how poorly the period from
exporters than it does the anxieties of college basketball January 2019 through February 2020 (represented in
fans. (If only Holy Cross had made the cut, we all could the orange columns) fared in the historical comparison,
have rooted for Tony Fauci’s alma mater.) it’s how relatively robust was the flow of inbound loaded
containers in the fourteen month period starting in
Not to wander too far off topic, but we thought it might
January 2018 (represented in gray). These were, of
be useful to chart the volume of inbound loaded TEUs
course, the months in which President Trump began
that have been arriving at the Ports of Long Beach and
aggressively deploying tariffs on imported goods.
Los Angeles since the eve of the pandemic in January
2020 and show how traffic during those fourteen months
compares with the same fourteen months for each of the
previous years.
Exhibit 9 Inboard Loads at San Pedro Bay in the Plague Months
Source: Ports of Los Angeles and Long Beach
1,000,000
2020-2021
800,000 2019-2020
2018-2019
600,000
2017-2018
400,000
2016-2017
200,000
Inbound Loaded TEUs
0
Jan Feb Mar Apr May June July Aug Sept Oct Nov Dec Jan Feb
March 2021 Page 9West Coast Trade Report
Jock O’Connell’s Commentary:
Riling the Xenophobes to Tap the Federal Fisc
“The ocean carriers and marine terminals – which are data, let me stipulate that I am not seeking to make light
mostly foreign-owned – are strangling exports by denying of those farmers (or, perhaps more precisely, their freight-
cargo and slowing shipments.” [Emphasis added.] forwarders) whose shipments – for one reason or another
-- have literally missed the boat. What I am interested in
That’s the incendiary claim lodged by the executive
doing is bringing some perspective to a topic currently
director of a national agricultural commodity group,
rife with histrionic hyperbole.
who was responding to a CNBC report alleging that the
shipping lines “rejected at least $1.3 billion in potential So, for starters, one thing we know is that the U.S.
U.S. agricultural exports.” Department of Agriculture, which employs a small army
of bean counters to keep tabs on the welfare of our
Let’s set aside the fact that the CNBC report has been
farmers, tells us that the global sales of U.S. farm and
widely discredited by people who actually understand
food products last year was not only some seven percent
the rules of math and aren’t merely hungry for attention-
higher than in 2019 but was also the second highest on
grabbing headlines. The executive editor of the Journal
record. Amazingly, all that food and fiber somehow made
of Commerce labeled the CNBC claim as “specious,”
it to customers worldwide.
“hinged on a flawed premise,” and “unhelpful” to a serious
discussion of the real issues at hand. Another thing we know is that that most of the nation’s
farm export trade does not leave U.S. seaports in
Given the political climate in this country and the marked
containers. Seaborne exports of soybeans, wheat, and
upswing in racially-charged incidents in recent months,
corn last year amounted to 125.14 million metric tons,
we should all be seeking to discourage such xenophobic
valued at just over $37.17 billion. How much of that
rhetoric. But it’s probably only a matter of time before
trade traveled in containers? 6.71 million metric tons, a
some hyperventilating politician stands before a
whopping 5.4% share. Exhibits A-C illustrate how little
television camera and tells the ocean carriers serving the
of the nation’s export trade in wheat, corn, and even
nation’s seaports to “go home where they came from.”
soybeans relies on the availability of shipping containers.
Already, we have seen a flurry of letters to the Federal So it would appear that a lot of the farmland fretting
Maritime Commission demanding that the commission’s about metal boxes, especially in the states growing those
gumshoes be loosed on those pernicious foreigners amber waves of grain (and soybeans) we patriotically
who’ve been abusing our American exporters, most celebrate, has been for naught.
terribly all those farmers struggling to get their produce to
Some of the loudest laments lately cite the plight of apple
overseas markets.
growers in Washington State, who have been insisting
Regrettably but predictably, none of the petitions they are being thwarted from getting their fruit onto
forwarded to the FMC quite get around to acknowledging outbound ships. U.S. trade statistics do show that apple
that it’s the irrepressible demand of American consumers exports through the Ports of Seattle and Tacoma between
for imported merchandise that is dictating how the the usual start of harvest last September through January
world’s shipping containers are being deployed. Blaming of this year (the latest available export numbers) were
the foreigner, after all, is vastly preferable to chastising down from the same period a year earlier 18.0%.
fellow Americans for wanting to buy stuff no longer made
But before anyone contends that that plunge constitutes
in the USA.
prima facie evidence of ocean carriers discriminating
against apple exporters, consider Exhibit D, which attests
to the remarkable variability of the apple export trade
So do we really know, apart from the scattered crumbs of
through the NWSA ports over the past decade.
anecdotes that trade associations have been scattering
before a largely credulous media? Before digging into the
March 2021 Page 10West Coast Trade Report
Commentary Continued
Exhibit A U.S. Soybean Exports Containerized vs. Bulk
Source: U.S. Commerce Department
60,000,000
Containerized
50,000,000 Non-
Containerized
40,000,000 In Metric Tons
30,000,000
20,000,000
10,000,000
0
2010 2011 2012 2013 2014 2015 2016 2017 2018 2019 2020
Exhibit B U.S. Wheat Exports Containerized vs. Bulk
Source: U.S. Commerce Department
35,000,000
Containerized
30,000,000
Non-
Containerized
25,000,000
In Metric Tons
20,000,000
15,000,000
10,000,000
5,000,000
0
2010 2011 2012 2013 2014 2015 2016 2017 2018 2019 2020
Exhibit C U.S. Corn (Maize) Exports Containerized vs. Bulk
Source: U.S. Commerce Department
60,000,000
Containerized
50,000,000 Non-
Containerized
40,000,000
In Metric Tons
30,000,000
20,000,000
10,000,000
0
2010 2011 2012 2013 2014 2015 2016 2017 2018 2019 2020
March 2021 Page 11West Coast Trade Report
Commentary Continued
As the export manager at one major exporter of agricultural exports by value are almonds, pistachios,
Washington State apples recently told Fresh Plaza, a dairy products, wine, and walnuts. Together they account
magazine covering the fresh produce industry, “overall for just over half of the state’s agricultural export trade.
demand this season has been slower than usual.” Among
Unlike Midwestern wheat, corn, or even soybeans,
other things, prices are said to be higher, which tends to
suppress demand when large numbers of consumers are California’s tree nuts, dairy products, and wine are all
out of work due to pandemic lockdowns. prime candidates for containerization. So if anyone’s
exports are being afflicted by a conspiracy of foreign-
As for the matter of container availability, the executive owned shipping lines, these commodities should be
pointed to a wrinkle in the eastbound transpacific trade prominent on the casualty list. So just how poorly have
that directly affects exporters of perishables. “In the past, they been faring these past months of chaotic conditions
dry goods would often be loaded into reefer containers to at the docks?
reposition them for export when they are here in the US,
but reefer containers have less room than dry containers The California Almond Board reports February exports
do. So, with imports being up, they are looking to ship were up 13,274 tons from a year ago, an increase of
as much product as they can and are using more dry 19.3%. For the almond crop year which began last August,
containers so there just aren’t as many reefer containers exports have been up 20.3%, an increase of 105,520 tons
being used right now.” over the previous crop year.
Let’s now look at how agricultural exports have been The Administrative Committee for Pistachios reports
faring in the nation’s top farming state. That, of course, February exports were up 788 tons from a year ago, an
would be [drum roll, please] California, where total farm increase of 5.8%. For the pistachio crop year that began
receipts are greater than runners-up Iowa and Nebraska last September, exports have been up 32.9%, a gain of
combined. California is also the nation’s leading exporter 17,437 tons from a year earlier.
of agricultural products.
The California Walnut Board reports February exports
According to the Agricultural Issues Center at the were up 6,923 tons from a year ago, an increase of 24.8%.
University of California at Davis, the state’s top five For the Walnut Board’s marketing year which started last
Exhibit D Fresh Apple Exports Through the Ports of Seattle and Tacoma
Source: U.S. Commerce Department
September-January Exports in Metric Tons
250,000
240,000
230,000
220,000
210,000
200,000
190,000
180,000
170,000
160,000
150,000
2011 2012 2013 2014 2015 2016 2017 2018 2019 2020 2021
March 2021 Page 12West Coast Trade Report
Commentary Continued It’s Time For A Change
By John McLaurin, President,
September, exports through February were up 19.2%, an Pacific Merchant Shipping Association
increase of 54,207 tons from a year earlier.
Containerized dairy exports through California’s three
major ports have been up 19.2% by tonnage since the Our supply chain is overwhelmed with cargo. At its core,
start of the import surge last July, according to official there is more cargo than the system can handle. That is
U.S. trade statistics. evident by ships that are full and sitting at anchorage,
Containerized exports of California wines since last terminals which are at capacity, containers and chassis
July have admittedly been down 2.3% from a year that are fully deployed, scarcity of rail equipment, lack of
earlier, but then containerized wine has been an export adequate truck assets and drivers, and full warehouses
trade of declining volume since 2013. and distribution centers.
So where does this leave us? It is also something that is happening all over the world.
The explosion of e-commerce is a global response to the
There is every expectation that the congestion crisis at pandemic.
U.S. ports will significantly ease in the coming months.
Making permanent policy decisions based on transitory The result of this cargo surge: in Southern California,
circumstances is seldom a good idea. Worse still is marine terminals have become storage facilities
leveraging those circumstances to tap the federal fisc rather than transit points; chassis and containers are
for subsidies benefiting a narrow constituency. being taken out of service and used as mobile storage
facilities; ships are inadvertently being used as floating
It’s never a pretty sight to see pressure building warehouses as landside storage facilities are unable to
for public policy decisions to be taken hastily on accommodate additional volumes.
the strength of anecdotes rather than hard data.
The potential for miscalculations with long-lasting Delay in one segment cascades and becomes an
consequences is all too real. Yet that seems to be additional delay in other supply chain segments.
where we may be heading here. The unprecedented demand for consumer goods and
And what, we should ask, is the likelihood that aid industrial products shipped in containers has stressed
directed to agricultural exporters won’t simply push chassis supply, truck power, berth space, terminal
up shipping rates for all outbound containers? And land and warehouse capacity resulting in many in the
where would that eventually leave shippers of low-value supply chain advocating “solutions” which only benefit
merchandise such as scrap paper and metal, which the advocate but penalize everyone else and make the
dearly depend on cheap outbound rates to move their congestion worse.
containers to overseas markets? The proposal to eliminate detention and demurrage
Standing on the dock, gazing dejectedly as someone charges is one such misguided effort. To argue that
else’s politically-preferred goods sail away is my guess. eliminating an incentive to return equipment you
don’t own somehow promotes equipment availability
is counterintuitive. If the complaint is that there are
abuses in imposition of those fees, then the established
Disclaimer: The views expressed in Jock’s
oversight of the Federal Maritime Commission is
commentaries are his own and may not reflect the
appropriate and will hopefully be based on verifiable data
positions of the Pacific Merchant Shipping Association.
as opposed to scattered anecdotes.
It is time to move away from myopic, self-serving
solutions and consider real change in how cargo is
transported through Southern California ports. The
recent surge in cargo, and speculation by some as to
March 2021 Page 13West Coast Trade Report
It’s Time for a Change Continued
whether this will be the “new normal,” requires the trade on terminals; street dwell time is too long and chassis
community to re-evaluate our entire logistics system. are often damaged, creating artificial shortages. Has the
time come to move chassis to an off-dock location and/
One idea for real change is to rethink the current model and
or to require a trucker/BCO to utilize their own chassis as
move away from the “pull model” of cargo owners going to
opposed to waiting at a marine or rail terminal for a chassis
marine terminals and retrieving the cargo as desired. Could
to become available?
you imagine the pull system being applied to FedEx or UPS
packages, relying on customers to make an appointment to Finally, California is rapidly driving logistics to a zero-
pick up their own packages – when it is convenient? emissions future. It will bring on many changes. There
will be winners and losers. For a time, due to proposed
Instead, the port container system should consider the
California Air Resources Board policies, there could be a
“push model” that is more common with final mile delivery
reduced pool of available trucks for use in the harbor area
of goods, where the ultimate consumer is informed of
– bringing additional challenges to other segments of the
when the cargo is to be delivered to a warehouse or other
supply chain. In addition to the public policy challenges
location. If marine terminals are truly to be transit points as
requiring a zero-emissions supply chain, the collective
opposed to a de-facto storage yard, cargo needs to move
industry needs to discuss what the port drayage model will
through the terminal to either its final destination or to
look like in just a few years. Whatever surfaces, it will be
an off-dock facility or location that is easily accessible to
transformative and affect everyone in the supply chain and
cargo owners.
will require everyone to work together.
Will it be transformative? Yes. Will it require stakeholders to
The COVID crisis is providing a preview of the challenges
come together to make it work? Yes. Would it ensure cargo
facing the supply chain. Let’s take advantage of this
moves through the ports efficiently and improve velocity?
opportunity and move together to a better system.
Yes. Is it necessary? Yes.
The current chassis system is also the subject of
perennial complaints. Chassis availability becomes an The views expressed by John McLaurin are his own and
issue whenever cargo volumes surge. There is a feeling may not reflect the positions of the members of the Pacific
among many that the chassis system must change, Merchant Shipping Association.
and in fact it has changed in the last decade, just not to
everyone’s satisfaction. Many complain that there aren’t
enough chassis; the fees are too high; they take up space
Interested in membership in PMSA?
Contact Laura Germany for details at: lgermany@pmsaship.com or 510-987-5000.
PMSA Copyright © 2021
It is prohibited by law to forward this publication to any other person or persons. This material may not be re-published, broadcast,
rewritten or distributed without written permission from PMSA. Follow PMSA on Twitter @PMSAShip and Facebook.
March 2021 Page 14West Coast Trade Report
Import Dwell Time Is Down For February; Rail Dwell Time Is Up
March 2021 Page 15You can also read