WESTAR Regional Haze 2021 SIP Plan Update - JUNE 2017, v.1 DECEMBER 2017, v.2 - DRAFT v.2 for REVIEW
←
→
Page content transcription
If your browser does not render page correctly, please read the page content below
DRAFT v.2 for REVIEW

WESTAR
Regional Haze 2021 SIP Plan Update

JUNE 2017, v.1

DECEMBER 2017, v.2

Contents

Introduction ........................................................................................................................1
Regional Haze Program Requirements ................................................................................2
    Section 51.308(f) Requirements ............................................................................................2
    Section 51.308(d) Requirements .............................................................................................2
Work Products Overview ....................................................................................................3
    Timeline ...................................................................................................................................3
    Input Tasks Required ...............................................................................................................3
    Need for Shared Database ......................................................................................................3
    Flowcharts & Timelines ...........................................................................................................4
    Regional Task Analysis Chart ...................................................................................................7
IMPROVE Monitoring Data Analysis .......................................................................................9
    Progress Report Timeline ......................................................................................................10
Regional Modeling and Analysis Overview ..........................................................................10
Emissions Inventories ..........................................................................................................11
    Emission Inventory Sector Methods .....................................................................................13
    Emission Inventory Projection Methods ...............................................................................13
    Additional Emission Inventory Studies ..................................................................................14
Long Term Strategies for Visibility Improvement .................................................................14
    Long Term Strategy ...............................................................................................................15
    Four-Factor Analysis ..............................................................................................................15
    Potential Effect of Emissions Reductions on Visibility
    .............................................................16
    Reasonable Progress Authority ............................................................................................17
Reasonable Progress Goals and Uniform Rate of Progress ...................................................18
    Uniform Rate of Progress ......................................................................................................18
    Relationship between RPG and the Glide Path .....................................................................21
Meteorological and Emissions Modeling ..............................................................................21
    Additional Studies .................................................................................................................22
Alaska Analysis .....................................................................................................................22
Hawaii Analysis ....................................................................................................................22
Embedded Progress Report .................................................................................................23
Other Issues Affecting Direction of Regional Haze Work .......................................................23
    The Five “Core Issues” ...........................................................................................................23
    Controllability of Emissions (section to be redrafted) ..........................................................25
Reasonably Attributable Visibility Impairment .....................................................................27
Coordination, Consultation, and Public Outreach (section to be drafted) ..............................28
Resources for Regional Work (section to be redrafted) ..........................................................28
Appendix A – Regional Haze Rule (Side-by-Side Comparison, to be prepared) .......................29
Appendix B – Detailed Timeline ...........................................................................................40

12/12/2017                                                                                                                              page i
DRAFT v.2 for REVIEW
DRAFT v.2 for REVIEW

                             WESTAR Regional Haze 2021 SIP Update Plan

Introduction

The WESTAR States have developed this plan to guide their work for the Regional Haze State
Implementation Plans (RH SIPs) due on July 31, 2021. This update identifies the regional and
technical work elements that will be needed for these RH SIPs, how these elements fit together,
and estimates the time needed to complete each task.

In 2013, WESTAR States identified and recommended to U.S. EPA potential changes to the
Regional Haze Rule (RHR) and supporting guidance. 1 After discussions with other Regional
Planning Organizations (RPOs), the Federal Land Managers (FLMs), and interested tribal
representatives, U.S. EPA proposed rule revisions and new guidance for public comment in
2016. On January 10, 2017, U.S. EPA published final RHR revisions in the Federal Register.
U.S. EPA plans to publish final guidance for the RH SIP preparation based on the rule revisions,
but not likely in 2017.

WESTAR states have prepared this 2021 Update to guide the member states in the preparation
of a Regional Haze SIP for the second planning period, now due in July 2021. It helps identify
the tasks where input is needed from all the states for regional modeling and it structures a
timeline so that shared and independent tasks can be completed in a timely fashion.

The rule promulgated in January of 2017 is subject to requests for rule review and requests for
rule reconsideration to which U.S. EPA is responding. Since the rule has not been stayed,
WESTAR states are proceeding as though the RH SIP submission date is July 2021. In the
absence of guidance, this WESTAR Regional Haze 2021 SIP Update Plan serves as a working
guide for western states. Should U.S. EPA make substantive changes to the rule or guidance,
this SIP Update Plan may need to be modified. In the absence of certain rule and guidance
changes, this SIP Update Plan identifies areas where the states will need to make reasoned
assumptions or interpretations. Also, to date, no resources have been identified by U.S. EPA to
assist states in conducting the work needed for 2021 RH SIPs. Hence, this Update assumes in‐
kind and extramural funding sources will be leveraged to accomplish the work identified herein.

Since the RHR requires a comprehensive plan review every 10 years, much of the work for the
2021 plan will be similar to the work required for the initial RH SIPs. States have the benefit of
having been through the process once before, thereby having a better understanding of the
requirements and work needed. An interim Progress Report is embedded in the RH SIP revision
due in 2021 and will address whether or not states met their 2018 RPGs and why.

Throughout this SIP update plan, the sections of the regional haze rule most relevant to each
task are cited. The RHR drives the work that needs to be done either explicitly, by requiring
specific analyses (such as determining current visibility conditions), or implicitly, by requiring

1
    WESTAR Regional Haze Workgroup “Five Core Issues”

12/12/2017                                                                                    page 1
DRAFT v.2 for REVIEW
states to make planning decisions (such as identifying control measures to improve visibility).
In order to make sound planning decisions, the states must complete a regional analysis, which
requires the use of certain methods, inputs, timelines, and resources.
Regional Haze Program Requirements
The requirements for the Regional Haze Program are codified at 40 CFR 51.308. Appendix A of
this SIP Update Plan shows the text of the RHR as revised and briefly identifies the associated
work the states need to undertake for the requirements.
Basic Regional Haze SIP Requirements
Section 51.308 (d) includes the basic elements of all RH SIPs:
● Determining current visibility conditions and comparing to natural conditions;
● Developing long‐term strategies to reduce emissions that contribute to visibility
impairment; after conducting a four‐factor analysis of anthropogenic sources with
potential impacts;
● Establishing 2028 RPGs for the end of the implementation period; and
● Submitting a monitoring strategy.
Regional Haze SIP Revision Requirements
Section 51.308(f) requires that states revise and submit regional haze plans for the second
planning and implementation period to U.S. EPA by July 31, 2021. In addition to re‐evaluating
all elements required in section 51.308 (d) of the RHR, the states must:
● Assess baseline, natural, and current visibility conditions for the most impaired and least
impaired days;
● Address actual progress made towards natural conditions or the most impaired and for
the clearest days during the previous implementation period ending 2018;
● Determine the effectiveness of the long‐term strategy for achieving Reasonable
Progress Goals (RPGs) over the prior implementation period ending 2018 (which were
calculated for Worst Days); and
● Affirm or revise the uniform rate of progress according to procedures in paragraph (d).
While meeting the requirements of sections 51.308(d) and (f), the states must consult with
other states having Class I Areas that may be impacted by anthropogenic emissions from their
state and consult with the Federal Land Managers on the effectiveness of the long-term
strategy and setting the RPGs for the Class I Areas in the respective states. The required
elements and schedule of this coordination are found at section 51.308 (i). States must also
include a Progress Report containing the elements described at section 51.308 (g) and
determine the adequacy of their existing implementation plan, explained at section 51.308(h).
12/12/2017 page 2DRAFT v.2 for REVIEW Work Products Overview Exhibit 1 outlines the tasks to develop the regional haze SIPs and shows how they fit together. Exhibits 2a and 2b are summary timelines. Exhibit 3 briefly describes regional work products. Timeline This plan update identifies an initial description and timeline for the substantial work that is needed over the next three-four years to complete the 2021 SIP. The timing to complete the plans by July 2021 depends on a reliable sequence of technical and planning work at the regional level and by individual states. In addition to these efforts, the states must provide time for consultation with the Federal Land Managers (FLMs) and for a public comment period, as well as the state adoption process. This all points to the need for states to start the 2021 SIP development process in early 2017. Exhibits 2a and 2b are summary timelines for developing these SIPs, showing overlapping tasks. A more detailed timeline is available in Appendix B. The SIP adoption process varies from state to state. Colorado, with the requirement for their RH SIP to be approved by the state’s legislature, has the lengthiest process among the WESTAR States. In order to meet the July 2021 submission deadline, the Colorado SIP needs to have completed the FLM review and public review by the summer of 2017, prior to the State Legislature adoption beginning the Fall of 2021. That means all technical work for the final control scenarios must be complete before the final regional modeling to determine the final RPGs in the Spring of 2020. Input Tasks required for RH SIPs The activities listed in Exhibit 3 show how various elements required for the regional haze planning process and RH SIP development might be achieved. As needed, states will work together to develop protocols for interpreting the rule requirements. These might include methods for determining Most Impaired Days, protocols for revising Natural Conditions, consensus for projecting wildfire smoke and dust events for modeling future years, opportunities to involve Federal Land Managers early in the planning process, contracting for special studies, source category control options, and other needs that may arise during SIP development. Need for Shared Database For the initial regional haze SIP, states worked together to develop a standardized database storage system called the WRAP-TSS (Western Regional Air Partnership Technical Support System) for storing emission data, monitoring data, and modeling results in a common format, made publically accessible. For this second RH SIP, states anticipate using a similar system. It is essential to have the complete historic monitoring data data record for planning purposes and for RH SIP preparation. http://vista.cira.colostate.edu/tss/Results/HazePlanning.aspx 12/12/2017 page 3
DRAFT v.2 for REVIEW

Exhibit 1 – Regional Haze SIP Development Flowchart
     Review Rule                Prepare                       Draft RH SIP (includes              Public Review           Submit to US
     and Guidance               stepwise                      Federal Land Manager and            (2020-2021)             EPA
     (2017)                     Regional Work                 Other State Consultation                                    (2021)
                                Plan (2017)                   (2018-2020)

                                                                  Determine Reasonable Progress Goals (Deciviews)

                                     Post-Process to Select                                                                  Compare
                                      Most-Impaired Days                                                                     with URP
                                      (Deciview Average)
      Post-Process to Select
       Most-Impaired Days
       (Deciview Average)             Model 2028 Emissions
                                    Inventory with Additional
                                        Controls and RRF
       Model OTB + OTW
    controls to determine RRF             Forecast 2028                                                                      Draw new Glide
                                       Emissions Inventory                                      Develop New Natural             Slope and
                                       with any Additional                                       Conditions for 2064           Determine
      Forecast 2028 Inventory               Controls                                            Most Impaired Days          Idealized Uniform
      using on-the-books plus                                                                       (Deciviews)              Rate of Progress
       on-the-way controls                                                                                                  (baseline to 2064)
           (OTB + OTW)                    Prepare Four-
                                         Factor Analysis                                        Add International
                                                                        Input from
                                                                       Federal Land          Emissions and Prescribed       Determine
        Prepare Gridded                                                  Managers              Fire Components to           International
                                      Determine source
       Inventory for Base                                                                      Most Impaired Days
                                    categories in top 80%                                                                   Emissions
       Year Performance             of non-mobile source
           Modeling                       inventory
                                                                                                                     Establish New 2000-2004
                                                                        Remove Wildfire, Dust Storm, Vog           Monitoring Baseline for Most
              Develop 2014 Emissions Inventory                        Components from Most Impaired Days            Impaired Days (Deciviews)

12/12/2017                                                                                         page 4
DRAFT v.2 for REVIEW Exhibit 2a – SIP Preparation Task Timeline by Quarter (for States adopting plans in 2021) 12/12/2017 page 5
DRAFT v.2 for REVIEW
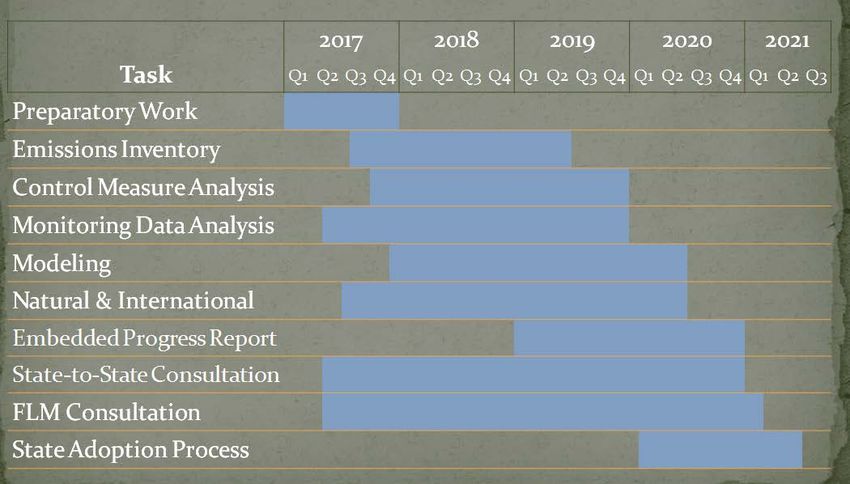
Exhibit 2b – Regional Haze SIP Process Timeline through to Submittal Deadline
2017 2018 2019 2020 2021
Funding &
EPA Guidance
Commitments Regional Work 7/31/2021
Complete 3/2020 Submit SIP
to U.S. EPA
Develop
Preparatory
Work Plan
January –May
2017
Identify Studies
September 2017 - March 2018
Inventory & Studies & Baseline Modeling
June 2017 – December 2019
Modeling & Control Analysis
April 2018 - March 2019
Project Updates & Finalize Controls & Final
Regional RPG Modeling
March 2019 - March 2020
FLM Final Review & State Adoption
Process prior to Submittal to U.S.EPA
Spring 2020 – July 2021
12/12/2017 page 6DRAFT v.2 for REVIEW
Exhibit 3 – Regional Task Analysis
Regional Activity Timeframe Comments
Need new formats for Impaired days
Original Rule format available through 2014 Need technology upgrade to support WRAP-TSS
IMPROVE Monitoring Data on WRAP-TSS with historic and future data
Analysis *
2016 available on FED unformatted Will need monitoring data through 2017 (or 2018?)
to complete Progress Report for first planning
period
Is the 2014 NEI finalized?
2014 Base Year start Summer 2017 2017 inventory useful for supporting Progress
Emission inventory * Report, (same as used for NEI submissions in 2018)
Wildfire Emissions & Gridding for 2014
Collective western states’ involvement critical to
timely development of 2028 control scenarios
Work underway now, complete by Spring, Can we use 2011 data for 2028; will we need 2014
Meteorological modeling **
2014 meteorology to check performance?
Determine Most Impaired Days
Use Baseline Source Apportionment as
Reconstruct Baseline * or ** Create New Baseline (Fall 2017- Spring International Emissions Contribution in Future?
2018)
Lags emission inventory work by 3‐4 months
2028 OTB-OTW projection, start by Base Year is 2014
Emissions Forecasting * December 2017
or** EPRI - International emissions for what years?
Spring 2018 through Spring 2020 (Baseline? 2014? 2018? 2028?
2028 OTW + OTB ready in Spring 2018
12/12/2017 page 7DRAFT v.2 for REVIEW
4-factor Control Scenarios for finished by Spring
2019
Exhibit 3 – Regional Task Analysis (continued)
Regional Activity Timeframe Comments
Use existing WestJump AQMS 2008 base year
2014 base case for model performance source apportionment results to assist initial work
AQ modeling base case & on RH planning?
Will source apportionment be done?
source apportionment **
New 2011 base year source apportionment – work
will start Spring 2014 (was this ever done?)
Start as soon as 2014 Emissions inventory
Regional Modeling analyzed (begin January 2018) Could develop Control Measure Clearinghouse of
for.(OTW+OTB) * or** Best Practices for subsequent 4-factor analysis?
Need 2028 Projections by mid 2018
Use Baseline Source Apportionment for Future
Develop Methodology in 2017 or 2018 International Emissions Contribution?
Reconstruct 2064 Natural
Conditions * or ** Propose new Natural Conditions in 2019 to Federal Land mangers Develop Prescribed Burning
Construct new Glide Slope and URP Contribution for 2064 (Hold present levels
constant?)
Results from 2028 “What If” control scenarios
2028 Scenarios modeling & 2028 scenarios: Start modeling January needed no later than Summer, 2019
Source Apportionment ** 2019, finish Spring 2020
Will we be able to do any Source Apportionment?
Compare with New Glide Path and URP and confirm
Confirmation of RFPs * Spring 2020
all reasonable efforts have been made
Final consultations with Colorado will need to accelerate their development
Can begin in Summer of 2020
other states and Federal of New Glide Slope to finish before Spring of 2020
12/12/2017 page 8DRAFT v.2 for REVIEW Land Managers and Public Review * * State In-Kind work ** Need Outside Contractor 12/12/2017 page 9
DRAFT v.2 for REVIEW

IMPROVE Monitoring Data Analysis

Analyzing monitoring data is required to meet several sections of the regional haze rule. For all
future implementation, plan revisions define:

   ●   Baseline, natural, and current visibility conditions for the most impaired and clearest
       days, and actual progress made towards natural conditions since the baseline period
       and during the previous implementation period. (section 51.308(f)(1))

   ●   The number of deciviews by which current conditions, exceed natural visibility
       conditions for the Most Impaired and Clearest days. (section 51.308(f)(1)(v))

   ●   The uniform rate of progress from baseline visibility conditions (2000-2004) to natural
       visibility conditions by the end of 2064 (section 51.308(f)(1)(vi)

   ●   The effectiveness of the long‐term strategy for achieving reasonable progress goals over
       the prior implementation period(s). (51.308(f)(2))

The monitoring data analysis required for the SIP revisions is similar to the analysis supporting
the five‐year progress reports. As such, states will use a similar approach for this requirement.

As part of this effort, states will continue to rely upon the WRAP TSS to store and display the
data and trends. http://vista.cira.colostate.edu/tss/Results/HazePlanning.aspx The raw data is
accessible from the FED site http://views.cira.colostate.edu/fed/DataWizard/Default.aspx , but
it must be formatted before trend comparisons can be made with the historic record on the
WRAP-TSS site. One exercise for the western states will be to decide how the monitoring data
should be presented on a commonly available website, once it has been formatted to be used
in planning and trend analysis.

The 1999 RHR specifies that, “The period for calculating current visibility conditions is the most
recent five‐year period preceding the required date of the implementation plan submittal for
which data are available.” In the April 2013 “General Principles for the 5‐Year Regional Haze
Progress Reports for the Initial Regional Haze State Implementation Plans,” U.S. EPA states that
states should “consider a chart of the rolling average.” In the January 2017 RHR revision,
section 51.308(g)(3) provides that “the period for calculating current visibility conditions is the
most recent 5-year period preceding the required date of the progress report for which data
are available as of a date 6 months preceding the required date of the progress report.” That
translates to what is available as of January 31, 2021.

Because it takes 15‐18 months before IMPROVE data is available, 2018 will be the last full year
of monitoring data evaluated for the SIPs, and the most recent five‐year period will be 2014
through 2018. Data for 2018 should be available by mid‐2020 at the latest. Among other
things, the states will use the rolling five-year average for the Worst Days from 2014-2018 to
compare with the Worst Days RPG modeled for 2018 from the initial RH SIP. This Progress

12/12/2017                                                                                  page 10
DRAFT v.2 for REVIEW
Report will use Worst Days rather than remodel RPGs for the first planning period using Most
Impaired Days. This Progress Report requirement can be embedded in the RH SIP due in 2021.
Exhibit 4 is an excerpt from the full project timeline in Appendix B and highlights the timeline
for completing the analysis of current visibility and recent trends, including the review periods
prior to submission to the U.S. EPA.
Exhibit 4 – Timeline to Evaluate Current Visibility and Trends for Progress Report
Task Time Start Finish
Last year of monitoring data collected, QA/QCed, January Spring
15 months
and posted 2018 2020
Data formatted, and trends analyzed
(build structure and add data to format as it
becomes available)
Summer Summer
(start by reconstructing the baseline period ongoing
2016 2020
2000-2004)
(includes reconstructing Natural Conditions
assigned to 2064)
Data available to other states (centrally posted Summer Summer
ongoing
or compiled in contracted report) 2017 2020
Determine if 2018 visibility goal met (explain any Spring Summer
3 months
interfering, uncontrollable circumstances) 2020 2020
FLM Coordination and Comment Process (formal As early as As late as
draft review and comment , prior to public 120 days Summer winter
review) 2019 2020-2021
Public Review Process (RH SIP for public review usually 90 After FLM Ideally in
includes response to FLM comments) days review June 2021
Regional Modeling Overview: Purposes, Inputs, and Analysis
Regional modeling assists the states in addressing a number of requirements in the Regional
Haze Rule. The regional modeling process includes several substantial input tasks: emission
inventory development, emissions forecasting, meteorological modeling, and baseline
modeling, all done prior to the regional modeling of control scenarios occurs to determine
reasonable progress goals. Regional modeling affirms that all the states’ long-term strategies,
developed from a four-factor analysis of potential controls, is sufficient to improve visibility on
the Most Impaired Days, as a result of reducing anthropogenic emissions.
12/12/2017 page 11DRAFT v.2 for REVIEW As discussed below, the preparatory work that goes into regional modeling is extensive. For planning purposes, spatially-allocated emissions inputs are associated with year-specific meteorology and modelled to show their impact at Class I Areas. Forecasted emissions inventories are used to model future scenarios. For states to evaluate the effects of potential strategies in 2028, multiple future scenarios will need to be developed and modeled, prior to setting the RPGs for 2028. Modeling occurs at different stages in SIP preparation, as the inputs are developed sequentially and in an iterative fashion. Baseline modelling is completed once the base year inventory and meteorology is confirmed. Then future year and control scenario modeling becomes an iterative exercise with the results informing the determination of the reasonable progress goal. In other words, a balance must be struck between the control scenario selected and the visibility improvement achieved. One of the final requirements of the RHR is to compare the RPG with the Glide Slope defining the Uniform Rate of Progress. The rule does not require the RPG to be on the Glide Path or to achieve a specific Uniform Rate of Progress, but it does require states to demonstrate that every reasonable control has been included, after a four-factor analysis, irrespective of where an RPG is in relation to the respective Glide Path and Natural Conditions. The Glide Path is merely a guide that should reflect continuous improvement in visibility towards achieving Natural Conditions on the Most Impaired Days in 2064. The 2017 RHR revision recognizes that the Glide Path may need adjustments due to the impacts of natural and international emissions that may not have been accounted for sufficiently in the default values for Natural Conditions utilized in the first planning period. Some of the results from regional modeling and from emissions inventory calculations can be employed to reconstruct more realistic Glide Paths (and their slopes or Uniform Rate of Progress), using refinements in the baseline and more informed assumptions for the Natural Conditions endpoint. For this SIP revision, additional steps must be taken to adjust the Glide Path for future planning. Issues and tasks associated with Emissions Inventory, Modeling, the Long-Term Strategy and Four-Factor analyses, and the Natural Conditions progress metric are discussed in detail below. Note that some of the tasks can be conducted separately and some rely on the results of others. Some of the processes are iterative. All culminate in setting the Reasonable Progress Goals for 2028 and demonstrating that visibility is improving due to reductions in anthropogenic emissions. Emissions Inventories Emission inventories serve both as inputs to regional modeling and as assessment tools. RH SIP Requirements relying on emission inventories include: 12/12/2017 page 12
DRAFT v.2 for REVIEW

   •   The State must identify all anthropogenic sources of visibility impairment considered by
       the State in developing its long‐term strategy. The State should consider evaluating
       major and minor stationary sources, or groups of sources, mobile sources, and area
       sources. (section 51.308(f)(2)(i))

   •   A statewide inventory of emissions of pollutants that are reasonably anticipated to
       cause or contribute to visibility impairment in any mandatory Class I Area. The
       inventory must include emissions for the most recent year for which data are available,
       and estimates of future projected emissions. The State must also include a commitment
       to update the inventory periodically. (section 51.308(f)(6)(v))

   •   As part of the embedded Progress Report, a summary of the emissions reductions
       achieved throughout the State through implementation of the measures included in the
       first implementation plan for achieving reasonable progress goals for Class I Areas both
       within and outside the State. (section 51.308(g)(2))

Analysis for the initial RH Sips was based on the 2002 emission inventory and projections. For
the initial Progress Report, many WESTAR States used the 2008 inventory, leveraging work
done for the WestJumpAQMS study. The 2021 SIPs will likely be based on the 2014 National
Emissions Inventory (NEI), projected to 2028. In preparation for control strategy analyses, the
2014 NEI data will be evaluated to identify non-anthropogenic and anthropogenic emission
sources. Anthropogenic sources will be further evaluated to identify sources that fall under
state control. Emission sources under state control may be subject to four-factor analysis.

Inventory projections to 2028 will provide the basis for developing states’ long-term strategies.
The Control Scenario(s) will reflect the emission reductions resulting from the Long Term
Strategy of states and provide the basis for establishing Reasonable Progress Goals. To
accomplish this work, at least four inventories may be needed:

   •   2014 Base Year Inventory – NEI inventory with regional adjustments, as needed, to
       affirm model performance; (there is a possibility that a 2016 inventory will be used as
       the base year to take advantage of a 2016 modeling platform to be developed nationally
       for modeling attainment of the 2015 ozone standard)

   •   2018 Projected Inventory – 2014 inventory projected to 2018 and adjusted to reflect
       emission changes that are planned but not implemented until after 2014 (e.g., BART
       controls that will be installed between 2014 and 2018) so that States will be able to
       complete the Progress Report, embedded in the SIP that demonstrates how well the
       state met their 2018 Reasonable Progress Goals;

   •   2028 Projected Inventory – the 2014 inventory projected and adjusted to account for
       emission changes on-the-books, (e.g. permit conditions and shutdowns) and phased

12/12/2017                                                                                page 13
DRAFT v.2 for REVIEW
reductions on-the-way from known control measures applied to growth categories (e.g.
mobile fleet changes, and performance standards applied to growth categories); and
• 2028 Control Scenario(s) – Modifications to the 2028 inventory developed based on
forecasts to test the regional effects of potential state control strategies, and to
establish Reasonable Progress Goals for 2028.
As of June 2017, the WESTAR States anticipated having the two essential 2014 and 2028 on-
the-books and on-the-way (OTB and OTW) emission inventories completed by the end of 2017.
The 2028 Control Scenarios should be completed by the end of 2018, to allow sufficient time to
do the subsequent modeling to identify Reasonable Progress Goals. The 2018 inventory is not
used for modeling; it is necessary only as a requirement of the embedded Progress Report, to
affirm that promised reductions occurred, and as backup or weight of evidence for the
improvements seen at the monitors when evaluating the visibility improvements against the
2018 RPGs. It is possible that individual states may choose to rely on what they prepare for the
2017 NEI submission, since WESTAR –WRAP may not be funded to prepare the detailed
inventory and regional analysis many states used for their initial Progress Report.
Emission Inventory Sector Methods
For this interstate planning effort, consistent and comparable emission inventories are
important. Interstate coordination on emission inventory preparation and adjustments will
improve the accuracy of these emission sectors. Consistency among state inventories will also
ensure fair and reasonable apportionment for Class I Areas affected by emissions from outside
the state.
Some sectors will require additional refinements or considerations. For example, because
wildland fire emissions vary greatly from year to year, and are not predictable, states will need
to agree on an estimation method. Input from the Federal Land Managers (FLMs) is critical at
this point because States and the FLMs have worked to improve recordkeeping on acres burned
and emissions generated, from wildfires and from prescribed burns. Other refinements may be
specific to individual states or a few states, such as emissions from the oil and gas industry in
some states. Methods specific to individual sectors must be developed early on so that they
can be consistently applied throughout the process.
Emission Inventory Projection Methods
Some emission categories have well‐accepted projection methods; mobile sources and electric
generation fall into this group. Some source categories are more challenging to project,
including wildland fire, and oil and gas development. The WESTAR States will work together to
develop mutually acceptable projection methods for each emissions inventory category. The
earlier the states can agree on projection methods for these sources, the simpler and quicker
emissions can be developed for modeling.
12/12/2017 page 14DRAFT v.2 for REVIEW For some source categories, an option is to use the same emissions for multiple years. This approach was used in the past for fire emissions, both wildfires and prescribed fires. For other categories, such as oil and gas, states may need to develop their own projections based on expected activity in the individual state. As emission inventory tools and methods improve over time, the states must reconcile differences in methods when comparing emissions from year to year to determine progress. For example, at the time of the first SIPs, MOBILE6.2 provided on‐road emission estimates, but now MOVES has replaced the older tool. While some reconciliation might be needed for the 2018 forecast, the 2014 NEI and the 2028 forecasts both use MOVES. California uses its own projection methods for mobile sources but can supply a compatible mobile inventory to the regional modeling effort. In WESTAR states, the methods for calculating emissions from wildfire and prescribed burning should be agreed upon with the Federal Land Managers. Additional Emission Inventory Studies To prepare the first Regional Haze SIP, the WRAP led the development of a number of special studies, such as developing data sets or tools for gathering data (e.g., FETS) for the first time. Additional emissions studies may not occur for the second planning period, depending on the availability of funding and priorities. Some of the studies were emission inventories for specific sectors, which may need additional scrutiny to adequately support the 2021 SIP development. Topics potentially warranting additional study or inventory development or refinement for the 2021 SIP include: • Oil and gas sector • Canada, Mexico (anthropogenic and natural from neighboring countries) • Natural marine emissions • Offshore shipping emissions ( after implementation of international agreements) • Global (e.g. Asian and European sources affecting Arctic circle, Hawaii, and lower 48 states) • Dust Storms (e.g. episodic events) • Wildfires (e.g. average to use for 2028 projection) • Ammonia (agricultural, industrial, mobile) • Prescribed fire future estimates for 2064 • Lightning NOx. Long Term Strategies for Visibility Improvement The long-term strategy addresses visibility impairment for each mandatory Class I Area within the State and for each mandatory Class I Area located outside the State that may be affected by emissions from the State. The long-term strategy and the interim RPGs must provide for an improvement in visibility for the Most Impaired Days since the baseline period, and ensure no degradation in visibility for the Clearest Days since the baseline period. States must establish 12/12/2017 page 15
DRAFT v.2 for REVIEW

RPGs in each RH SIP that indicate the visibility conditions projected to be achieved by the end of
the implementation period as a result of the State’s long-term strategy.

   Long Term Strategy

The long-term strategy must include enforceable emissions limitations, compliance schedules,
and other measures as necessary to achieve the RPGs established by States having Class I Areas.
The State must identify all anthropogenic sources of visibility impairment considered by the
State in developing its long‐term strategy. The State should consider major and minor
stationary sources, area sources, and mobile sources.

Preliminary guidance suggests that states focus on stationary and area sources, in particular
those categories which comprise the top 80% of their inventory. Western states will also
analyze their mobile source inventories for planned and anticipated reductions. For some haze
precursor species, mobile source emissions inventories are larger in comparison with stationary
and area source inventories. Reductions in emissions from federal controls will also benefit
visibility. Some states have the ability to regulate mobile sources, fleets, or indirect sources
(e.g. parking lots) with mandatory and voluntary programs. As discussed later, states should be
able to indicate which sources are within their statutory control and which are not, in the
process of evaluating long-term strategies.

   Four-Factor Analysis

In establishing its long-term strategy, each state must evaluate and determine the emission
reduction measures available, given their respective statutory authorities, to make reasonable
progress by considering:

 (1)   the costs of compliance,
 (2)   the time necessary for compliance,
 (3)   the energy and non‐air quality environmental impacts of compliance, and
 (4)   the remaining useful life of any potentially affected anthropogenic source of visibility
       impairment.

These four considerations are commonly referred to as the “four‐factor analysis” and include a
demonstration showing how these factors were taken into consideration in selecting the
reasonable progress goal. (section 51.308(f)(2)(i).

The four‐factor analysis is complex and time consuming. For the initial SIP, most western states
focused their four‐factor analysis on sources requiring best available retrofit technology (BART).
For the 2021 SIP, the RHR does not provide direction for identifying which sources or source
categories on which to focus the four‐factor analysis. This void means that states must first
identify which sources or source categories warrant four‐factor analysis and then complete the
analysis. This process is sometimes referred to as the reasonable progress analysis.

12/12/2017                                                                                   page 16
DRAFT v.2 for REVIEW
The western states plan to identify sources or source categories for potential four‐factor
analysis using simple screening methods as a surrogate for visibility impairment, such as
relative contributions to total haze precursor emissions, or Q/d (emissions quantity divided by
distance to the nearest affected Class I Area) comparisons. By setting thresholds for these
screening analyses, the sources or source categories most likely to affect visibility at Class I
Areas on the Most Impaired Days can be identified, and those not likely to affect visibility on
those days will not receive additional time‐consuming analysis.
The western states will also remove sources already controlled under either BART during the
first planning period or other best available control requirements from the pool of those
possibly receiving additional scrutiny, unless it is clear that available technology or other four-
factor conditions have changed during the ensuing years. Although sources may be affecting
visibility, if little more can be done or technology is not available to further control the
emissions within the 2028 implementation period, further analysis at this time is not an
efficient use of resources. WESTAR states sometimes refer to these anthropogenic sources as
technologically “uncontrollable” for the current planning period.
The State must consider the following additional factors in developing its long-term strategy:
(A) Emission reductions due to ongoing air pollution control programs, including measures to
address reasonably attributable visibility impairment;
(B) Measures to mitigate the impacts of construction activities;
(C) Source retirement and replacement schedules;
(D) Basic smoke management practices for prescribed fire used for agricultural and wildland
vegetation management purposes and smoke management programs; and
(E) The anticipated net effect on visibility due to projected changes in point, area, and mobile
source emissions over the period addressed by the long-term strategy. (section
51.308(f)(2)(iv).)
As of this writing, U.S. EPA provided draft guidance for public review for which the comment
period has closed. In the absence of a prescribed method for analyzing sources and their
potential impact on visibility, the WESTAR states can examine their current inventory, growth
scenarios, and future on-the-way and on-the-books control measures for potential emissions
reductions. In the absence of a federal mandate for additional control stringency, some states
are limited by their legislatures to federal control levels. WESTAR states sometimes refer to the
anthropogenic sources, in-state and out-of-state, for which they have no legal authority to
control, as jurisdictional “uncontrollables” for the current planning period. States with waivers
from U.S. EPA for additional control of mobile sources, may evaluate additional mobile source
control options.
12/12/2017 page 17DRAFT v.2 for REVIEW Potential Effect of Emissions Reductions on Visibility Essential to any evaluation of controls is the ability to demonstrate how the identified sources or source categories are affecting Class I Area visibility. This aids in quantifying or measuring reductions in anthropogenic haze, if new controls were applied. This exercise requires modeling. There are major technical and resource issues that states will face in conducting such evaluations, and limited assistance is expected from regional planning organizations in the future. States need a strong technical basis to demonstrate change in visibility impairment for selecting control measures, if any, which are necessary for a source or source category, to make a determination or defense of reasonable progress toward natural visibility conditions. One question often raised with the four‐factor analysis regards the potential effect of the proposed emission reductions on overall visibility: Will implementing the proposed controls improve visibility at the Class I Areas the source affects? Or, alternately considered, how much emission reduction is needed to make a visibility improvement? The states expect to be challenged when requiring emission controls that have little noticeable effect on visibility; they must focus on controls that have demonstrable effects by improving visibility on the Most Impaired Days. Reasonable Progress Authority All states will need to ensure that that they have sufficient authority to implement strategies selected for inclusion in their Regional Haze SIP. During the development of the initial Regional Haze SIPs, a number of states had to adopt additional rules that would allow them to implement the strategies required under BART. For this second planning period SIP, if strategies are selected because they help the state improve visibility to meet reasonable progress, the state may need to adopt rules allowing them to use reasonable progress as criteria for implementing controls. Stated another way, some states will only be able to use existing authorities delegated or mandated by federal programs to reduce criteria pollutants, toxic emissions, or to meet greenhouse gas reduction commitments. Developing a model rule for reductions of precursors to anthropogenic haze at Class I Areas may help states that need additional statutory authority, provided that a reasonable progress benefit is achieved. Reasonable progress goals will be established for each mandatory Federal Class I Area in the WRAP based on regional photochemical grid modeling of the 2028 Control Strategy emission inventory. The 2028 control strategy inventory incorporates emissions reductions resulting from the control measures identified in all the WESTAR states’ long-term strategies. The WRAP will work with the WESTAR states to develop a framework for identification and evaluation of Long Term Strategies. In the absence of specific guidance from U.S. EPA, this framework will guide identification of sources and source sectors for further consideration under the four statutory factors. 12/12/2017 page 18
DRAFT v.2 for REVIEW

Reasonable Progress Goal (RPG) and the Uniform Rate of Progress (URP)

States with Class I Areas must establish RPGs (expressed in deciviews) that reflect the visibility
conditions that are projected to be achieved by the end of the implementation period as a
result of enforceable emission limitations, compliance schedules, and other measures
necessary for their long-term strategy. The RPGs must provide for an improvement in visibility
for the Most Impaired Days over the period of the implementation plan and ensure no
degradation in visibility for the Clearest Days over the same period. Regional modeling
provides the information needed to set these goals.

In developing each RPG, a State must consult with those States which may reasonably be
anticipated to cause or contribute to visibility impairment in the mandatory Class I Area. States
must assure that they have included all measures needed to achieve their apportionment of
emission reductions for visibility impairment in other states, when setting their RPGs. Regional
modeling helps with the accounting, and is the basis for determining potential impacts. In any
situation in which the State cannot agree with another such State or group of States that a goal
provides for reasonable progress, the State must describe in its submittal the actions taken to
resolve the disagreement. In reviewing the State's implementation plan submittal, the
Administrator will consider this information in determining whether the State's goal for visibility
improvement provides for reasonable progress towards natural visibility conditions.

   Uniform Rate of Progress

States must analyze and determine the rate of progress needed to attain natural visibility
conditions by the year 2064. To calculate this Uniform Rate of Progress (URP), the State must
compare baseline visibility conditions (2000-2004 average) on the Most Impaired Days to
natural visibility conditions in the Class I Area (assigned to 2064) and determine the uniform
rate of visibility improvement (expressed as deciviews per year) that needs to be maintained
during each implementation period, in order to attain “natural visibility conditions” by 2064. In
the initial guidance for the 1999 RHR, the URP was also known as the slope of the Glide Path
from Baseline to Natural Conditions for the Worst Haze Days. The revised RHR uses the Most
Impaired Days in the baseline to focus on reducing anthropogenic impairment, which may also
be present in 2064.

In the initial RH SIP, if a State established an RPG for the Worst (Haze) Days that provided a
slower rate of improvement in visibility than the URP, the State demonstrated, based on the
four-factor analysis, that there were no additional emission reduction measures for
anthropogenic sources or groups of sources in the State that would be reasonable to include in
the implementation period. As part of its implementation plan, the State provided to the public
for review an assessment of the number of years it would take to attain natural conditions if
visibility improvement continued at the rate of progress selected by the State as reasonable for
the implementation period. Under the metric for the 1999 RHR, modeling of the long term
strategies indicated that no RPGs could meet the pace ascribed to the Uniform Rate of
Progress, for any WESTAR state Class I Area, despite all the planned emissions reductions.

12/12/2017                                                                                 page 19
DRAFT v.2 for REVIEW

Exhibit 6. Initial Metric for Reasonable Progress

              RH SIP sets Reasonable Progress Goals for 2018
     Worst Haze
     Days Baseline                        Uniform Rate of Progress
                                          (Slope of the Glide Path)
                                                                            Worst Haze
                                                                           Days Average
                                                                            for Natural
                                                                            Conditions
  DECIVIEWS

                     Best Day Baseline (must not be degraded)

    Baseline                                                                additional time to
                       2018                                           2064 reach assigned
    (2000-2004)                         YEAR                                Natural Conditions

The 2017 RHR revision recognizes that the initial metric for measuring progress in reducing
visibility throughout the western United States was skewed by the contributions from natural
sources of haze precursors. Natural emissions from wildfires, dust storms, and volcanic gases
and ash make considerable contributions to the days with the worst haze. Modeling, satellite
data, and chemical analysis indicated that international emissions also contributed to haze.
Whether these were natural or anthropogenic, it was not possible for individual states to
control emissions from international sources. Federal Land Managers and others conducted
prescribed burns for resource benefits and to restore natural ecosystem conditions, whose
anthropogenic emissions also contributed to haze at Class 1 Areas.

The 2017 RHR allows states to make adjustments to the Glide Path to account for these natural
and uncontrollable emissions. In addition, an adjustment can be made to the Glide Path for the
impacts of prescribed burning meant to restore Natural Conditions to fire-dependent
ecosystems. Since the goal of the program is to reduce anthropogenic impacts that impair
visibility, states can now show progress on days Most Impaired by anthropogenic emissions, as
illustrated in Exhibit 7.

12/12/2017                                                                                page 20
DRAFT v.2 for REVIEW
Exhibit 7. Conceptual Glide Path for Visibility Protection Planning using a New Metric
Adjusted endpoint (adds
components for
Adjusted Glide Path International Emissions
and Prescribed Burning
2018 RPG to “Most Impaired Days”
for Natural Conditions
DECIVIEWS
Adjust Baseline for Days
“Most Impaired” by
Anthropogenic
Emissions by removing
impacts from extreme
natural episodic events
Initial Glide Path
Best or
Clearest Days
Baseline 2018 2028 2038 2048 2058 2064
(2000-2004)
YEAR
These adjustments change the Glide Path’s slope, the idealized Uniform Rate of Progress. The
adjustments, in concept, help states focus on the days most impaired by anthropogenic
emissions. The impacts of these naturally-occurring, extreme, episodic events (“e3”) such as
wildfires, dust storms, and volcanic emissions are removed from the averaging so that they will
not skew the measure of progress. The new metric is used to show the progress improving
visibility resulting from reductions in controllable anthropogenic emissions. Even under Natural
Conditions, assigned as a goal to 2064, the most impaired days will always have some
contributions from anthropogenic sources that cannot be controlled.
For a better understanding of what causes anthropogenic vs. natural haze at Class 1 Areas,
source apportionment and back trajectory modeling can be used to help determine the causes
of haze at a particular location. International emissions, both natural and anthropogenic,
impact various Class 1 Areas, as demonstrated by source apportionment modeling in the initial
planning period. This information and additional modeling of more current scenarios may be
used to help determine (quantify) the international contribution. Each state will also have to
make some adjustments using statistics, and local knowledge, to identify and quantify days
impacted by extreme episodic events from natural sources. By working with Federal Land
Managers, each state can determine an adjustment for future prescribed burning. In the
12/12/2017 page 21DRAFT v.2 for REVIEW absence of guidance, WESTAR states will develop protocols for arriving at the adjustment values, allowed in the revised RHR. Relationship between the RPG and the Glide Path In determining whether the State's 2028 goal for visibility improvement provides for reasonable progress towards natural visibility conditions, the Administrator will evaluate the demonstrations developed by the State. The RPGs established by the State are not directly enforceable but will be considered by the Administrator in evaluating the adequacy of the measures in the implementation plan to achieve the RPG adopted by the State. For each Class I Area located within the State, the State must establish goals (expressed in deciviews) that provide for reasonable progress towards achieving natural visibility conditions. The reasonable progress goals must provide for an improvement in visibility for the Most (anthropogenically) Impaired days over the period of the implementation plan and ensure no degradation in visibility for the Clearest Days over the same period (section(51.308(d)(1)). In plain English, the Most Impaired Days must have improved visibility since the prior planning period and the Clearest Days (least hazy, 20% lowest deciview days) cannot have diminished visibility. The State may not adopt an RPG that represents less visibility improvement than is expected to result from implementation of other requirements of the CAA during the applicable planning period (section 51.308(d)(1)(vi)). Section 51.308(f)(3) explains that if a State established an RPG for the prior period which provided a slower rate of progress than that needed to attain natural conditions by the year 2064, the State must evaluate and determine the reasonableness, based on the factors in paragraph (d)(1)(i)(A) of this section, of additional measures that could be adopted to achieve the degree of visibility improvement projected by the analysis contained in the first implementation plan described in paragraph (d)(1)(i)(B) of this section. Since the metric for determining the reasonable progress goal has changed between the first and the second planning period, WESTAR states will use the 2014-2018 Worst (Haze) Days average in deciviews to compare with the 2018 RPGs. All 2028 RPGs set for the second planning period will relate to the Most (Anthropogenically) Impaired Days, compared to the URP for the adjusted Glide Path. Meteorological and Emissions Modeling Meteorological and emission modeling will prepare the inputs for regional modeling. In order to complete these tasks, states must analyze the effects of current and future emissions to determine their effects on visibility at Class I Areas. To complement the 2014 base year emissions inventory, 2014 meteorological data will be used for all the regional modeling analyses. For most of the WESTAR States, this analysis will be done through regional modeling for thirteen states with shared boundaries, which do not include Alaska and Hawaii. 12/12/2017 page 22
DRAFT v.2 for REVIEW

   Additional Studies

The scope of analysis to support the 2021 revision is still being developed but it is anticipated it
may include the following:

   •   identify international influence (i.e., upwind boundary concentrations impacting the
       state, both currently and for 2028 forecasts);
   •   quantify pollutant specific impacts from international transport;
   •   determine how international influence varies over time and develop temporal profiles;
   •   assess meteorological conditions associated with temporal variations; and
   •   assess the role of atmospheric chemistry on the observed pollutants.

An investigation of source-specific pollutant and temporal profiles is a likely approach but it will
be a challenge to distinguish sources that emit similar pollutants. For example, marine vessels
and large commercial sources can both contribute to ammonium sulfate. Similarly, it will be
difficult to differentiate international versus domestic marine vessel emissions that contribute
to reduced visibility in coastal Class I Areas.

Alaska Analysis

For the first regional haze SIP, Alaska was not included in the regional modeling domain.
Instead, back trajectory and weighted emission potential analysis (WEP) provided insight into
the sources of haze affecting Alaska’s Class I Areas. Similar analysis may be conducted for the
2021 regional haze SIP. Alaska’s Department of Conservation (DEC) continues to develop and
update the Rural Inventory. DEC staff are also working to update and compare the Alaska
specific marine and aviation inventories with the NEI inventories to determine what additional
analysis will be needed for the 2021 SIP. As a result of the recent update to the Regional Haze
Rule (January 2017) Alaska will be developing the selection of the 20% most impaired days to
reflect anthropogenic emissions, as scientifically valid data becomes available. Alaska may
need to complete additional analysis similar to other states.

Hawaii Analysis

Like Alaska, Hawaii is not included in the Western state regional modeling domain.
Nonetheless, Hawaii will need to complete the required analyses of the emissions inventory,
monitoring data, and reasonable controls of anthropogenic impact on visibility at Hawaii’s
Class I Areas in order to set interim goals for 2028 in a Regional Haze SIP for the upcoming
planning period. Hawaii also needs to determine the contributions of natural volcanic
emissions to haze. The State may also need assistance to determine the impacts of prescribed
fires and international emissions on visibility.

12/12/2017                                                                                   page 23
You can also read