Western Washington Interagency Fire Danger Operating Plan - FINAL DRAFT 2020
←
→
Page content transcription
If your browser does not render page correctly, please read the page content below
Western Washington
                      Interagency Fire Danger Operating Plan
                                     FINAL DRAFT 2020

Version: 04/29/2020

This plan is compatible with NFDRS 2016 and to be used for comparison purposes only in 2020.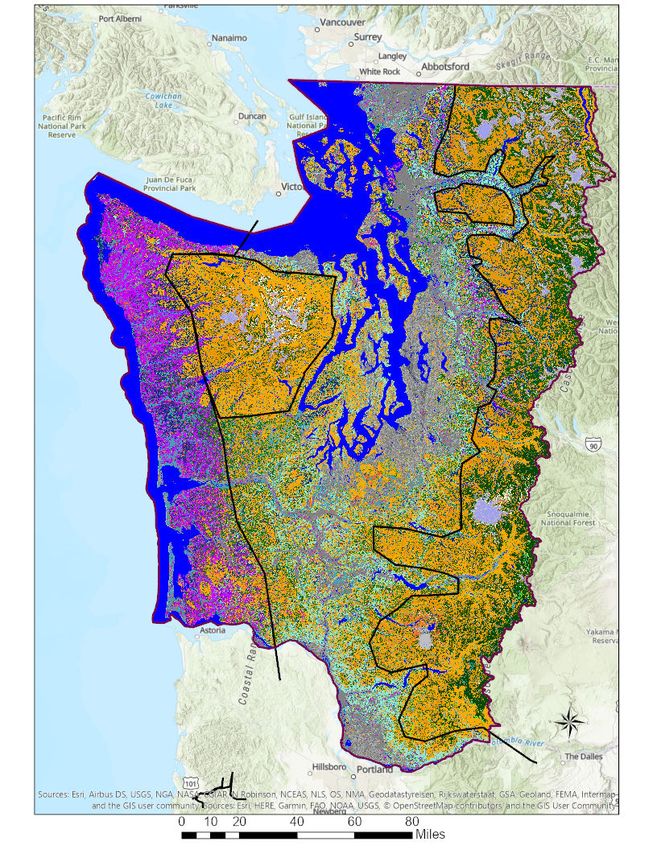
(page intentionally left blank)
Western Washington

                      Interagency Fire Danger Operating Plan

Approved by:
Signatories to this plan include the following agencies.

Washington State Department of Natural Resources, Northwest Region
Washington State Department of Natural Resources, South Puget Region
Washington State Department of Natural Resources, Pacific Cascades Region
Washington State Department of Natural Resources, Olympic Region
National Park Service, Olympic National Park
National Park Service, North Cascades National Park
National Park Service, Mount Rainer National Park
National Park Service, San Juan Island National Historical Park
US Forest Service, Olympic National Forest
US Forest Service, Mount Baker-Snoqualmie National Forest
US Forest Service, Gifford Pinchot National Forest
US Fish and Wildlife Service, Western Washington Zone
Bureau of Land Management, Spokane District
Bureau of Indian Affairs, Northwest Region

For simplicity’s sake, each agency will be responsible for maintaining a signed hardcopy on file.

Agency Administrator Printed Name:

Agency Administrator Signature and Date: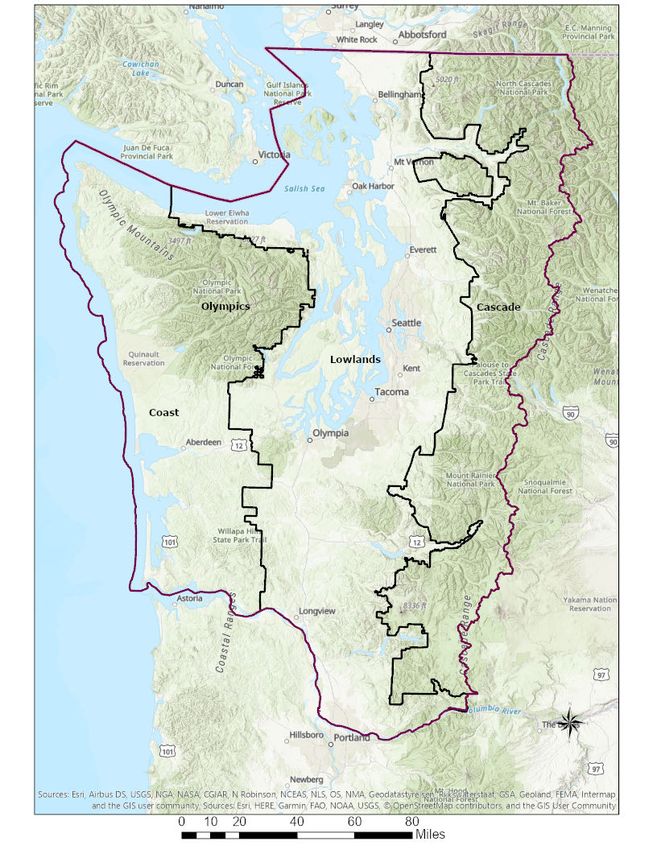
Prepared By: Technical Group

Vaughn Cork, Fuels Management and Fire Regulations, DNR-Olympia
Name, Title & Agency

Justin Sharpe, Fire Planner, USFS-Gifford Pinchot NF
Name, Title & Agency

Josh Georgio, Fire Dispatcher, USFS-Puget Sound Interagency Dispatch
Name, Title & Agency

Todd Rankin, Interagency FMO, Olympic Interagency Fire - NPS/FS/FWS
Name, Title & Agency

Aaron Anderson, AFMO, North Cascades National Park
Name, Title & Agency

Scott Ebel, FMO, North Cascades National Park
Name, Title & Agency
Contents
   Executive Summary 1
1.0 Introduction .............................................................................................................................. 1
   1.1 Purpose                   1
   1.2 Policy and Guidance                  3
   1.3 Operating Plan Objectives                       3
2.0 Fire Danger Planning Area Inventory and Analysis ................................................................... 4
   2.1 Administrative Units                 4
   2.2 Weather Stations                     6
   2.3 Fire Danger Rating Areas                        6
3.0 Fire Danger Problem Analysis ................................................................................................... 9
   3.1 Fire Occurrence                      9
   3.2 Identification/Definition of the Fire Problem(s)                                  10
4.0 Fire Danger Threshold/Decision Analysis ............................................................................. 144
   4.1 Climatological Breakpoints                      144
   4.2 Weather Station Analysis                        155
   4.3 Fire Business Analysis 16
   4.4 Parameters Used to Calculate Fire Danger                               16
   4.5 Decision Points                17
   Table 5: Fire Business Decision Summary Table                              18
5.0 Fire Danger Rating Level Decisions ......................................................................................... 18
   5.1 Response (or Dispatch) Level 19
   5.2 Staffing Level            19
   5.3 Preparedness Level                   20
   5.4 Adjective Fire Danger Rating Level                         21
   5.5 Public Use Restrictions 21
   5.6 Industrial Fire Precaution Level                           21
6.0 Fire Danger Operating Procedures ......................................................................................... 22
   6.1 Roles and Responsibilities                      22
6.2 Daily Schedule 24
   6.3 Critical Fire Danger                 24
   6.4 Season Ending Event                  25
   6.5 Fire Danger Pocket Cards/Seasonal Risk Analysis                                   255
   6.6 Weather Station Maintenance 255
Appendices.................................................................................................................................... 26
   Appendix A: Primary Distribution List                          26
   Appendix B: Fire Danger Rating Areas                           27
   Appendix C: FDRA Delineations                                  522
   Appendix D: Large Fire Growth Days                             Error! Bookmark not defined.7
Executive Summary
The intent of this 2020 Western Washington Fire Danger Operating Plan (WWFDOP) is to allow
agency administrators, dispatch centers, and fire managers in Western Washington the
opportunity to “test” the 2016 NFDRS models side by side with the original NFDRS system that
has been used in the past. This will allow a gradual transition to NFDRS 2016 which is mandated
in January 2021 and provide time to calibrate and adjust to the new models. For 2020, this plan
is not to be fully adopted, but rather will be used in conjunction with the plans/system that are
currently in place. A fully revised and updated WWFDOP will be required in 2021.

1.0 Introduction
1.1 Purpose
The public, industry, and our own agency personnel expect the interagency wildland fire
management agencies to implement appropriate and timely decisions which ultimately result in
safe, efficient, and effective wildland fire management actions.
This fire danger operating plan (FDOP) is intended to document a decision-making process for
agency administrators, fire management personnel, communication center personnel, and
agency co-operators by establishing interagency planning and response levels based upon an
assessment of vegetation, climate, and topography utilizing the national fire danger rating
system (NFDRS).

This plan provides science-based
rationale to support decisions which
have the potential to significantly
compromise safety and control of
wildland fires. This is achieved using
the best available scientific methods
and an analysis of historical weather
and fire data.

1.1.1 Preparedness Plan

Interagency policy and guidance
                                                               Figure 1: Preparedness Plan Relationship
require numerous unit plans and
guides in order to meet preparedness
objectives. Some of these plans and guides are inter-related or provide the basis for other
plans/guides, as shown in Figure 1.

This FDOP guides the application of information from decision support tools (such as NFDRS) at
the local level. This FDOP is supplemental to any Fire Management Plan that may exist within
the individual units; it documents the establishment and management of a fire weather station
network and describes how fire danger ratings will be applied to local unit fire management
decisions. The actual implementation of the fire business thresholds is described in the
                                                                                                          1
following supplemental action plans. The decision points are identified and documented in the
Fire Danger Operating Plan.

1.1.1.1 Preparedness Plan
Preparedness plans provide management direction given identified levels of burning conditions,
fire activity, and resource commitment. Preparedness levels (1 to 5) are determined by
incremental measures of fire danger, fire activity, and resource commitment. The preparedness
levels are identified and documented in this FDOP; the associated decisions and planned
actions are located with the individual agency-unit.

1.1.1.2 Staffing Plan
The staffing plan describes daily resource availability/capability to respond to unplanned
ignitions. Mitigating actions are designed to enhance the unit’s fire management capability
during short periods or other pre-identified events, where normal staffing cannot meet initial
attack, prevention, or detection needs. The decision points are identified and documented in
this FDOP; the associated decisions and planned actions are located with the individual agency-
unit.

1.1.1.3 Prevention Plan – Fire Danger Components

Prevention plans document the wildland fire problems identified by a prevention analysis. This
analysis will not only examine human-caused fires, but also the risks, hazards, and values for
the planning unit. Components of the plan include mitigation (actions initiated to reduce
impacts of wildland fire to communities), prevention (of unwanted human-caused fires),
education (facilitating and promoting awareness and understanding of wildland fire),
enforcement (actions necessary to establish and carry out regulations, restrictions, and
closures), and administration of the prevention program. The analysis of fire problems and
associated target groups are documented in this Fire Danger Operating Plan; the associated
decisions and planned actions are in located with the individual agency and/or units.

1.1.1.4 Public Fire Restriction Plan

A restriction plan is a document that outlines agency coordination efforts regarding fire
restrictions and closures. An interagency approach for initiating restrictions or closures helps
provide consistency among the land management partners, while defining the restriction
boundaries so they are easily distinguishable to the public. Based on the fire danger, managers
may impose fire restrictions or emergency closures to public lands. Decision points when
restrictions and/or closures should be considered are identified and documented in this FDOP;
the associated decisions and planned actions are located with the individual agency-unit.

                                                                                                   2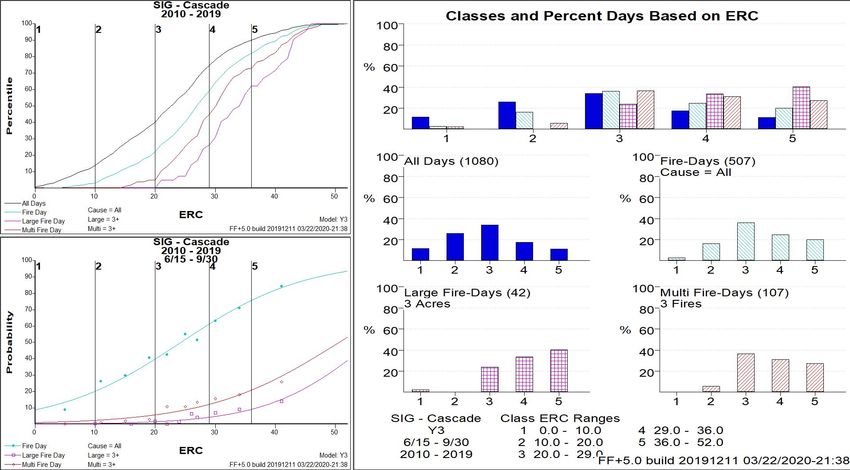
1.1.2 Wildfire Response

1.1.2.1 Initial Response Plan
Initial response plans, also referred to as run cards or pre-planned response plans, specify the
fire management response (e.g. number and type of suppression assets to dispatch) within a
defined geographic area to an unplanned ignition based on fire weather, fuel conditions, fire
management objectives, and resource availability. Response levels are identified and
documented in the Fire Danger Operating Plan. The number and type of suppression resources
dispatched to a reported fire is developed by local agency units and located within the
individual dispatch centers.

1.1.2.2 Local Mobilization Plan

The mobilization plan identifies standard procedures, which guide the operations of multi-
agency logistical support activity throughout the coordination system. The mobilization plan is
intended to facilitate interagency dispatch coordination, ensuring the timeliest and most cost-
effective incident support services available are provided. Communication between units,
GACCs, state, regional offices and other cooperative agencies are addressed. The mobilization
plan is updated annually and distributed to fire managers and posted on the local dispatch
office website and/or distribution list.

1.2 Policy and Guidance
Interagency policy and guidance regarding the development of Fire Danger Operating Plans can
be found in the Interagency Standards for Fire & Aviation Operations (Red Book). Agency
specific direction can be found in:

U.S. Forest Service – Manual 5120 - Fire Management - Preparedness
Bureau of Land Management – Manual 9211 - 1 - Fire Planning Handbook
National Park Service - National Park Service – Manual 18, Chapter 5 – Preparedness
Fish and Wildlife Service – Fire Management Handbook, Chapter 10 - Preparedness
Bureau of Indian Affairs – Wildland Fire and Aviation Program Management Operations Guide

1.3 Operating Plan Objectives
   1. Provide a tool for agency administrators, fire managers, dispatchers, agency co-
      operators, and firefighters to correlate fire danger ratings with appropriate fire business
      decisions in fire danger planning area.
   2. Delineate fire danger rating areas (FDRAs) with similar climate, vegetation, and
      topography.
   3. Establish an interagency fire weather-monitoring network consisting of remote
      automated weather stations (RAWS) which comply with NFDRS weather station
      standards (PMS 426-3).
   4. Define climatological breakpoints and fire business decision thresholds using the
      Weather Information Management System (WIMS), National Fire Danger Rating System

                                                                                                  3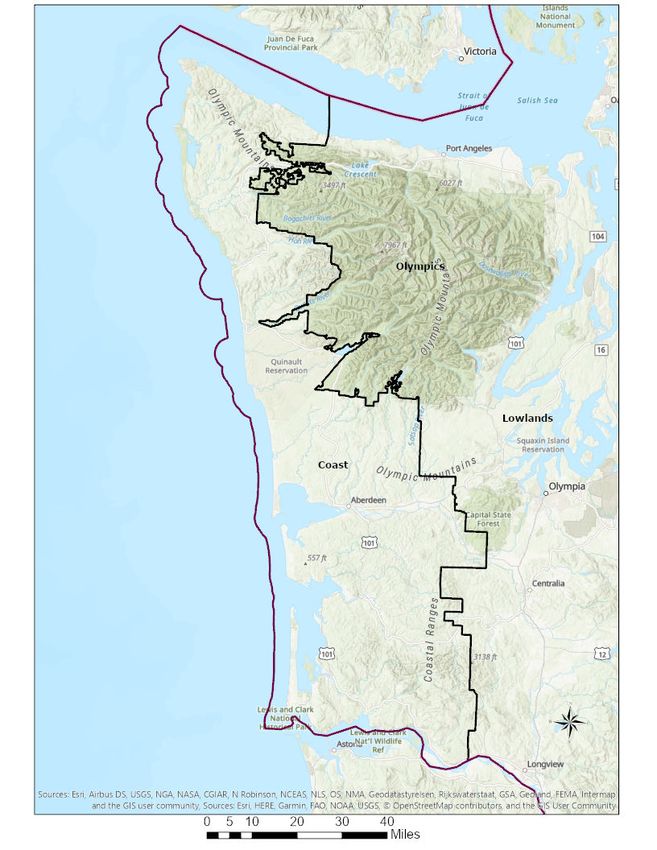
(NFDRS), and Fire Family Plus software to analyse and summarize an integrated
database of historical fire weather and fire occurrence data. Identify seasonal risk
analysis criteria and establish general fire severity thresholds.
5. Define roles and responsibilities to make fire preparedness decisions, manage weather
information, and brief fire suppression personnel regarding current and potential fire
danger.
6. Improve communication methods for fire managers to communicate potential fire
danger to cooperating agencies, industry, and the public.
7. Provide guidance to interagency personnel outlining specific daily actions and
considerations at each preparedness level.
8. Identify the development and distribution of fire danger pocket cards to all personnel
involved with fire suppression within the fire danger planning area.
9. Provide a framework that units may use to evaluate their implementation of the plan
and identify program needs.
2.0 Fire Danger Planning Area Inventory and Analysis
2.1 Administrative Units
This document supports the consistent and effective application of fire danger decisions
applied across multiple jurisdictional boundaries within Western Washington. Wildland fire
management and suppression responsibilities are shared among Federal, State, and local co-
operators.
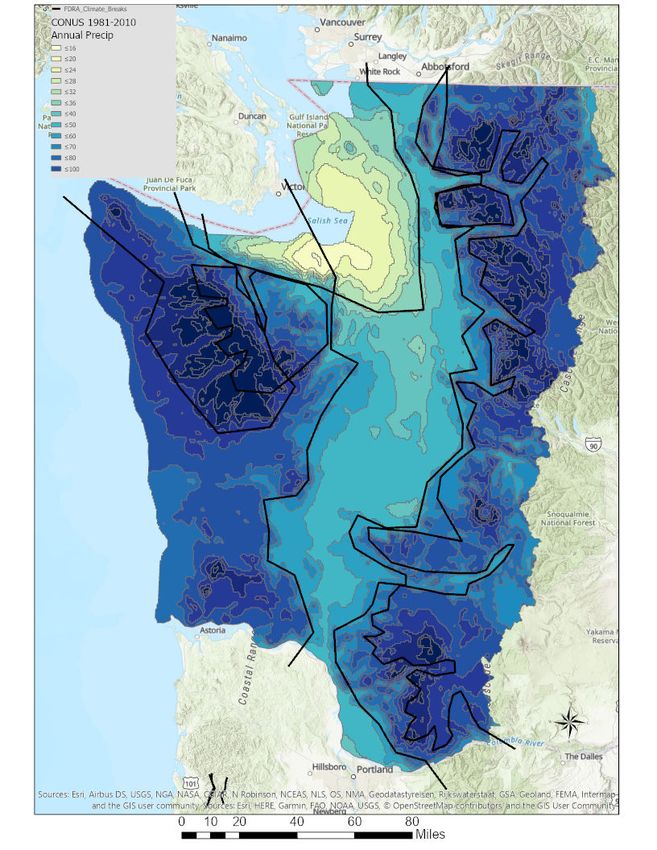
4Figure 2: Overview Map
5Table 1: Ownership Table
Approx.
Agency Acreage
WA-DNR 1,528,958
USFS 3,606,335
BLM 3,045
NPS 1,677,676
FWS 24,048
BIA 322,386
OTHER STATE LANDS 107,146
PRIVATE 8,280,541
DOD 8,308
2.2 Weather Stations
All RAWS used in this plan to produce NFDR outputs comply with the National Wildfire
Coordinating Group (NWCG) weather station standards and guidelines (PMS 426-3). Each RAWS
receives, at a minimum, one annual on-site maintenance visit by either the local user or
contracted personnel to ensure sensors are within calibration standards and to verify site and
station conditions.
2.3 Fire Danger Rating Areas
A fire danger rating area (FDRA) is defined as a large geographic area relatively homogenous
with respect to climate, vegetation and topography. Because of these similarities, it can be
assumed that the fire danger within a FDRA is relatively uniform. FDRA were delineated based
upon an analysis of these three factors; climate, vegetation, and topography. Delineations are
depicted in Appendix C with specific analysis of each area in Appendix B.
After these environmental factors were considered, the draft FDRAs were edge-matched to
existing administrative boundaries. Primarily local fire district boundaries where available and a
combination of major roads/river/ridges and administrative boundaries (mostly legal lines)
elsewhere.
Communications center response area boundaries, although typically aggregated to form
FDRAs, were not used. Some response areas such as local fire district boundaries were not split
by FDRAs to avoid additional workload and confusion for operational personnel. The final FDRA
delineation is depicted below and described below in section 2.3.1.
6Figure 3: Proposed FDRA boundaries
2.3.1 FDRA Descriptions
The following descriptions describe the general areas within each FDRA. More detailed
information can be obtained at the Western Region Climate Center state climate narratives,
https://wrcc.dri.edu/Climate/narrative_wa.php.
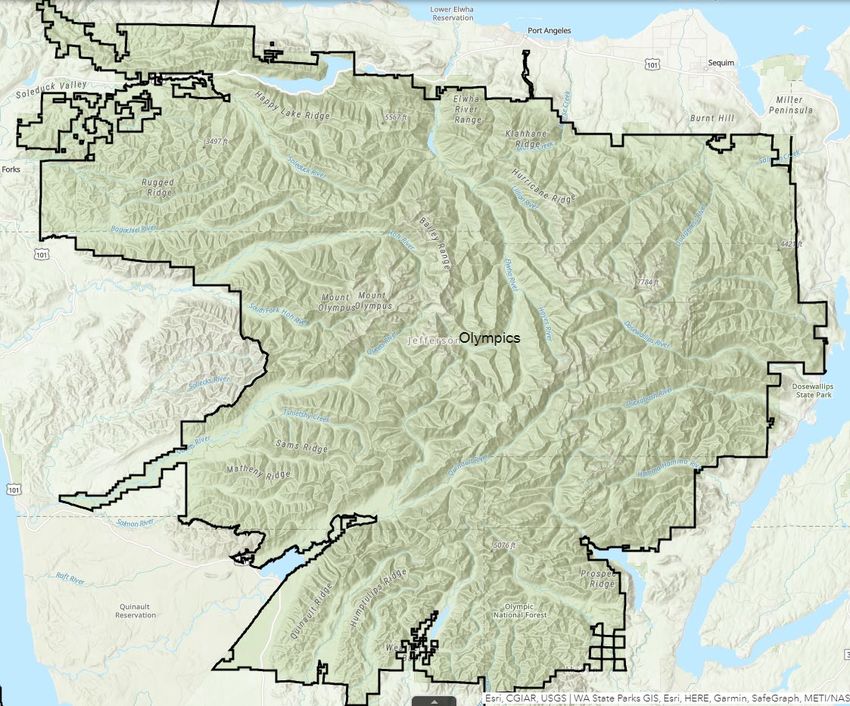
72.3.1.1 Olympics FDRA
General Location: This area includes the Olympic Mountains on the Olympic Peninsula.
Vegetation: Primarily Timber with understory.
Climate: Annual precipitation ranges from 70 to 100 inches over the lower western slopes of
the Olympics to 150 inches or more along the windward slopes of the mountains. A significant
rain shadow causes a dramatic decrease in precipitation on the east side of the Olympics with
as little as 15-18 inches rain in some areas.
Topography: Terrain is extremely steep and rugged in the Olympics. Elevation varies from
approximately 1,000 feet in the lower river valleys to 7500’ in the higher peaks of the Olympics.
2.3.1.2 Lowlands FDRA
General Location: The Puget Sound Lowlands extending from the Columbia River to the
Canadian border. The I-5 corridor bisects the FDRA with 30-40 miles extending on either side. It
includes the San Juan Islands and the lower elevation of the northern Olympic Peninsula.
Vegetation: Timber, Grass and Brush.
Climate: This is the warmest, driest, and most densely populated region of western
Washington. In the rain shadow of the Olympics from Port Angeles to Mt Vernon, and including
the San Juan Islands, the annual precipitation ranges from 18 to 30 inches. Average
summertime highs range from 65° F near the water, to 75° F inland. For the rest of the
Lowlands FDRA from Mt Vernon and Quilcene, south to the Columbia River, annual
precipitation ranges from 32 to 45 inches of precipitation with average summertime highs from
73° to 78° F.
Topography: The majority of the FDRA is made up of gently rolling terrain below 800ft MSL,
with a few mountainous sections along the Cascade foothills that reach up to 3,800ft MSL.
2.3.1.3 Coast FDRA
General Location: This area includes the coastal plains and the western slope of the Coastal
Range from the Columbia River to the Strait of Juan de Fuca. It extends from the coastline to
approximately 40 miles inland at its furthest extent.
Vegetation: Timber with some grass fuel types found in coastal prairies and areas of dune
grasses, generally following the natural range of Sitka Spruce.
Climate: The area receives the full force of storms moving inland from over the Pacific Ocean.
The "rainforest" area along the southwestern and western slopes of the Olympic Mountains
receives the heaviest precipitation in the continental United States. Annual precipitation ranges
from 70 to 100 inches over the Coastal Plains to 150 inches or more along the windward slopes
of the mountains. A morning marine layer with mist or drizzle is common during the spring and
summer.
8Topography: Elevation ranges from sea level to 2000’ at the highest points.
2.3.1.4 Cascades FDRA
General Location: This area includes the western slope of the Cascade Range from an elevation
of approximately 1,000 feet to the crest of the Cascades and extending from the Columbia River
to the Canadian Border.
Vegetation: Timber.
Climate: The annual precipitation ranges from 60 to 100 inches or more. Indications are that
the heaviest precipitation probably occurs along the slopes of east-west mountain valleys which
become narrower as the elevation increases along the windward slopes of the Cascades.
Annual precipitation in some of the wetter areas has reached 140 inches in one out of ten
years.
Topography: The Cascades range has extremely steep, rugged terrain. Elevation ranges from
approximately 1000” in the foothills to over 7000’.
3.0 Fire Danger Problem Analysis
In order to apply a fire danger system which will assist managers with fire management
decisions, ignition problems need to be identified, quantified, framed, and associated with a
specific target group to determine the most appropriate fire danger-based decision tool to
mitigate the given issue.
3.1 Fire Occurrence
Ten years (from 2009 to 2019) of fire occurrence data were used for the analysis in this FDOP.
Data was obtained from the spatial wildfire occurrence data for the United States dataset. Fires
are considered without regard to agency affiliation. Fire occurrence charts by FDRA can be
found in Appendix B.
Due to the low occurrence of large fires in the Olympics and Cascades along with the low
correlation between fire discovery date and large fire growth events, the fire data were
modified in order to facilitate the fire occurrence analysis. The methodology included taking a
long duration, large fire event (mainly for the Olympics and North Cascades) and defining large
fire growth days or active fire behaviour periods during the life of the incident. Each of these
dates was recorded separately in order to “correct” the data to represent each time the fire
exhibited active fire behavior and/or large fire growth. The justification for this adjustment is
that many of the fires are managed using a monitor or confinement strategy and can remain on
the landscape for long periods of time without having significant activity. By defining the large
fire growth days, there can be a better analysis for the indices that best correlate to the
“active” fire periods.
93.2 Identification/Definition of the Fire Problem(s)
The ability to regulate, educate, or change behaviour within a user group will be based upon
the interface method and how quickly they can react to the action taken. Consequently, the
most appropriate decision tool would depend upon the sensitivity of the target group to the
implementation of the action. In addition, each action will result in positive and/or negative
impacts to a user group.
In selecting a component and/or index, several factors must be considered:
Affected Target Group: The group of people commonly associated with the problem (e.g.,
agency, industry, or public).
Agency: Employees of the federal, state, and local governments involved in the cooperative
effort to suppress wildland fires. This includes Federal, State, and County land management
employees, along with volunteer fire departments who share a similar protection mission to
manage wildland fires.
Industry: Employees affiliated with organizations which utilize natural resources and/or obtain
permits or leases to conduct commercial activities on federal, state, or private lands. These
entities or activities could include ranchers, wilderness camps, railroads, mines, timber
harvesting, filming, building construction, oil and gas, electric generation, guiding services, etc.
Public: Individuals who use public lands for non-commercial purposes such as off-highway
vehicle use, camping, hiking, hunting, fishing, skiing, firewood gathering, agriculture, mountain
biking, general travel and recreation. This group also includes those living within the wildland
urban interface.
Problem Definition: This is the problem specific to the area of concern and includes ignition
causes. The problem is framed to focus on the wildland fire management issue associated with
a specific target group.
Degree of Control: This is a general description of how much control the fire management
agencies have over the target group (High to Low). This is a measure of how quickly the
affected target group can respond to changing fire danger levels.
Communication: Various methods of communication are utilized to influence an affected target
group to change their behavior. Depending upon the specific target group, communication may
include face-to-face verbal conversations, radio, telephone, email, newspaper, television,
signing/posting, text messages, etc.
Component/Index: Sensitivity of the NFDRS outputs should be commensurate with the ability
to react (or communicate) to the target group.
Management Action: The actions or applications are pre-defined and taken at breakpoints
determined through an analysis of fire danger indices and fire occurrence. Collectively the
decision points represent levels of fire danger applied as a communication mechanism to
specific target groups. The intent is to minimize the risk of a fire ignition problem by controlling
or influencing a specific target group (Agency, Public, and Industry).
10Figure 4: Fire Summary for Western Washington FDOP
11Table 2: Identification and definition of the fire problem in Western Washington.
RELATIVE COMMUNICATION PROBLEM
TARGET GROUP IGNITIONS CAUSE
DEGREE OF METHODS
CONTROL
General Specific General Specific
Agency Agency suppression 1- Lightning High Dispatch centers Fires which exceed the units
resources and fire Lightning communicate fire capability to manage due to
managers weather (LAL) and growth on the discovery day
fire danger (SL and
PL)
Agency Agency suppression 1- Abundant Lightning High Dispatch centers Fires which exceed the units
resources and fire Lightning communicates fire ability to manage because the
managers weather (LAL) and number of ignitions exceeds
fire danger (SL and initial attack capability and/or
PL) fires escape initial attack on
subsequent days
Public Public using overnight 4- Unattended (and High PIO/Prevention Campfires in developed
developed recreation Campfire escaped) campfires Radio, media recreation areas that escape and
sites broadcast, news become large fires or tie up
release and agency resources allowing other
internet. Smokey fires to grow and escape initial
Arm, adj. signs and attack
prevention patrols
Public Public using agency 4- Unattended (and Low PIO/Prevention Campfires in undeveloped or
lands for day use or Campfire escaped) campfires Radio, media day use recreation sites that
undeveloped broadcast, news escape and become large fires
overnight use release and or tie up agency resources
internet. Smokey allowing other fires to grow and
Arm, adj. signs and escape initial attack
prevention patrols
Industry Woods workers and 2- Any ignition associated Moderate Dispatch centers Ignitions which become large
Industrial forest users Equipment with the target group communicate IFPL fires resulting from industrial
for agency
12operating on public from chainsaws to personnel, state forest operations (equipment
lands yarding posts on internet and smoking)
for public
Public Private Landowners 5 - Debris Escaped debris burns Low Burn restrictions Escaped debris burns which
Burning posted on the become large fires or tie up
dispatch website, agency resources
Radio, media
broadcast, news
release and
internet
134.0 Fire Danger Threshold/Decision Analysis
Decision points can be based upon either:
• Climatological Breakpoints, or
• Fire Business Thresholds.
The FDOP will be used to support fire management decisions made at specific decision points. A
decision point is a point along the range of possible output values where a decision shifts from
one choice to another. When conditions, or a combination of events and conditions, signal that
it is time to do something different a decision point has been reached. Decision points are
identified for selected indices and levels within each FDRA.
4.1 Climatological Breakpoints
Climatological breakpoints are points on the cumulative distribution curve of a fire danger
indices computed from climatology (weather). For example, the value at the 90th percentile ERC
is the climatological breakpoint at which only 10 percent of the ERC values are greater in value.
Climatological percentiles were originally developed for budgetary decisions by federal
agencies, without regard for associated fire occurrence, and are predetermined by agency
directive, as exemplified below:
BLM: 80th and 95th percentiles
FWS, NPS, USFS: 90th and 97th percentiles
When using climatology, it is important to identify the period of record used to determine the
agency percentiles. The percentile values for the calendar year will be different from the
percentile values for the fire season.
Where possible the decision thresholds identified in this FDOP are based upon the statistical
correlation of historical fire
Figure 5: Climatological Breakpoints Example
occurrence and weather
data and, therefore, do not
utilize climatological
percentiles for decision
points. Note the fire business
charts to the right showing
climatological breakpoints on
the left and fire business
thresholds on the right.
Increased preparedness
actions taken at levels 4/5
have little potential to affect
outcomes using traditional
climatological breakpoints
14since most of the fire problems occur at level 3.
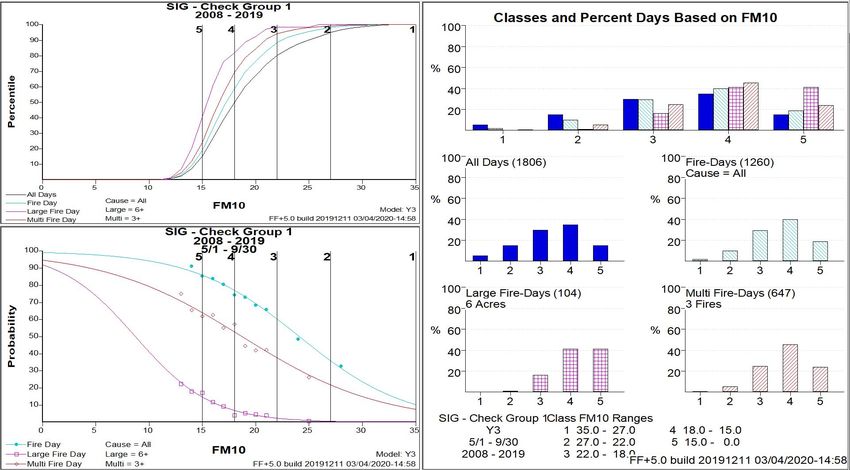
4.2 Weather Station Analysis
Remote Automated Weather Stations (RAWS) in different geographical locations with common
sensitivity to NFDRS model inputs can be grouped together to form a special interest group
(SIG). Refer to the Appendix B for details regarding the weather station analysis. The stations
and SIGs below were chosen based on location, station and data quality, and the statistical
correlation to the fire problem in section 4.3 below.
Many stations at the higher elevations suffer outages in the winter due to snow loading or are
difficult to repair timely because of access issues. This has created significant gaps in the data
for many stations and limited the number of stations available for analysis. When data gaps
can be filled, SIGS and FDRA’s should be re-analyzed to ensure the validity of the data. The
impacts of having corrected manual observations without the remaining 23 hours of data
provides a case where the data counts appear complete, but the other 23 hours of missing data
is causing a misrepresentation of the indices.
4.2.1 NFDR Stations and Special Interest Groups (SIGS)
Table 3: FDRA RAWS stations list
FDRA Station Station Name Owner WIMS Ann Prec
Coast 450130 Ellis Mt WA-DNR 106
450306 Minot LO WA-DNR 100
450312 Humptulips WA-OLF 160
450407 Huckleberry WA-DNR 120
Lowlands 450207 Quilcene WA-OLF 45
451207 Castle Rock WA-DNR 45
451507 Sedro Woolley WA-DNR 47
451702 Enumclaw WA-DNR 49
451103 Chehalis WA-DNR 46
Olympic 450117 Cougar WA-OLF 50
450121 Tom Creek WA-OLF 100
450124 Hurricane WA-OLP 74
450911 Jefferson WA-OLF 90
Cascade 451115 HAGER WA-GPF 50
451613 GOLD MT WA-MBF 70
451718 GREENWATER WA-DNR 140
451721 FIRE ACADEMY WA-MBF 64
451924 DRYCR WA-GPF 70
154.3 Fire Business Analysis
A statistical correlation of fire occurrence with fire danger indices, weather stations, and fuel
models was used in conjunction with the fire problem analysis table in Section 3.2 above to
determine the best combination for predicting the fire problem in each FDRA.
All 5 NFDR fuel models were given a cursory examination however the use of GSI for NFDR in
this area needs further consideration and adjustment at this time as live fuels are not curing
during the fire season under current vapor pressure deficit settings. Fuel model Y contains no
live fuels and often had better statistical results than others, perhaps in part to the
aforementioned GSI issue. Statistical results of chosen combinations are included in the FDRA
information sheets in Appendix B.
4.4 Parameters Used to Calculate Fire Danger
Large fires, multiple fire days, and herb type were determined through analysis and participant
input. KBDI and precipitation are both required to run NFDR 2016. KBDI, used to adjust for
drought fuels, was left at the default of 100. Annual precipitation from the PRISM dataset,
shown in the previous table, was used instead of a GIS precipitation analysis, this may or may
not be desirable with NFDR 2016 and should be further explored.
Table 4:
FDRA Station Name Analysis Analysis NFDRS Slope Avg Initial Max Herb Station
ID Years Time of Fuel Class Precip KBDI SC Annual Weight
Year Model
Cascade 451115 Hager 2010-2019 June 15- Y 3 50 100 5 N 1
Sept 30
451509 Finney 2010-2019 June 15- Y 3 90 100 5 N 1
Sept 30
451718 Greenwater 2010-2019 June 15- Y 4 140 100 5 N 1
Sept 30
451721 Fire Academy 2010-2019 June 15- Y 3 64 100 5 N 1
Sept 30
451924 Dry Creek 2010-2019 June 15- Y 3 70 100 5 N 1
Sept 30
Coast 450130 Ellis Mt 2008-2019 June 1 - Y 3 106 100 5 N 1
Oct 1
450306 Minot LO 2008-2019 June 1 - Y 2 100 100 5 N 1
Oct 1
450312 Humptulips 2008-2019 June 1 - Y 4 160 100 5 N 1
Oct 1
450407 Huckleberry 2008-2019 June 1 - Y 4 120 100 5 N 1
Oct 1
Lowland 450207 Quilcene 2008-2019 May 1 – Y 3 45 100 5 N 1
Sept 30
451207 Castle Rock 2008-2019 May 1 – Y 2 45 100 5 N 1
Sept 30
451507 Sedro Woolley 2008-2019 May 1 – Y 2 47 100 5 N 1
Sept 30
451702 Enumclaw 2008-2019 May 1 – Y 2 49 100 5 N 1
Sept 30
451103 Chehalis 2008-2019 May 1 – Y 2 46 100 5 N 1
Sept 30
16Olympic 450117 Cougar 2008-2019 June 15- Y 4 50 100 5 N 1
Sept 30
450121 Tom Creek 2008-2019 June 15- Y 4 100 100 5 N 1
Sept 30
450124 Hurricane 2008-2019 June 15- Y 4 74 100 5 N 1
Sept 30
450911 Jefferson 2008-2019 June 15- Y 4 90 100 5 N 1
Sept 30
4.5 Decision Points
Using Fire Family Plus software (5.0), NFDRS decision points have been identified where
changes in fire business should occur, as illustrated in the chart below. Threshold charts for all
FDRAs are included in the Appendix B. Energy release component 10HR fuel moisture and
burning index were carried forward from the analysis for use in this plan as the basis for setting
fire danger levels. Decision points based on fire business analysis are available in Appendix B
within each FDRA’s Information Sheet.
Figure 6: Example of Decision breakpoints
17Table 5: Fire Business Decision Summary Table
TARGET DECISION INDEX FUEL SUBORDINATE PLAN USED TO MODIFY
GROUP POINTS MODEL TARGET GROUP BEHAVIOR
Agency 5 ERC Y Staffing Plan
Agency 3 10HR, Burning Y Response Plan
Index, ERC
Agency 5 ERC Y Preparedness Plan
Public 5 ERC Y Prevention Plan (Adjective Rating)
Public TBD by Unit ERC Y Prevention Plan or Public Use Restriction Plan
Industry 4 IFPL Y Industry/Public Use Restriction Plan
5.0 Fire Danger Rating Level Decisions
The NFDRS utilizes the WIMS processor to manipulate weather and forecast data stored in the
National Interagency Fire Management Integrated Database (NIFMID) to produce fire danger
ratings for corresponding weather stations. The NFDRS outputs from the WIMS processor can
be used to determine various levels of fire danger rating to address the fire problems identified
previously in the Fire Problem Analysis Chart. The system is designed to model worst-case fire
danger scenario. The NFDRS, along with other decision support tools, will be utilized to produce
levels (thresholds) of fire business to address local fire problems by targeting public, industrial,
or agency groups.
The NFDRS will be utilized to produce outputs to assist fire managers with six sets of decisions.
For the 2020 Fire season Response levels, Staffing Levels, and Preparedness Levels will be
calculated by individual dispatch centers, with an expectation of coordination with adjacent or
overlapping centers. The Adjective Rating level will be discussed with a representative from all
units on a weekly phone call during fire season at a minimum.
• Response Levels will be used as a decision tool for dispatchers to assign initial attack
resources to a fire reported in a specific dispatch zone.
• Staffing Levels will be used for appropriate day-to-day suppression resource staffing.
• Preparedness Levels will assist fire managers with more long-term (or seasonal) decisions
with respect to fire danger.
18• Adjective Rating Level will be used to communicate fire danger to the public.
• Industrial Fire Precaution Level will be used to curtail preventable industrial ignitions.
• Public Use Restriction Level will be used to curtail public ignitions.
5.1 Response (or Dispatch) Level
Calculation and Communication will be managed at the local level with an expectation of coordination between
centers
Response (or dispatch) levels are pre-planned actions which identify the number and type of
resources (engines, crews, aircraft, etc.) initially dispatched to a reported wildland fire based
upon fire danger criteria. Dispatch levels are established to assist fire managers with decisions
regarding the most appropriate response to an initial fire report until a qualified Incident
Commander arrives at the incident. Response level in this plan is a direct function of staffing
level.
5.2 Staffing Level
Calculation and Communication will be managed at the local level with an expectation of coordination between
centers
STAFFING LEVEL RESPONSE LEVEL
1
2 1
3
4 2
5 3
The staffing level forms the basis for decisions regarding the degree of readiness of initial attack
(IA) and support resources. Staffing Levels are expressed as numeric values where 1 represents
the low end of the fire danger continuum and 5 the high end. Staffing level is intended to
provide fire managers with day-to-day decision support regarding staffing of suppression
resources such as employee overtime associated with working people beyond their normal
schedules and extended staffing of shared resources such as air tankers, helicopters, hotshot
crews and other large fire support resources.
The process for determining local staffing levels is not the same as staffing level calculated
directly from WIMS. WIMS calculates staffing level on climatological breakpoints; For 2020
Individual Dispatch Centers will calculate their respective staffing levels, with an expectation of
coordination with adjacent or overlapping centers. Dispatch centers will calculate staffing level
based on decision points identified in their own staffing plans and unit fire staff will check
correlation with this plan and use that as a communication tool between units. This graph is to
be utilized as an example and a starting point for further discussion and refinement.
191 2 3 4 5
STAFFING INPUT VALUE
□ □ □ □ □
RED FLAG WARNING, FIRE No Yes No Yes No Yes No Yes
↓
WEATHER WATCH, IA ACTIVITY? □ □ □ □ □ □ □ □
STAFFING OUTPUT VALUE I II III IV V
The primary input is the forecast or observed staffing level based on the decision points defined
in this plan. The secondary input is specific to the respective dispatch area, and may include
inputs such as red flag warnings, fire weather watches or warnings, public use triggers like
holidays, offshore flow, thermal trough in place, predicted lightning etc. These secondary
inputs may increase or decrease the staffing level from the primary input.
5.3 Preparedness Level
Calculation and Communication will be managed at the local level with an expectation of coordination between
centers
The preparedness level is a five-tier (1-5) fire danger rating decision tool that is based on NFDRS
output(s) (energy release component, Y) and other mid- to long-term indicators of fire business
such as fine fuel loading or drought. Preparedness levels are established to assist fire managers
with weekly or monthly planning decisions.
The preparedness level worksheet below is presented as an example. Units should document
specific preparedness level procedures, including calculation frequency, in unit preparedness
plans.
Variable Response Factor
Staffing Level Staffing Level 1-5 1-5
Yes Add .25
IA Commitment
No Subtract .25
Yes Add .25
Extended Attack
No Subtract .25
7 Day Fire Potential Yes Add .25
PSAs- NW01, NW02 No Subtract 0
Increasing Add .25
GACC PL Holding Steady 0
Decreasing Subtract .25
The preparedness input value should be an average, or weighted average, of the forecast
preparedness level and trend pertinent to the unit. For example, Northwest DNR may choose to
use the average of the Cascades and Lowland fire danger rating area current/forecast trend
value as the input since this covers most of their response area of concern.
205.4 Adjective Fire Danger Rating Level
Informed by Staffing level value calculated, published and broadcast twice daily by the communications centers.
Actual value set weekly during fire season based on discussion with agency or unit representatives.
In 1974, the USFS, BLM and state forestry organizations established five standard adjective fire
danger rating levels descriptions for public information and signing. For this purpose only, fire
danger is expressed using the national adjective descriptions and colour codes.
Although NFDRS processors (e.g., WIMS) automatically calculate the adjective rating based on
climatology, units participating in this plan will use FDRA preparedness level (ERC-Y)
thresholds/breakpoints defined in this plan as the basis for discussions with cooperators for
setting FDRA adjective rating level.
ERC Breakpoint Adjective Rating
1 Low
2 Moderate
3 High
4 Very High
5 Extreme
5.5 Public Use Restrictions
Set by the unit, ideally informed by adjective rating or unit calculated preparedness value.
Public use restrictions are implemented and set by the individual agencies participating in this
plan. Currently there is not a coordinated interagency set of restrictions/levels (or actions) used
by participants in this plan.
Ideally units will set public use restrictions based on, or informed by, adjective rating (less risk
tolerant) or unit calculated preparedness level (more risk tolerant). Number of levels, actions,
and basis for decision making will be defined in unit prevention plans or public use restrictions
plans.
5.6 Industrial Fire Precaution Level
DNR, U.S. Forest Service, Bureau of Land management and Bureau of Indian Affairs all use the
same four-level industrial regulation system. This system, which helps prevent wildfires by
regulating work in the woods, is known as the Industrial Fire Precaution Level (IFPL) system.
More information on IFPL in Washington can be found on the Washington Department of
Natural Resources page here.
21Figure 7: IFPL Lookup Table
The model above is being tested as a replacement for the 1978 precaution value for
determining IFPL. The model uses ERC-Y and IC-Y index values for the IFPL zone SIG.
Development is ongoing and any future iterations will be incorporated in this document as they
are developed and approved. The publicly posted IFPL value will be determined through
regular fire danger coordination that includes the respective land management agencies with
jurisdiction for each IFPL zone.
6.0 Fire Danger Operating Procedures
6.1 Roles and Responsibilities
6.1.1 Agency Administrators
Agency Administrators will use this plan to coordinate with fire management officers on fire
business related decisions.
226.1.2 Fire Program Managers
Fire program managers (FMOs) will use this FDOP and NFDRS outputs as a tool to coordinate
and to make informed fire business decisions. The fire program manager is ultimately
responsible for ensuring this plan is maintained, utilized, and communicated.
Fire program managers will ensure that their stations are maintained to NFDRS standards.
6.1.3 Fire Danger Technical Group
Each participating agency will be responsible for providing an NFDRS technical specialist to
participate in the maintenance, review, and update of this plan. These individuals are listed in
front of the table of contents.
Members of the Fire Danger Technical Group will monitor NFDRS to ensure validity,
coordinate/communicate any problems identified, review plan implementation, coordinate
plan revisions, present the plan, and be available for NFDRS technical consultation. The
technical group will coordinate with fire managers from their unit for updates and additions to
the plan. The technical group will coordinate annually to review plan implementation, decide if
revisions are necessary, and accomplish revisions.
6.1.4 Fire Weather Station Owners/Managers
The station owners will ensure appropriate editing of the RAWS catalogues to match this plan
and maintain current primary and secondary contacts for stations. Station owners will maintain
stations in accordance with NWCG PMS 426-3 and ensure a timely response when notified of an
unexpected need for repair.
6.1.5 Communication Center
The dispatch centers will ensure that the daily NFDRS indices are retrieved and that the daily
staffing and preparedness levels are calculated, communicated, and made available during fire
season, April 1st through October or season end, and as requested by participants in this plan
due to extenuating factors.
The dispatch centers will monitor RAWS daily for unusual readings that may suggest an issue
needing attention and contact the station owners to arrange resolution and notify agency fire
program managers (FMO).
The dispatch centers will give WIMS the proper seasonal care and inputs required to run NFDR
2016, including setting snow flags and starting KBDI. Dispatch centers will be responsible for
the RAWS stations under their jurisdiction. For example, PSICC will monitor and maintain inputs
for Stations owned by the Mt Baker Snoqualmie NF and North Cascades National Park within
the Cascade FDRA. Columbia Cascade will monitor stations and inputs for stations on the
23Gifford Pinchot portion of the FDRA, and DNR dispatch centers will do the same for all DNR
owned stations.
6.1.6 Duty Officers
A duty officer from each agency will be identified to the appropriate dispatch center
throughout the fire season. It is the duty officer role to interpret and modify the daily staffing
and preparedness levels (if warranted) by extenuating factors not addressed by this plan to
make fire business decisions.
6.1.7 National Weather Service
Weather forecasts and products for the area are provided by the National Weather Service,
Seattle and Portland offices. The annual Northwest Fire Weather Operating Plan contains
contact information and product listing (including NFDRS point and trend forecast products)
and can be found on the Northwest Coordination Center Website.
6.2 Daily Schedule
The intent is to provide web based NFDRS products from which dispatchers and managers can
quickly and easily obtain the needed information to calculate and communicate fire danger
levels. This information has previously been hosted externally and communication centers
should be prepared to obtain the outputs from WIMS and using the tables and worksheets in
this plan. The link to this website will be distributed to the participating dispatch centers by
May 15, 2020.
Dispatch centers will use the current day’s forecasted indices for the morning fire weather
broadcast. Those will be in effect until the afternoon fire weather broadcast that will
communicate the observed indices for the day.
Morning and afternoon broadcasts will include the observed and predicted ERC, when
available, as well as predicted Staffing Level.
6.3 Critical Fire Danger
Critical fire danger events such as thermal pressure troughs, offshore flow/east winds, and dry
cold front winds will be typically captured by National Weather Service meteorologists in red
flag warnings or fire weather watches. Warm, dry, unstable conditions can exacerbate fire
danger conditions in Western Washington and cause active fire behavior during times when
fuels are not critically dry. The moss and lichen component within timber fuels contributes
greatly to this effect.
Poor nighttime humidity recoveries below approximately 60 percent combined with more than
14 days without wetting rain and temperatures above 72 degrees is generally a threshold for
increased fire activity. Effects of prolonged periods of poor humidity recovery on heavy fuels
can persist for one to two days after onshore flow returns.
24For more information see the publication Critical Weather Patterns of the United States as well
as other weather conditions can be found on the NWCC website here. Information on past large
fire growth days can be found in the Appendix F.
6.4 Season Ending Event
The NWCC conducted a season ending event analysis by predictive services area which can be
found on their fire analysis page. Experience has shown locally that season ending analysis
conducted in the traditional manner for individual fires or by FDRA come within a week or so
either side of the NWCC analysis.
6.5 Fire Danger Pocket Cards/Seasonal Risk Analysis
The fire danger pocket card is a tool which can aid fire suppression personnel to interpret
NFDRS outputs and understand local fire danger thresholds for a local area. Pocket cards can
relate current NFDRS outputs with the historical average and worst‐case values in a specific
geographic location. Visiting resources can use the pocket card to familiarize themselves with
local fire danger conditions. The pocket cards meet NWCG guidelines and are posted on the
NWCG website. Seasonal risk analysis (pocket cards with updated daily values) will be linked on
the dispatch center websites. For 2020, pocket cards will reflect the original NFDRS model, not
the NFDRS 2016 model.
6.6 Weather Station Maintenance
Each agency is responsible for the annual maintenance and calibration of their RAWS used in
this plan. Specifics regarding NWCG weather station standards and guidelines can be found in
PMS 426-3 here.
25Appendices
Appendix A: Primary Distribution List
This list indicates key personnel associated with this plan at this time.
Washington State Department of Natural Resources
DNR Northwest Region Dispatch and Fire Managers
DNR Olympic Region Dispatch and Fire Managers
DNR South Puget Sound Region Dispatch and Fire Managers
DNR Pacific Cascade Region Dispatch and Fire Managers
Coordination Centers
Puget Sound Interagency Coordination Center
Columbia Cascade Interagency Coordination Center
National Park Service
North Cascades National Park FMO
Olympic National Park FMO
Mt. Rainier National Park FMO
Forest Service
Mount Baker Snoqualmie National Forest FMO
Olympic National Forest FMO
Gifford Pinchot National Forest FMO
26Appendix B: Fire Danger Rating Area Analysis – Western Washington FDOP
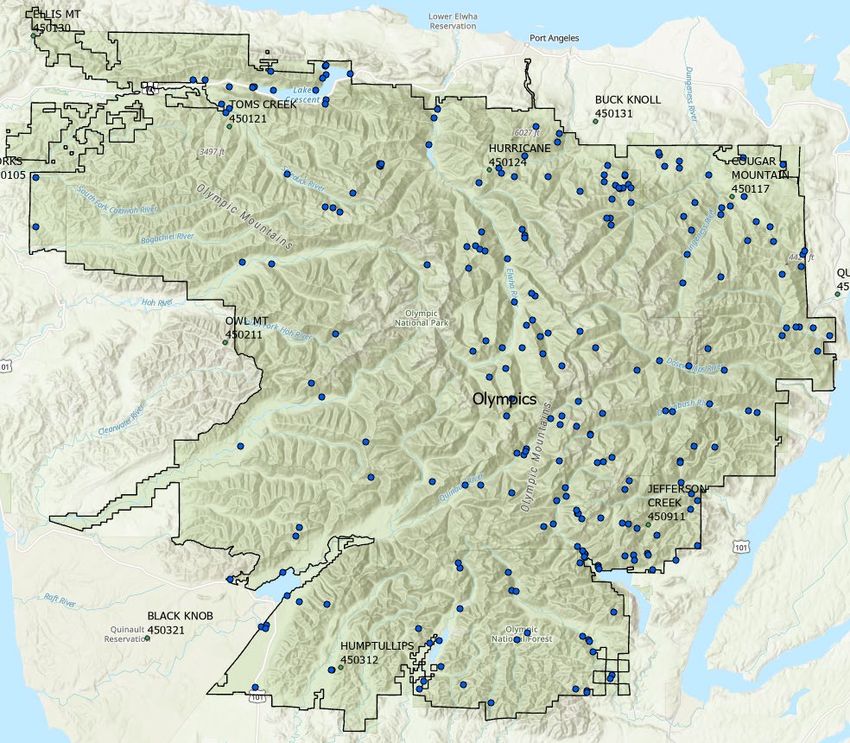
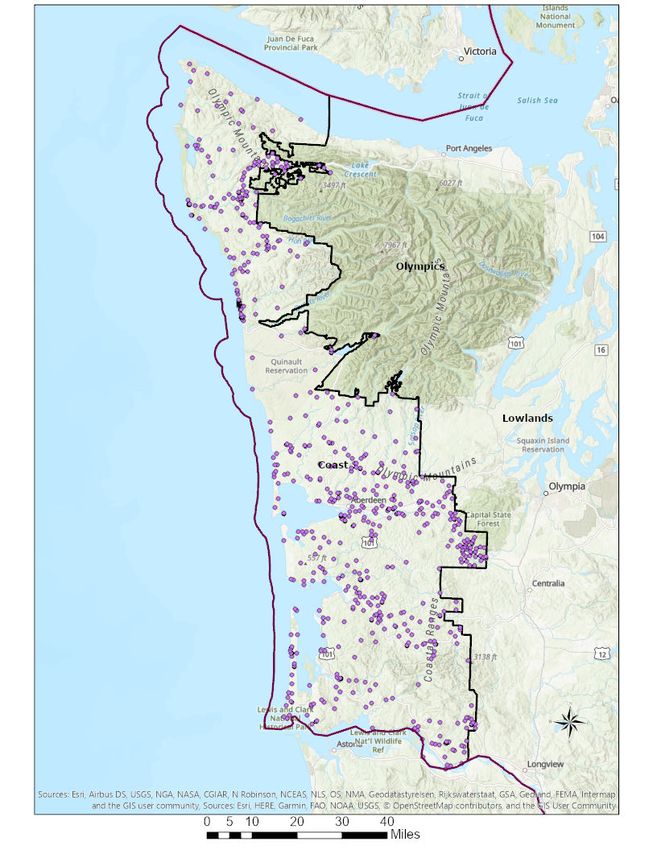
B-1: Olympic FDRA Analysis
Olympics
Figure B1.1: Overview map of Olympics FDRA.
General Location: This area includes the Olympic Mountains on the Olympic Peninsula.
Vegetation: Primarily Timber with understory.
Climate: Annual precipitation ranges from 70 to 100 inches over the lower western slopes of
the Olympics to 150 inches or more along the windward slopes of the mountains. A significant
rain shadow causes a dramatic decrease in precipitation on the east side of the Olympics with
as little as 15-18 inches rain in some areas.
27Topography: Terrain is extremely steep and rugged in the Olympics. Elevation varies from approximately 1,000 feet in the lower river
valleys to 7500’ in the higher peaks of the Olympics.
Figure B1.2: Fire Summary Graph for analysis months and years for Olympics FDRA Figure B1.3. Map of fires used for Olympics analysis
Table B1.1: Select fire summary graph data for Cascade FDRA.
Fire Cause Classes Fires By Month Lightning vs Human Fire Size Percentiles
1 Lightning Month Lightning Human Percentile Acres
2 Equipment June (15th) 4 17 100 2300
3 Smoking July 36 46 99 1100
4 Campfire August 63 75 98 805
5 Debris Sept 6 26 97 653
6 Railroad 96 443
7 Arson 95 368
8 Children 90 3
9 Misc 80 0.2
28Season and Size determination
Table B1.2: Season, large fire size in acres, and multiple fire day used in analysis for Olympic FDRA.
Season Large Fire Multiple Fire Day
June 15th-Sept 30th 3 acres 3 fires
Fire Danger Decision Analysis
Table B1.3: The season, large fire, and multiple fire day as defined in the fire problem analysis for Cascade FDRA and the number of qualifying weather days, fire
days, large fire days, and multiple fire days used in correlation analysis for Olympic FDRA.
Season Large Fire Multiple Fire Day Number of fire Weather days Number of Fire Days Number of Large Fires Number of Multiple Fire Days
June 15th-Sept 30th 3 acres 3 fires 1296 344 41 21
SIG Catalog
Table B1.4: Final SIG station parameters as determined through correlation analysis for Olympic FDRA.
Station ID Name Analysis Analysis Time of Year NFDRS Fuel Model Slope Class Avg Precip Initial KBDI Max Herb Annual Station Weight
Years SC
450117 Cougar 2008-2019 June 15th-Sept 30th Y 4 50 100 5 N 1
450121 Tom Creek 2008-2019 June 15th-Sept 30th Y 4 100 100 5 N 1
450124 Hurricane 2008-2019 June 15th-Sept 30th Y 4 74 100 5 N 1
450911 Jefferson 2008-2019 June 15th-Sept 30th Y 4 90 100 5 N 1
29Correlation Analysis Table
Table B1.5: Correlation values for Olympic FDRA.
MFD P-Range
LFD P-Range
FD P-Range
SIG/Station
MFD Chi^2
MFD P-Val
LFD Chi^2
LFD P-Val
MFD R^2
FD Chi^2
Greenup
FD P-Val
Variable
LFD R^2
FD Type
FD R^2
Freeze
Model
MFD
LFD
450117 ERC Y4P4 13- 31- All 0.69 13.21 0.1047 0.06 - 0.32 3 0.45 6.19 0.6264 0.04 - 0.29 3 0.57 2.63 0.9552 0.02 - 0.19
Jun Dec (C) (C)
450121 ERC Y4P4 15- 31- All 0.61 13.04 0.1106 0.07 - 0.31 3 0.53 5.57 0.6952 0.03 - 0.36 3 0.27 13.48 0.0964 0.02 - 0.23
May Dec (C) (C)
450124 ERC Y4P3 17- 31- All 0.87 4.76 0.783 0.05 - 0.36 3 0.25 11.04 0.1992 0.04 - 0.32 3 0.2 7.32 0.503 0.02 - 0.21
Jul Dec (C) (C)
450911 ERC Y4P4 13- 31- All 0.74 11.4 0.18 0.06 - 0.39 3 0.59 3.22 0.9196 0.04 - 0.33 3 0.12 14.42 0.0714 0.03 - 0.19
Jun Dec (C) (C)
SIG - ERC Y4 13- 31- All 0.75 11.02 0.2004 0.05 - 0.36 3 0.5 6.48 0.5935 0.04 - 0.34 3 0.34 5.55 0.6971 0.02 - 0.22
CTHJ Jun Dec (C) (C)
30Decision Points
Figure B1.3: ERC-Y Breakpoints for Olympic FDRA
Table B1.6: For each ERC bin as Class. Number of weather days or All Days (AD) expressed as the number of days in the analysis period and proportion of the
analysis period. Number of fire days (FD) is the proportion of fire days, and proportion of all days within the given class with a fire day. Number of large fire
days (LFD) is the proportion of fire days with a large fire, and the proportion of all days within the given class with a large fire. Number of days with multiple
fires (MFD) is the proportion of multiple fire days, and the proportion of all days within the given class with multiple fire days.
Class ERC All Days (AD) Fire Days (FD) Large Fire Days (LFD) Multiple Fire Days (MFD)
Range # AD % AD # FD % FD % AD # LFD % LFD % FD % AD # MFD % MFD % FD % AD
1 0-9 181 14 10 6 6 0 0 0 0 0 0 0 0
2 10-20 379 29 39 22 10 3 13 8 1 2 14 5 1
3 21-31 430 33 67 37 16 9 38 13 2 4 29 6 1
4 32-42 241 19 43 24 18 6 25 14 2 6 43 14 2
5 42-53 65 5 22 12 34 6 25 27 3 2 14 9 3
31Fire Danger Rating Area Analysis – Western Washington FDOP
B-2: Lowlands FDRA Analysis
Description
General Location: The Puget Sound lowlands extending from the Canadian border to the Columbia River
between the coastal hills and the Cascade foothills. It includes the San Juan Islands and the lower
elevations of the eastern half of the Olympic Peninsula.
Vegetation: Timber Grass and Brush.
Climate: This is the warmest, driest, and most densely populated region of western Washington. In the
rain shadow of the Olympics, from Port Angeles to Mt Vernon, and including the San Juan Islands the
annual precipitation ranges from 18 to 30 inches. Average summertime highs range from 65° F near the
water, to 75° F inland. For the rest of the Lowlands FDRA from Mt Vernon and Quilcene, south to the
Columbia River, annual precipitation ranges from 32 to 45 inches of precipitation with average
summertime highs from 73° to 78° F.
Topography: The majority of the FDRA is made up of gently rolling terrain below 800ft MSL, with a few
mountainous sections along the Cascade foothills that reach up to 3,800ft MSL.
Figure B2.1: Overview map of Lowlands FDRA.
32Fire Danger Problem Analysis
Figure B2.2: Fire Summary Graph for analysis months and years for Lowlands FDRA Figure B2.3: Map of fires used for Lowlands analysis
Table B2.1: Select fire summary graph data for Lowlands FDRA.
Fire Cause Classes Fires By Month Lightning vs Human Fire Size Percentiles
1 Lightning Month Lightning Human Percentile Acres
2 Equipment 100 2018
3 Smoking May 3 285 99 21.7
4 Campfire June 10 471 98 11
5 Debris July 25 1422 97 6.9
6 Railroad August 52 1176 95 3.3
7 Arson Sept 19 637 90 1
8 Children 80 0.3
9 Misc 70 0.2
33Season and Size Determination
Table B2.2: Season, large fire size in acres, and multiple fire day used in analysis for Lowlands FDRA.
Season Large Fire Multiple Fire Day
May 1 – Sept 30th
st
6 3
Fire Danger Decision Analysis
Table B2.3: The season, large fire, and multiple fire day as defined in the fire problem analysis for Lowlands FDRA and the number of qualifying weather days,
fire days, large fire days, and multiple fire days used in correlation analysis for Lowlands FDRA.
Season Large Fire Multi Fire Day Number of Weather Days Number of Fire Days Number of Large Fire Days Number of Multi Fire
Days
May 1-Sept 30 6 acres 3 or more fires 1806 1260 104 647
Sig Catalog
TableB2.4: Final SIG station parameters as determined through correlation analysis for Lowlands FDRA.
Station ID Name Analysis Years Season NFDRS Fuel Model Slope Class Average Precip Max SC Station Weight
450207 Quilcene 2008-2019 May 1 – Sept 30 Y 3 45 5 1
451207 Castle Rock 2008-2019 May 1 – Sept 30 Y 2 45 5 1
451507 Sedro Woolley 2008-2019 May 1 – Sept 30 Y 2 47 5 1
451702 Enumclaw 2008-2019 May 1 – Sept 30 Y 2 49 5 1
451103 Chehalis 2008-2019 May 1 – Sept 30 Y 2 46 5 1
34Correlation Analysis Table
Table B2.5: Correlation values for Lowlands FDRA. Conditional probability analysis was used in the Correlation table, but not for ERC breakpoints for Staffing
and Adjective Ratings.
SIG/Station#
P-
MFD P-Val
LFD P-Val
P-Val
MFD Chi^2
P-
P-
LFD Chi^2
FD Chi^2
MFD R^2
Greenup
LFD R^2
FD Type
Variable
FD R^2
Freeze
Range
Range
Range
Model
MFD
LFD
MFD
LFD
FD
FD
SIG - 31- 0.06 - 6 0.00 - 3 0.04 -
Lowlands ERC Y3 16-May Dec All 0.98 14.28 0.0747 1.00 (C) 0.94 5.56 0.6967 0.50 (C) 0.96 9.58 0.2956 0.94
31- 0.06 - 0.00 - 0.00 -
450207 ERC Y3P3 16-May Dec All 0.97 7.28 0.5066 0.85 5 0.85 5.65 0.6866 0.27 5 0.54 2.31 0.3147 0.02
31- 0.06 - 5 0.00 - 5 0.00 -
451103 ERC Y2P3 15-May Dec All 0.95 27.26 0.0006 0.99 (C) 0.87 11.95 0.1533 0.54 (C) 0.98 3.12 0.9266 0.85
31- 0.06 - 5 0.00 - 5 0.00 -
451207 ERC Y2P3 16-May Dec All 0.94 34.23 0 0.99 (C) 0.94 5.95 0.6523 0.57 (C) 0.99 2.35 0.9684 0.85
31- 0.23 - 5 0.01 - 5 0.02 -
451507 ERC Y2P3 18-May Dec All 0.92 19.64 0.0118 0.97 (C) 0.9 5.59 0.6929 0.40 (C) 0.89 14.74 0.0643 0.71
31- 0.04 - 0.00 - 0.00 -
451702 ERC Y2P3 20-May Dec All 0.97 4.36 0.8236 0.76 5 0.45 8.03 0.2357 0.06 3 0.69 10.44 0.2352 0.21
SIG - 31- 0.10 - 6 0.00 - 3 0.11 -
Lowlands FM10 Y3 16-May Dec All 0.98 5.06 0.7511 0.94 (C) 0.94 3.28 0.9152 0.40 (C) 0.94 5.16 0.7408 0.79
31- 0.09 - 0.00 - 0.00 -
450207 FM10 Y3P3 16-May Dec All 0.94 4.54 0.8055 0.64 5 0.67 5.37 0.7174 0.16 5 0.12 2.26 0.3226 0.01
31- 0.13 - 5 0.00 - 5 0.00 -
451103 FM10 Y2P3 15-May Dec All 0.97 7.25 0.5095 0.93 (C) 0.78 16.7 0.0334 0.43 (C) 0.96 3.68 0.8845 0.64
31- 0.15 - 5 0.00 - 5 0.01 -
451207 FM10 Y2P3 16-May Dec All 0.95 11.25 0.1878 0.93 (C) 0.65 22.81 0.0036 0.38 (C) 0.91 6.22 0.6227 0.56
31- 0.35 - 5 0.01 - 5 0.04 -
451507 FM10 Y2P3 18-May Dec All 0.89 9.34 0.3143 0.89 (C) 0.75 7.8 0.4537 0.31 (C) 0.72 15.34 0.0528 0.55
31- 0.05 - 0.00 - 0.00 -
451702 FM10 Y2P3 20-May Dec All 0.78 16.54 0.0353 0.46 5 0.62 2.84 0.5847 0.04 3 0.48 6.21 0.5158 0.06
35You can also read