Westfield Stratford City The Inheritance before the Games - Volterra Consulting July 2011
←
→
Page content transcription
If your browser does not render page correctly, please read the page content below
Westfield Stratford City

            The Inheritance before the Games

                                Volterra Consulting
                                          July 2011

July 2011                                Page 1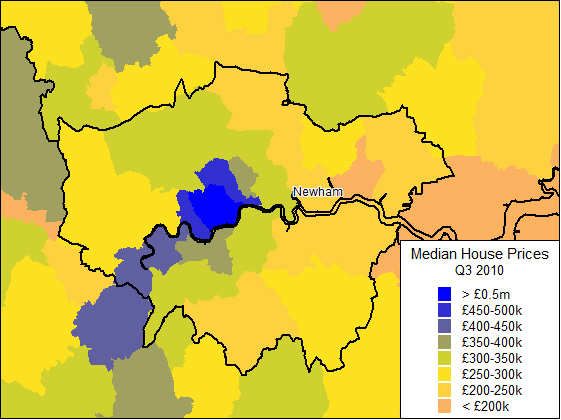
Westfield Stratford City: The Inheritance before the Games
Summary of impacts

   •   Volterra is an economic consultancy that specialises in estimating the economic impacts of
       large and often unusual schemes. This study considers the economic impact of Westfield’s
       Stratford City development.

   •   Stratford City is a mixed use development in Newham, East London which is being
       developed by Westfield. It will include retail and leisure space, several hotels and a
       significant commercial district, along with housing and community facilities. Construction
       began in 2007 and the whole project is planned for completion in 2020.

   •   The public sector investment in infrastructure underpinning the Olympic Games enabled
       Westfield to bring forward their development of Stratford City around 5-7 years earlier than
       would otherwise have occurred.

   •   We estimate that bringing forward the benefits of this significant scheme by 5-7 years is
       worth £1.1-£2.2 billion to the London economy. Evaluating this against the level of public
       sector investment generates a Benefit Cost Ratio (BCR) of 1.9 to 3.6 which represents
       extremely good value for money on the public sector investment.

   •   We estimate that Zone 1 of Stratford City will create the equivalent of over 15,000
       permanent jobs, 10,000 in Phase 1 and a further 5,460 in Phase 2. Once part time working is
       taking into consideration, this results in a headcount of almost 20,000, up to 14,100 in Phase
       1 and 5,700 in Phase 2.

   •   The total estimated value of this employment to the London economy is £4.3-£5.6 billion for
       Phase 1 and £3.0-£4.5 billion for Phase 2, generating taxation revenues to central
       government of up to £140m per annum by 2020.

   •   Furthermore, the construction of Phase 1 has already employed a temporary workforce of
       over 20,000, and we estimate that this will have risen to up to 27,000 by the time
       construction is completed in September 2011, with a maximum number of contractors on
       site of around 4,000. We estimate that the construction of Phase 2 will employ a further
       workforce of around 13,000.

   •   Alongside other investments in the area, we believe that Stratford City will create the step
       change in image and perception that Newham has been striving for.

               July 2011                                                                      Page 2
Introduction

    •    Volterra has been commissioned by Westfield to consider the economic benefits which will
         be created by Stratford City. Stratford City is a mixed use development in Newham, East
         London, which is being developed by Westfield. The whole mixed use scheme will include
         retail and leisure space, two hotels and a significant commercial district, along with housing
         and community facilities. Construction began in 2007 and the whole project is planned for
         completion in 2020. The retail element of Stratford City is due to open in September 2011.
         Comprising 1.9 million square feet of retail and leisure space, it will be the largest urban
         shopping centre in Europe1.

    •    In order to estimate the economic benefits of the development, we have had to make a
         variety of assumptions. Throughout this study we set out clearly what all of these
         assumptions are and wherever judgment has been required, we have deliberately been
         conservative. As a result we are satisfied that the figures set out in this study represent a
         robust and reliable set of estimates of the economic impact of the Stratford City.

    •    This study concentrates on Zone 1 of the Stratford City development. The Zone 1
         development is separated into two phases. Phase 1 will open in September 2011 and
         comprises mainly of the retail development along with some leisure and other uses. Phase 2
         is planned to be fully completed by 2020, and comprises a significant amount of commercial
         space, as well as some further leisure.

    •    The development at Stratford City has been made possible by the infrastructure investments
         underpinning the Olympic Games in 2012. We estimate that the cost of this to the UK
         taxpayer is of the order of £500-£600 million2. In addition to this, the private sector
         investment from Westfield has been around £1.43bn for the retail elements of Phase 1, plus
         subsequent further investments of around £180m associated with the hotels and office
         elements in Phase 1. An estimated further £600 million will be spent by Westfield on
         developing Phase 2.

Construction

    •    We estimate that by September 2011 a temporary workforce of around 25,000-27,000 will
         have been required during the construction of Phase 1 of Westfield Stratford City, of which
         almost 20,000 have already been created.

    •    This workforce has been made up of a combination of types of workers, some of whom will
         have been on site to deliver very specific parts of the construction and may have been
         employed for only a week or two, and others will have been employed for several months or
         longer. The maximum likely number of contractors on site at any one time is estimated to
         be around 4,000.

 http://uk.westfield.com/stratfordcity/news/press-toolkit/
1

 This is based on historical estimates of both infrastructure items required to deliver the site and Section 106
2

obligations across Zones 1 to 7 of the Stratford City outline planning permission.

                  July 2011                                                                                Page 3
•   Latest monitoring data shows that around 9 per cent of these jobs are workers living in the
        London Borough of Newham, or 28 per cent are workers living in the wider East London
        area.

    •   Based on estimates of the average length of contracts for construction and fit-out workers3,
        this total workforce is equivalent to around 10,400-10,900 ‘job years’ and generates total
        construction earnings of £370-£390 million.

    •   Construction earnings in Newham alone will be £35-37 million, and in wider East London will
        be £105-110 million4.

    •   Furthermore, we estimate that the construction of Phase 2 will require a further
        construction workforce 13,000-13,700, equivalent to around 5,300-5,600 job years.

    •   The workforce for Phase 2 would generate total construction earnings of £190-£200 million,
        of which an estimated £17.5-£18.5 million would be for workers living in Newham, and
        £53.5-£56 million in the wider East London area.

Operational impacts

    •   We estimate that Phase 1 of the Westfield Stratford City development will create the
        equivalent of 10,000 permanent jobs through its retail, leisure and commercial occupiers
        once fully operational from September 2011 onwards, of which Westfield are aiming to
        secure at least 2,000 will be for the local unemployed.

    •   In reality a significant number of positions in retail and leisure are taken by part time
        employees. We estimate that the actual headcount of employment created in Phase 1 of
        Westfield Stratford City will be up to 14,100, allowing for both full and part time workers.

    •   The employment created in Phase 1 of Stratford City will generate £165-£215 million in
        annual earnings from 2011 onwards, contributing £38-£59m per annum in tax revenues for
        central government5.

    •   Evaluating the benefits over a 60 year horizon, the Net Present Value (NPV) of the jobs
        created in Phase 1 represents a contribution of £4.3-£5.6 billion to the London economy6.

    •   We estimate that a further 5,460 permanent jobs will be created by the leisure and
        commercial occupiers of Phase 2 once it is fully operational in 2020. Allowing for part time
        workers, we estimate that the actual headcount of employment created in Phase 2 of
        Westfield Stratford City will be up to 5,700.

  Based on Westfield’s experience we estimate that the average length of contract for a construction worker is
3

6 months, and 3 months for a fit-out contractor.
  Assuming the proportion of workers who are resident in Newham and East London stays constant for the rest
4

for the construction period and is representative across worker contract lengths.
  Ranges depend upon the assumptions made about earnings and part time workers – see section 3.1 for
5

further detail
6
  It is standard to evaluate transport proposals over a 60 year horizon. The NPV has been evaluated using a
3.5% discount rate, in line with the Treasury Green Book

                 July 2011                                                                             Page 4
•   The additional employment created in Phase 2 will generate a further £140-£220 million per
        annum to the economy from 2020 onwards, contributing £48-£81m each year in tax
        revenues and giving a net present value of £3.0-£4.5 billion to the UK economy7.

    •   Combining these estimates of the benefits of Phase 1 and Phase 2 together, this results in a
        total benefit to the London economy of the whole of Zone 1 of the Stratford City
        development of £7.2-10.1bn, through the delivery of over 15,000 full time equivalent jobs,
        or a workforce of up to 20,000.

    •   In order to make this happen, Westfield has invested £1.43bn for the retail elements of
        Phase 1, plus subsequent further investments of around £180m associated with the hotels
        and office elements in Phase 1, and will invest an estimated further £600 million in Phase 2 –
        providing a total private sector investment of £2.2bn. Alongside this, the public sector
        infrastructure investments associated with the Olympic Games of circa £500-£600m have
        enabled this site to be brought forward at this time for development. Based on the benefits
        estimated, this results in a benefit cost ratio (BCR) of the whole of Zone 1 of Stratford City of
        2.6-3.6 which represents very good value for money.

    •   Finally we consider the additional value that the public sector investment has enabled.
        Westfield estimates that the public sector infrastructure investments have enabled them to
        bring forward this development around 5-7 years earlier than would otherwise have
        occurred. This means that these jobs and economic activity are being delivered 5-7 years
        earlier than would otherwise have been the case without the public sector investment. We
        can put a value on delivering these benefits earlier, and we estimate that bringing forward
        the benefits by 5 years is worth £1.1-£1.6 billion to the London economy. Evaluating this
        against the public sector spend of £0.6bn, would generate a BCR of 1.9 to 2.7 which
        represents very good value for money on the public sector investment.

    •   Were these jobs to have been delayed by 7 years, rather than 5 years, the value of these
        benefits would be worth an additional £1.5-£2.2bn to the London economy, generating a
        BCR on the public investment of 2.6 to 3.6 which represents extremely good value for
        money.

7
 The 60yr NPV is based on half of Phase 2 being operational from 2015, and the remainder from 2020 – see
section 3.2 for further detail

                 July 2011                                                                          Page 5
Summary of impacts
Construction (temporary) Phase 1 Phase 2 Zone 1 total
Workforce 25,000-27,000 13,000-13,700 38,000-40,700
‘Job years’ 10,400-10,900 5,300-5,600 15,700-16,500
Value to London Economy £370-390m £190-200m £560-590m
Earnings of Newham residents £35-37m £17.5-18.5m £52.5-55.5m
Earnings of East London residents £105-110m £53.5-56m £158.5-166m
Operational (permanent) Phase 1 Phase 2 Zone 1 total
Jobs (FTE) 10,060 5,460 15,520
Jobs (workforce) up to 14,100 up to 5,700 up to 19,800
Annual earnings £165-215m £140-220m £305-435m
Annual tax revenues £38-59m £48-81m £86-139m
Value to London Economy (60 year NPV) £4.2-5.6bn £3.0-4.5bn £7.2-10.1bn
Investment by Westfield £1.43bn+£180m £600m £2.2bn
Public sector investment £600m
Total Investment (private & public) £2.8bn
Benefit Cost Ratio (BCR) 2.6-3.6
Value of realising the scheme earlier Phase 1 Phase 2 Zone 1 total
Value of delivery of scheme from 2011 onwards £4.2-5.6bn £3.0-4.5bn £7.2-10.1bn
Value of 5yr advancement £1.1-1.6bn
BCR of 5yr advancement 1.9-2.7
Value of 7yr advancement £1.5-2.2bn
BCR of 7yr advancement 2.6-3.6
July 2011 Page 61 Introduction & Background
1. Volterra has been commissioned by Westfield to consider the economic benefits which will
be created by Stratford City. Stratford City is a mixed use development in Newham, East
London which is being developed by Westfield. The whole mixed use scheme will include
retail and leisure space, two hotels and a significant commercial district, along with housing
and community facilities. Construction began in 2007 and the whole project is planned for
completion in 2020. The retail element of Stratford City is due to open in September 2011.
Comprising 1.9 million square feet of retail and leisure space, it will be the largest urban
shopping centre in Europe8.
2. The site sits alongside the Olympic stadium and between Stratford International Station and
the Stratford Underground Station with the Olympic village on its fourth side. It is poised to
make a distinctive difference to this part of East London and will be an integral part of the
Olympic experience for visitors.
3. The site is located in a highly accessible location both by public transport and highways. It is
located at the interchange of several tube lines (Jubilee, Central), overland services, and the
DLR as well as the only UK international high speed rail line, High Speed One. Liverpool
Street and Canary Wharf are only ten minutes away and 4.1 million people can reach
Stratford within 45 minutes9.
4. Over the past twenty years a range of regeneration initiatives have been implemented in the
Stratford area. Despite this, problems of deprivation, unemployment and various social
problems still exist. It is the intention of the Stratford City development to provide the step
change required to help combat these issues.
5. The original Stratford City outline planning permission was masterplanned over seven zones
intended to be developed over twenty years or more. This document focuses on Zone 1 of
the Stratford City development, of which Westfield is the developer and operator. The Zone
1 development is separated into two phases – Phase 1 will open in September 2011 and
Phase 2 is planned to be fully open by 2020. Throughout this document we consider these
two phases of development and present the benefits of the scheme separately for each
phase as well as together for the whole of Zone 1. The table below summarises the
floorspace within Zone 1 that we use as the basis for our calculations.
8
http://uk.westfield.com/stratfordcity/news/press-toolkit/
9
http://uk.westfield.com/stratfordcity/news/press-toolkit/
July 2011 Page 7Table 1 Floorspace in Zone 1 of Stratford City
Zone One floorspace (sqm) Phase One Phase Two
Catering 11,719 -
Retail 150,412 -
Cinema 6,670 -
Casino 6,300 -
Other Leisure 2,030 20,000
Hotel 34,794 (600 rooms) -
Commercial 12,000 94,263
Total 223,925 114,263
6. The development at Stratford City has been made possible by the infrastructure investments
underpinning the Olympic Games in 2012. We estimate that the cost of this to the UK
taxpayer is of the order of £500-600 million. In addition to this, the private sector
investment from Westfield has been around £1.43bn for the retail elements of Phase 1, plus
subsequent further investments of around £180m associated with the hotels and office
elements in Phase 1. An estimated further £600 million will be spent by Westfield on
delivering Phase 2.
7. This report aims to investigate the impact on the Stratford, London and the UK economies of
this major investment. We focus primarily on the direct effects of the scheme. An
investment of this scale has the potential to make a step change to the economy and we
consider this dynamic impact.
July 2011 Page 82 Construction Impacts
2.1 Construction workforce to March 2011
8. Westfield’s employment records show that by the end March 2011 a total workforce of just
under 20,000 had been employed in the construction supply chain. This represents the total
workforce which has been involved in the construction of Westfield Stratford City over the
39 months since construction began in January 2008. This workforce has been made up of a
combination of types of workers, some of whom will have been on site to deliver very
specific parts of the construction and may have been employed for only a week or two, and
others will have been employed for several months or longer.
9. Westfield has been committed to providing as many of these opportunities to Newham
residents and previously workless people as possible. To achieve this, Westfield works in
partnership with Newham Workplace to secure as many of these jobs for local people as
possible. Westfield completes quarterly surveys which detail the total workforce along with
where the workers live. The table below shows the proportion of the workforce who have
been resident in Newham as well as the wider local East London area.
Table 2 Workforce employed in the construction of Stratford City up to March 2011
Workforce number Percentage of workforce
Total employed (Jan 08 – Mar 11) 19,939 100%
Resident in Newham 1,866 9%
Resident in Hackney, Tower Hamlets
1,416 7%
or Waltham Forest
Resident in remaining East London
2,354 12%
boroughs
Total Resident in the local East
5,636 28%
London area
Total employed Apprentices/trainees 160
Apprentices/trainees in Newham 43
Total employed Improvers 165
Improvers in Newham 66
10. The table above summarises the latest quarterly report (March 2011) which showed that the
total workforce employed to date was just under 20,000. Of these, 9 per cent are living in
Newham, a further 7 per cent are living in the neighbouring boroughs of Hackney, Tower
Hamlets and Waltham Forest and a further 12 per cent of the construction workforce live
July 2011 Page 9elsewhere in East London. This means a total of just under 30 per cent of the construction
workforce to date have been resident in East London.
11. A total of 160 apprentices and trainees have been employed on the project to date, with
over a quarter of these being resident in Newham. Apprentices and trainees are employed
people with little or no experience of undertaking any previous apprenticeship or any formal
technical qualifications.
12. There have been 165 employed ‘Improvers’, who are people who had some previous
experience but are now taking a recognised qualification on site. Of these 40 per cent are
living in Newham.
2.2 Construction workforce to September 2011
2.2.1 Workforce
13. As detailed previously, the construction of Stratford City to date has employed a workforce
of just under 20,000 people. We estimate that the construction of Phase 1 will create
between 25,000 and 27,000 construction jobs by the time it is completed in September
2011. This is an estimate of the total headcount of the workforce involved in constructing
the development, and will have been made up of a mixture of contract lengths.
14. This estimate is based on several of Westfield’s quarterly reporting schedules which show
that the number of new employees per month has increased significantly over the course of
the construction period. We believe this is a conservative estimate of the likely total
construction workforce. The tables below shows the calculations on which this is based.
Table 3 Workforce employed in the construction of Stratford City
January 2008 to... March 2011 December 2010 June 2010
Total workforce employed to date 19,939 15,517 10,507
Months of construction to date 39 36 30
Months of construction remaining 6 9 15
Workforce per month 511 431 350
Jobs per month from Jun-Dec 2010 835
Jobs per month from Dec ’10-Mar’11 1,474
July 2011 Page 10Table 4 Estimated workforce employed to September 2011
Scenario 1 Scenario 2 Scenario 3
Workforce to date 19,939 19,939 19,939
Estimated jobs per month Apr-Sept 2011 835 1,155 1,474
Total estimated workforce to Sept 2011 24,949 26,866 28,783
15. If the number of jobs created per month for the final 6 months of the construction period is
equal to the number that were created each month in the final half of 2010, then the total
construction workforce will be just under 25,000. If the number of jobs created per month is
higher than this, equal to the number of jobs created each month so far in 2011, then the
total construction workforce will be just under 29,000. If the number of jobs created each
month is halfway in between these two estimates, then the total construction workforce will
be 27,000.
16. Based on these estimates, and in order to be conservative, we therefore conclude that it is
likely that the total construction workforce employed in the construction of Phase 1 of
Stratford City by September 2011 is likely to be between 25,000 and 27,000.
2.2.2 Job years
17. In order to quantify the earnings of these construction workers, we must estimate how
many years of employment (or ‘job years’) this total workforce is equivalent to. The total
workforce will be made up of construction workers and fit-out workers. We estimate that
the majority of workers up until December 2010 will have been employed on construction;
between January 2011 and March 2011 the workforce will have been approximately evenly
split between construction and fit-out workers; and from March 2011 onwards the majority
of workers will be involved in fit-out and not construction work.
18. Based on Westfield’s experience, we estimate that the average length of contract for
construction workers is approximately 6 months, and the average length of contract for fit-
out workers is 3 months. In reality both of these will be averages across much wider ranges.
For example the fit out workers for John Lewis and Marks & Spencer, which equate to
around 40,000 sqm (just over a quarter) of the retail space, have been fitting out for around
12 months. The Vue cinema began fit out in January 2011, and the casino and Primark
began to fit out around March/April 2011. Finally, there will be several smaller units which
may only spend around a week or two on fit out.
19. Using the combination of these assumptions, we estimate that the workforce is equivalent
to between 10,400 and 10,900 ‘job years’. Our calculations to arrive at these estimates are
set out in the table below.
July 2011 Page 11Table 5 Estimated ‘job years’ to September 2011
Construction Fit-out Total
Workforce to Dec’10 13,965 (90%) 1,552 (10%) 15,517
Workforce Jan-Mar’11 2,211 (50%) 2,211 (50%) 4,422
Apr-Sept’11 Scenario One 501 (10%) 4,509 (90%) 5,010
workforce Scenario Two 693 (10%) 6,234 (90%) 6,927
Total Scenario One 16,677 8,272 24,949
workforce Scenario Two 16,869 9,997 26,866
Average contract length (months) 6 3 -
Scenario One 8,339 2,068 10,407
Job years
Scenario Two 8,435 2,499 10,934
2.2.3 Quantifying the value
20. In 2010 construction workers in London earned on average £35,65010. This means that the
total earnings of construction workers as a result of the development of Stratford City will
total £370-390 million, of which £320 million has already been earned by existing workers.
Of the total earned by September 2011 we estimate that £34.5-36.5 million will have been
earned by workers living in Newham or £105-110 million within East London more widely.
Table 6 Estimated construction earnings
Scenario One Scenario Two
London Earnings per construction worker £35,650 £35,650
Estimated job years to Sept 2011 10,407 10,934
Estimated job years to March 2011 9,029 9,029
Total Earnings through construction to Sept 2011 £371,015,200 £389,810,100
In Newham £34,721,600 £36,480,500
In East London £104,871,900 £110,184,500
Earnings through construction to March 2011 £321,895,700 £321,895,700
In Newham £30,124,700 £30,124,700
In East London £90,987,700 £90,987,700
10
Annual Survey of Hours and Earnings (ASHE), Table 5.7a. Full time median value quoted.
July 2011 Page 122.3 Construction workforce after September 2011
21. The total floorspace in Phase 1 of Zone 1 is 223,925sqm, and a further 114,263sqm will be
delivered in Phase 2. In order to estimate the construction workforce that will be required
to deliver Phase 2 of Zone 1, we assume that the workforce required is directly
proportionate to the amount of floorspace delivered. In discussions with Westfield we
believe this is an appropriate approximation. We therefore estimate that the construction
of Phase 2 will require a workforce of 13,000-13,700, equivalent to around 5,300-5,600 job
years. On the same basis as above, this would generate £190-200 million of earnings
through construction, of which around £17-19 million would be earned by workers living in
Newham and £53-56 million more widely by residents of East London11.
Table 7 Estimated construction workforce, job years and earnings for phase 2
Scenario One Scenario Two
Floorspace in Phase 1 223,925 223,935
Floorspace in Phase 2 114,263 114,263
Workforce for Phase 1 24,949 26,866
Job years for Phase 1 10,407 10,934
Workforce for Phase 2 13,048 13,709
Job years for Phase 2 5,310 5,579
Total Earnings through construction of Phase 2 £189,319,200 £198,909,752
In Newham £17,717,500 £18,615,100
In East London £53,513,400 £56,224,300
11
Assuming that the proportion of workers who are living in Newham and East London is the same for Phase 2
as the evidence to March 2011 for Phase 1 and is representative across worker contract lengths.
July 2011 Page 133 Operational Impacts
3.1 Operational employment impacts of Phase 1
3.1.1 Employment created
22. The construction of Phase 1 of Westfield Stratford City is planned to be completed later this
year. From its opening in September 2011, Westfield Stratford City will provide an
estimated 10,000 full time equivalent (FTE) jobs across the retail, leisure and commercial
sectors. We have estimated these job figures using floorspaces provided to us by Westfield
and standard English Partnerships assumptions about the density of employment across
different sectors.
23. For the casino, we have taken the actual estimated number of employees from the Aspers’
casino application as a standard density assumption does not exist for casinos and the
Aspers’ application figure is based on their actual business plan and therefore represents the
most accurate assumption to make.
24. In addition to the jobs created by elements of the scheme, Westfield will also create some
jobs themselves which are directly related to Stratford City. They have provided us with
their estimates of these, split between full time recruitment and contractors in positions
such as security and maintenance. The calculations of total job impacts on this basis are set
out in the table below.
Table 8 Estimated job creation in phase 1 in terms of full time equivalents
Employment Density
Phase 1 uses Floorspace (sqm) Estimated FTEs
(sqm per FTE)
Catering 11,719 13 901
Retail 150,412 20 7,521
Cinema 6,670 90 74
Casino 6,300 - 300
Other Leisure 2,030 40 51
3* 1 FTE per 2 rooms
Hotel 34,794 (600 rooms) 414
4-5*0.8 FTE per 1 room
Commercial 12,000 19 632
Total 9,893
Westfield employment
Recruitment 70
Contractors 100
Total (incl Westfield) 10,063
July 2011 Page 1425. The job impacts summarised above are full time equivalent positions. In reality a significant
number of positions in retail and leisure are taken by part time employees. Skillsmart
estimate that around half of retail employees are part time, and English Partnerships
guidance states that 2-2.5 part time (PT) jobs are equivalent to 1 full time (FT) position. We
have therefore translated our full time equivalent permanent job estimates into an estimate
of the actual headcount of employees, based upon these assumptions about part time
working. The calculations are set out in the table below. On this basis, we estimate that the
actual headcount of employment created in Phase 1 of Westfield Stratford City will be
between 13,200 and 14,100.
Table 9 Estimated headcount in phase 1
Scenario A (2PT=1FT) Scenario B(2.5PT=1FT)
Phase 1 use FTEs
FT PT Headcount FT PT Headcount
Catering 901 601 601 1,202 644 644 1,288
Retail 7,521 5,014 5,014 10,027 5,372 5,372 10,744
Cinema 74 49 49 99 53 53 106
Casino 300 200 200 400 214 214 429
Other Leisure 51 34 34 68 36 36 73
Hotel 414 276 276 552 296 296 591
Commercial 632 632 0 632 632 0 632
Westfield –
70 70 0 70 70 0 70
recruitment
Westfield –
100 67 67 133 71 71 143
contractors
Total 10,063 6,942 6,241 13,183 7,388 6,686 14,074
NB Totals may not sum due to rounding
3.1.2 Value of the employment created
26. In order to estimate the value of the employment created, we consider the average salaries
across the various sectors in which employment is created. Based on average London
salaries we estimate that the Phase 1 jobs will contribute £200-215 million12 per annum to
the economy from September 2011 onwards. If we evaluate the benefits to the London
12
Based on average earnings in 2010, in 2010 prices
July 2011 Page 15economy over a 60 year horizon13, and discount by 3.5 per cent14 per annum, the Phase 1
jobs generate £5.3-5.6 billion to the UK economy. Even if the earnings of the employees are
closer to the UK average, rather than the London average, we estimate that the employment
created in Phase 1 will generate at least £4.3 billion to the UK economy. The basis of these
estimates is set out in the tables below.
Table 10a Estimated value of the job creation in phase 1 – London earnings based
London
Scenario A jobs Scenario B jobs Total earnings (£m)
Sector earnings
FT PT FT PT FT PT Scen A Scen B
Catering 601 601 644 644 19,510 6,234 15.5 16.6
Retail 5,014 5,014 5,372 5,372 21,334 6,956 141.8 152.0
Cinema 49 49 53 53 23,465 8,315 1.6 1.7
Casino 200 200 214 214 24,992 8,652 6.7 7.2
Other
34 34 36 36 23,465 8,315 1.1 1.2
Leisure
Hotel 276 276 296 296 18,462 6,408 6.9 7.4
Commercial 632 0 632 0 41,688 13,450 26.3 26.3
Westfield –
70 0 70 0 41,688 13,450 2.9 2.9
recruitment
Westfield –
67 67 71 71 22,000 5,475 1.8 2.0
contractors
Total 6,942 6,241 7,388 6,686 £205m £217m
60 year
£5,285m £5,606m
NPV
NB Totals may not sum due to rounding
13
Standard for Public sector appraisals
14
Treasury Green Book discount rate
July 2011 Page 16Table 10b Estimated value of the job creation in phase 1 – UK earnings based
Scenario A jobs Scenario B jobs UK earnings Total earnings (£m)
Sector
FT PT FT PT FT PT Scen A Scen B
Catering 601 601 644 644 15,600 5,462 12.7 13.6
Retail 5,014 5,014 5,372 5,372 17,140 6,503 118.5 127.0
Cinema 49 49 53 53 19,503 4,150 1.2 1.3
Casino 200 200 214 214 18,606 7,925 5.3 5.7
Other
34 34 36 36
Leisure 19,503 4,150 0.8 0.9
Hotel 276 276 296 296 16,256 6,289 6.2 6.7
Commercial 632 0 632 0 27,406 9,406 17.3 17.3
Westfield –
70 0 70 0
recruitment 27,406 9,406 1.9 1.9
Westfield –
67 67 71 71
contractors 19,974 4,813 1.7 1.8
Total 6,942 6,241 7,388 6,686 £166m £176m
60 year
NPV £4,275m £4,545m
NB Totals may not sum due to rounding
27. Based on standard income tax and national insurance rates and allowing for both full and
part time workers, we estimate that the earnings of £165-215m from employment in Phase
1 will generate taxation revenues to central government of £38-59m. In addition to this,
there would be further indirect taxation revenues which would accrue to government
through VAT and other indirect taxes.
28. Typically wages rise faster than inflation. In keeping with our intention to be conservative
within our analysis, we have not allowed for any productivity improvements in our
calculations. Were we to include a productivity increase of 2% per annum within our
calculations (which is the figure typically used in transport appraisals), this would increase
the NPV of the benefits of Phase 1 from £4.3-£5.6bn to £6.7-£8.7bn.
29. The analysis set out in this study only values the earnings associated with the employment
created as a result of the Stratford City development, it does not value the profits earned by
July 2011 Page 17the companies which employ those workers. This is a further element of conservatism
contained within our analysis.
3.2 Operational employment impacts of Phase 2
3.2.1 Employment created
30. Phase 2 of Westfield Stratford City is estimated to be completed around 2020. Westfield
estimate that around half of Phase 2 will be occupied from 2015 onwards and the rest will
be occupied by 2020. Once fully occupied, we estimate that it will provide an additional
5,460 full time equivalent positions in the leisure and commercial sectors. We have
estimated these job figures on the same basis as for Phase 1 and the calculations are set out
in the table below.
Table 11 Estimated job creation in Phase 2 in terms of full time equivalents
Employment Density
Phase 2 uses Floorspace (sqm) Estimated FTEs
(sqm per FTE)
Leisure 20,000 40 500
Commercial 94,263 19 4,961
Total 5,461
31. The majority of commercial employment opportunities will be full time, but again, we
estimate that around half of the leisure workforce will be part time workers. The table
below therefore estimates the total headcount of positions created by Phase 2. We
estimate that the actual headcount of employment created in Phase 2 of Westfield Stratford
City will be between 5,600 and 5,700.
Table 12 Estimated headcount in phase 2
Scenario A (2PT=1FT) Scenario B(2.5PT=1FT)
Phase 1 use FTEs
FT PT Headcount FT PT Headcount
Leisure 500 333 333 667 357 357 714
Commercial 4,961 4,961 0 4,961 4,961 0 4,961
Total 5,461 5,295 3333 5,628 5,318 357 5,675
July 2011 Page 183.2.2 Value of the employment created
32. We estimate the value of this employment in the same way as for Phase 1. Based on
average London salaries we estimate that the Phase 2 jobs will contribute around £220
million per annum to the economy from 2020 onwards. If we evaluate the benefits to the
UK economy over a 60 year horizon , and discount by 3.5 per cent per annum, the Phase 2
jobs generate around £4.2-£4.5 billion to the UK economy. Even if the earnings of the
employees are closer to the UK average, rather than the London average, we estimate that
the employment created in Phase 2 will generate around £3.0 billion to the UK economy.
The basis of these estimates is set out in the tables below.
33. Again, based on standard income tax and national insurance rates and allowing for both full
and part time workers, we estimate that the earnings of £145-220m from employment in
Phase 2 will generate taxation revenues to central government of £48-81m.
34. As detailed previously, we have not included any productivity improvements in our analysis.
Were we to include a productivity increase of 2% per annum within our calculations, this
would increase the NPV of the benefits of Phase 2 from £3.0-£4.5bn to £5.8-£8.8bn.
Table 12 Estimated value of the job creation in phase 2
Scenario A jobs Scenario B jobs London earnings Total earnings (£m)
Sector
FT PT FT PT FT PT Scen A Scen B
Leisure 333 333 357 357 23,465 8,315 10.6 11.4
Commercial 4,961 0 4,961 0 41,688 13,450 206.8 206.8
Total 5,295 333 5,318 357 £217m £218m
60 year NPV £4,505m £4,520m
Scenario A jobs Scenario B jobs UK earnings Total earnings (£m)
Sector
FT PT FT PT FT PT Scen A Scen B
Leisure 333 333 357 357 19,503 4,150 7.9 8.4
Commercial 4,961 0 4,961 0 27,406 9,406 136.0 136.0
Total 5,295 333 5,318 357 £144m £144m
60 year NPV £2,980m £2,990m
July 2011 Page 193.3 Value for money of the Operational impacts
35. Westfield has invested £1.43bn in the retail elements of Phase 1, plus subsequent further
investments of around £180m associated with the hotels and office elements in Phase 1. An
estimated further £600 million will be spent by Westfield on developing Phase 2. The
development at Stratford City has been made possible by the infrastructure investments
underpinning the Olympic Games in 2012. We estimate that the cost of this to the UK
taxpayer is of the order of £500-600 million.
36. Based on the benefits estimated it the previous sections, this results in a benefit cost ratio
(BCR) of the whole of Zone 1 of Stratford City of 2.6-3.6. A BCR of greater than 2 is generally
considered to represent high value for money. By way of comparison, the latest case for
High Speed Rail, which was released by DfT in February 2011, states that High Speed Two,
the line to the West Midlands, will have a BCR of just over 2, which is also similar in
magnitude to the BCR for High Speed One.
37. Westfield estimates that the public sector investment has enabled the development to be
brought forward by around 5-7 years. We can value the benefit of bringing forward this
investment by considering our 60 year NPV starting from different years of operation.
38. As presented previously, we estimate that the 60 year NPV of the benefits is £4.3-£5.6bn for
Phase 1 and £3.0-£4.5bn for Phase 2, based on these parts of the development being fully
operational from 2011 and 2020 respectively.
39. Were these jobs to have been delayed by 5 years, these benefits would reduce to £3.6-4.7bn
and £2.5-3.8bn respectively. This means that the advancement of 5 years is worth an
additional £1.1-1.6bn to the UK economy. Based on an estimated public sector spend of
£600m, this generates a BCR of 1.9 to 2.7 which represents very good value for money on
the public sector investment.
40. Were these jobs to have been delayed by 7 years, the benefits would reduce to £3.3-4.4bn
and £2.3-3.6bn respectively. This means that an advancement of 7 years would be worth an
additional £1.5-2.2bn to the UK economy. Based on the estimated public sector spend of
£600m, this would generate a BCR of 2.6 to 3.6 which represents extremely good value for
money on the public sector investment.
3.4 Tackling worklessness in Newham
41. Of the 10,000 jobs created by Phase 1, Westfield’s ambition is that 2,000 will go to local
unemployed people. If the same proportion of the Phase 2 employment opportunities also
go to local unemployed people, this would be a further 1,090 people. This will help to
decrease the level of worklessness in the Borough.
42. At present Newham has one of the highest rates of unemployment and economic inactivity
in London and the UK. Latest data shows that approximately 12.4% of the working age
July 2011 Page 20population of Newham are unemployed. This compares to an average of 8% in London and
7% across the UK as a whole.
43. In Newham 32.5% of the working age population are economically inactive (compared to
25.2% of London and 23.6% of the UK) with 27.5% ‘not wanting a job’15. This suggests a
culture of worklessness in the Borough, a problem identified by the Department for Work
and Pensions (2009): “Evidence suggests that there are many reasons that residents cannot
engage with or do not want to engage with the formal labour market. Reasons include: low
levels of qualifications, lack of basic skills for life, lack of affordable/accessible childcare,
sickness and disability..., engrained culture of worklessness and opportunities presented by
the informal economy. 19.1% of 16-64 [year olds] have no qualifications ([the] London
average is 11.8%).”
44. This ‘culture of worklessness’ in Newham was the subject of a recent study by the Institute
of Employment Studies. This study highlighted the “crucial” role of effective employer
engagement in alleviating worklessness16:
“Employer engagement is fundamental to tackling worklessness and should be a matter of
priority. An attractive offer which has employer buy-in can provide access to more vacancies
and work placements for workless individuals.
There are very significant current and upcoming opportunities in the borough to move people
from worklessness into employment, including the Olympics and the new Westfield
development. It is critical that all is done to maximise the impact of these opportunities.
Given the time constraints around these it may make sense to target support here towards
those who are closer to the labour market.”
45. The commitment from Westfield Stratford City and its major retail anchors (John Lewis,
Waitrose, Marks and Spencers and Vue cinema) to guaranteed interview places for local
unemployed people living in Newham is an example of much needed effective employer
engagement.
46. Breaking the generational cycle of entrenched worklessness will help to lift Newham from its
current position as one of the most deprived areas in London and the UK. One way of
quantifying the impact of reducing worklessness is to estimate the reduction in local
authority welfare expenditure.
47. A recent study17 estimated that the direct financial benefit to national and local Government
of moving a jobseeker into work is £78.84 or £104.34 per week, depending on whether they
move to working 16 hours or 35 hours. If we assume that the 2,000 Phase 1 employees
work 35 hours per week, this represents an annual welfare saving of almost £11 million. If
the Phase 2 employment opportunities manage to attract the same proportion of
15
ONS annual population survey 2010
16
Institute of Employment Studies, 2010: ix/x
17
Counting the Cost – a Worklessness Costs Audit for London (2010)
July 2011 Page 21unemployed people into work, then this would represent a further saving of £6 million per
annum.
48. Evaluating the welfare savings over a 60 year horizon, the Net Present Value (NPV) of getting
these currently unemployed people into work represents a contribution of £0.4bn to the
London economy.
49. These calculations are likely to underestimate the beneficial impact of getting unemployed
people into work, as they only capture the direct benefits of reducing the cost of welfare
payments but do not capture the knock benefits such as reduced crime, better health and
education outcomes for the next generation, and so on, but nevertheless this gives us an
indication of the significant direct financial savings resulting from getting unemployed
people into work.
July 2011 Page 224 Residential impacts
50. Zone 1 of the Stratford City development will deliver 1,224 new homes. The housing
strategy specifies that this will be split between private sector, intermediate and social
housing in the proportions 65%, 25%, 9%, meaning that it will deliver almost 430 affordable
homes. The table below shows the split between different sized homes. The dominant unit
type is the one or two bedroom flat, reflecting demand in this area. However, around 15%
of both the market and social rented housing will also be 3 bedroom homes.
Table 13 Types of housing in Stratford City, Zone 1
Unit type Market Housing Intermediate Social rented
1 Bedroom 40% 43% 14%
2 Bedroom 47% 55% 71%
3 Bedroom 13% 2% 16%
% of housing in Zone 1 65% 25% 9%
51. Based on average household sizes for the Newham, the 1,224 homes will accommodate an
estimated 2,810 residents. The current population of Newham is estimated to be around
240,000. The Zone 1 housing will therefore increase the population of Newham by just over
1%.
52. Newham has challenging housing targets, with a minimum 10 year target of 25,000 new
homes, or annual monitoring targets of 2,500 per annum18. Zone 1 will therefore help to
achieve around 5% of the borough’s 2021 housing targets, or half of one year’s development
target, which represents a significant contribution.
53. If these new residents have demographics and an employment rate similar to those
currently existing in Newham, then 1,075 of the residents will be employed, earning on
average £32,600 per annum, and spending an estimated total of £4 million per annum in the
local economy.
54. If instead these new residents have demographics and an employment rate similar to the
London average, then 1,335 of them will be employed, earning on average £34,000 per
annum and spending an estimated total of £5 million per annum in the local economy.
18
London Plan Housing SPG Table 3.1
July 2011 Page 235 Transformational impacts
55. Over the past twenty years a range of regeneration initiatives have been implemented in the
Stratford area. Despite this, problems of deprivation, unemployment and various social
problems still exist.
56. Alongside other investments in the area, we believe the Stratford City development will help
to create the step change in image and perception that Newham has been striving for.
5.1 Deprivation in Newham
57. The English Indices of Multiple Deprivation measure relative levels of deprivation across the
country. They consider a variety of factors including income, employment, health,
education, housing & services, crime and living environment. The latest set of indices were
released in March 2011 and measure relative deprivation across the country in 2010. The
overall measure, by district, is shown in the map below. Newham is the 3rd most deprived
district in the country, after neighbouring Hackney which is 2nd and Liverpool which is the
most deprived.
Map 1 Deprivation in and around Newham, 2010
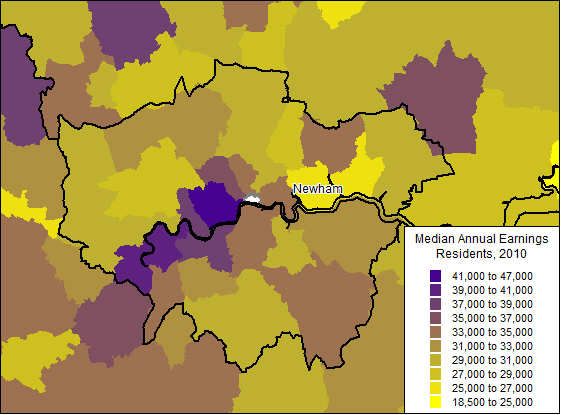
5.2 Prosperity in Newham
58. Newham has the second lowest level of residential earnings of all boroughs in London, after
neighbouring Barking & Dagenham. In contrast, the residents of other neighbouring
July 2011 Page 24boroughs in East London of Redbridge and Tower Hamlets earn over 25% more than
residents in Newham. Residents of the prime central boroughs earn over 70% more, and
residents of the prosperous West London boroughs earn around 40% more.
Map 2 Residential earnings in and around Newham, 2010
59. House prices are a good proxy for the prosperity of an area. Newham has some of the
lowest house prices in London, ranking 4th in terms of median house prices in 2010, after the
further eastern boroughs of Barking & Dagenham, Bexley and Havering. Average house
prices in parts of prime central London are more than treble the levels in Newham. Parts of
West London also have prices which are up to double those in Newham.
July 2011 Page 25Map 3 House prices in and around Newham, Q3 2010
5.3 What might a step change look like?
60. Previous work by Volterra evaluating the economic impact of High Speed One19 revealed
that, whilst house prices are complex, a simple model using just two factors – the proportion
of people who commute into London and the overall measure of deprivation in an area –
can provide a good estimation of house prices in an area. This model finds that, on average,
if commuting to London rises and deprivation falls, house prices increase.
61. In order to try to quantify the potential impact on prosperity in Newham as a result of the
investment in Stratford City, we consider what increase in house prices in Newham would be
predicted by our model if the overall deprivation measure in Newham were to fall.
62. Our model predicts an almost proportional relationship – if deprivation in Newham fell by 10
per cent, house prices would rise by 10 per cent; if deprivation in Newham fell by 20 per
cent, house prices would rise by 21 per cent; if deprivation in Newham fell by 30 per cent,
house prices would rise by 33 per cent; if deprivation in Newham fell by 40 per cent, house
prices would rise by 46 per cent, and so on.
63. These percentage changes in deprivation don’t mean much to the average reader so we now
put them in context. Newham currently has an Index of Multiple Deprivation (IMD) score of
41.8. The average IMD score across England is 19.2, the lowest is 4.5 and the highest is 43.4.
19
Economic Impact of High Speed One, January 2009. A report for London & Continental Railways, by Colin
Buchanan & Volterra Consulting
July 2011 Page 26A higher score indicates more deprivation. On this measure, Newham is the third most
deprived local authority in the country, after Liverpool and Hackney.
64. If deprivation in Newham fell by 10 per cent, this would represent deprivation comparable
to Birmingham or Middlesbrough, which are still in the most 5% of districts in the country; if
deprivation fell by 20 per cent, the closest London comparator borough would be Barking &
Dagenham; and if deprivation in Newham fell by 30 per cent, this would be comparable to
Southwark. If deprivation in Newham fell by 40 per cent, this would bring it in line with the
average rate across London.
65. These comparisons suggest that values in Newham have considerable scope for
improvement, if the borough is successfully lifted out of deprivation. If deprivation in
Newham fell by 20 per cent, bringing it halfway to the London average and comparable with
nearby Barking & Dagenham, we estimate that the total value of housing stock in Newham
would rise by £4.3 billion. If deprivation in Newham fell by 40 per cent, bringing it in line
with the average level of deprivation in London, we estimate that the total value of housing
stock in Newham would rise by £9.6 billion. These are very significant quantifiable impacts
which help to give an indication of the potential for wealth generation and improvements in
prosperity in this area if a step change in image and perception is achieved.
July 2011 Page 27You can also read


