Weyerhaeuser Investor Presentation - Late June 2021 - Weyerhaeuser Investor Relations
←
→
Page content transcription
If your browser does not render page correctly, please read the page content below

Weyerhaeuser
Investor Presentation

Late June 2021

FORWARD-LOOKING STATEMENTS AND NON-GAAP FINANCIAL MEASURES This presentation contains statements and depictions that constitute forward-looking statements within the meaning of the Private Securities Litigation Reform Act of 1995, as amended, including, without limitation, with respect to: future goals and prospects; business strategies; factors affecting market supply of lumber; key initiatives; levels of demand and market drivers for our products, including expected growth in U.S. housing demand and repair and remodel activity, as well as expected Western housing starts; market dynamics; HBU acres and our 2021 Adjusted EBITDA outlook and buyer demand for our Real Estate and Energy and Natural Resources business; our new cash dividend framework, base dividend sustainability, calculation and payment of supplemental cash dividends and return of cash as a percentage of Adjusted Funds Available for Distribution (Adjusted FAD); capital structure, credit ratings, future debt maturities and revolving line of credit capacity; our outlook for 2021 capital expenditures across the company; plans to upgrade and maximize the value of our timberland portfolio; our ambitions set forth in our “3 by 30” sustainability goals; 2021 operational excellence targets and creation of long-term shareholder value. Forward-looking statements can be identified by the fact that they do not relate strictly to historical or current facts and may be identified by our use of certain words in such statements, including without limitation words such as “anticipate,” “believe,” “committed,” “continue,” “continued,” “could,” “forecast,” “growing,” “estimate,” “outlook,” “goal,” “will,” “plan,” “expect,” “sustainable,” “maintain,” “target,” “would” and similar words and terms and phrases using such terms and words. Depictions or illustrations that constitute forward-looking statements may be identified by graphs, charts or other illustrations indicating expected or predicted occurrences of events, trends, conditions, performance or achievements at a future date or during future time periods. We may refer to assumptions, goals or targets, or we may reference expected performance through, or events to occur by or at, a future date, and such references may also constitute forward-looking statements. Forward-looking statements are based on our current expectations and assumptions. The realization of our expectations and the accuracy of our assumptions are subject to a number of risks and uncertainties that are difficult to predict and often are beyond the company’s control. These and other factors could cause one or more of our expectations to be unmet, one or more of our assumptions to be materially inaccurate or actual results to differ materially from those expressed or implied in our forward-looking statements, or all of the foregoing. Such uncertainties and other factors include, without limitation: the effect of general economic conditions, including employment rates, interest rate levels, housing starts, general availability of financing for home mortgages and the relative strength of the U.S. dollar; the effects of COVID-19 and other viral or disease outbreaks and their potential impacts on our business, results of operations, cash flows, financial condition and future prospects; market demand for the company's products, including market demand for our timberland properties with higher and better uses, which is related to, among other factors, the strength of the various U.S. business segments and U.S. and international economic conditions; changes in currency exchange rates, particularly the relative value of the U.S. dollar to the Japanese yen, the Chinese yuan, and the Canadian dollar, and the relative value of the euro to the yen; restrictions on international trade and tariffs imposed on imports or exports; the availability and cost of shipping and transportation; economic activity in Asia, especially Japan and China; performance of our manufacturing operations, including maintenance and capital requirements; potential disruptions in our manufacturing operations; the level of competition from domestic and foreign producers; our operational excellence initiatives; the successful and timely execution and integration of our strategic acquisitions, including our ability to realize expected benefits and synergies, and the successful and timely execution of our strategic divestitures, each of which is subject to a number of risks and conditions beyond our control including, but not limited to, timing and required regulatory approvals or the occurrence of any event, change or other circumstances that could give rise to a termination of any acquisition or divestiture transaction under the terms of the governing transaction agreements; raw material availability and prices; the effect of weather; changes in global or regional climate conditions and governmental response to such changes; the risk of loss from fires, floods, windstorms, hurricanes, pest infestation and other natural disasters, including the 2020 fire outbreaks in the Pacific Northwest; energy prices; transportation and labor availability and costs; federal tax policies; the effect of forestry, land use, environmental and other governmental regulations; legal proceedings; performance of pension fund investments and related derivatives; the effect of timing of employee retirements and changes in the market price of our common stock on charges for share-based compensation; the accuracy of our estimates of costs and expenses related to contingent liabilities and charges related to casualty losses; changes in accounting principles; and other risks and uncertainties identified in our 2020 Annual Report on Form 10-K, as well as those set forth from time to time in our other public statements, reports, registration statements, prospectuses, information statements and other filings with the SEC. It is not possible to predict or identify all risks and uncertainties that might affect the accuracy of our forward-looking statements and, consequently, our descriptions of such risks and uncertainties should not be considered exhaustive. There is no guarantee that any of the events anticipated by these forward-looking statements will occur, and if any of the events do occur, there is no guarantee what effect they will have on the company's business, results of operations, cash flows, financial condition and future prospects. Forward-looking statements speak only as of the date they are made, and we undertake no obligation to publicly update or revise any forward-looking statements. Nothing on our website is intended to be included or incorporated by reference into, or made a part of, this presentation. Also included in this presentation are certain non- GAAP financial measures, which management believes complement the financial information presented in accordance with U.S. GAAP. Management believes such non-GAAP measures may be useful to investors. Our non-GAAP financial measures may not be comparable to similarly named or captioned non-GAAP financial measures of other companies. A reconciliation of each presented non-GAAP measure to its most directly comparable GAAP measure is provided in the appendices to this presentation. 2

WEYERHAEUSER INVESTMENT THESIS

 DISCIPLINED SUPERIOR
 UNMATCHED
 PORTFOLIO + INDUSTRY-LEADING
 PERFORMANCE + CAPITAL
 ALLOCATION
 SHAREHOLDER
 VALUE

 ESG Strong ESG Foundation | Our Forests and Wood Products are Natural Climate Solutions

 3

POSITIONED FOR SUPERIOR LONG-TERM VALUE CREATION

 RECORD OPERATING STRONG NEW DIVIDEND
 PERFORMANCE BALANCE SHEET FRAMEWORK
 Highest Adjusted EBITDA Reduced debt by $1.1 billion Returning significant and appropriate
 Delivered $100 million of OpX in 2020 Favorable investment grade profile levels of cash to shareholders

 WY

 ENHANCING EXPANDED GROWING
 ESG LEADERSHIP LEADERSHIP TALENT MARKET DEMAND

 Launched new “3 By 30” initiatives Added Chief Development Officer role Wood-based construction
 Enhancing safety, diversity and inclusion Newly appointed CFO and natural climate solutions

 4
STRONG HOUSING SECTOR FUNDAMENTALS
Best U.S. Housing Backdrop in a Decade

✓ Renewed preference for single-family homes
✓ Ongoing work-from-home flexibility has encouraged
 migration from urban centers
✓ Demographic trends support growing Millennial
 homeownership
✓ Low mortgage rates
✓ Very limited existing re-sale inventory
✓ Aging housing stock
✓ Rising home equity

Weyerhaeuser is uniquely positioned to capitalize on U.S. housing strength and create value for shareholders
 5

UNMATCHED PORTFOLIO
Our Quality, Diversity and Scale Cannot Be Replicated

 6

WHO WE ARE
 A Tax-Efficient Timber REIT with Three Industry-Leading Businesses

 14
 MILLION
 TIMBERLANDS ACRES LICENSED
 IN CANADA
 We are the largest private
 timberland owner in North America

 35
 REAL ESTATE, ENERGY MANUFACTURING

 & NATURAL RESOURCES FACILITIES

 11
 ACROSS NORTH
 We deliver the most value from every acre AMERICA

 MILLION
 WOOD PRODUCTS ACRES OWNED
 We are a scale, low-cost IN THE U.S.
 wood products manufacturer

 19 Lumber Mills 3 Plywood / Veneer Mills
 6 Oriented Strand Board Mills 1 Medium Density Fiberboard Mill
Approximate total acres as of December 31, 2020.
 6 Engineered Lumber Mills 18 Distribution Centers (not shown) 7

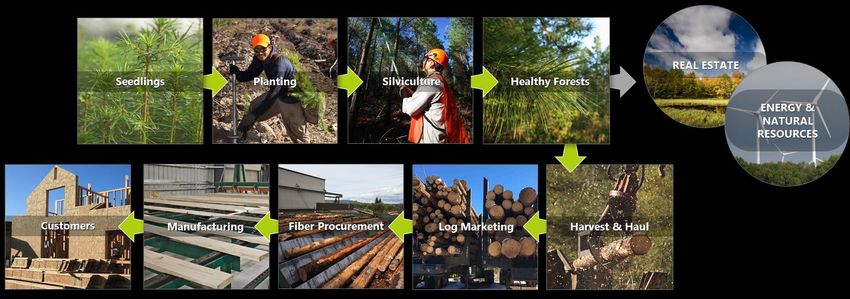
WHAT WE DO
Create and Capture Superior Value at Every Step

 Proprietary seedlings Customized planting Targeted silviculture Healthy forests
 yield superior growth, deploys the best genetic generates superior are diverse, productive,
 wood quality and survival material for each acre volume and value in and grown sustainably to
 characteristics on our land base each geography financial maturity Premium land sales
 capture every acre’s
 highest value

 Steady royalty
 and lease income
 maximizes the value of
 surface and
 subsurface assets

 Diverse customer mix Low-cost producer Optimal raw materials Delivered log model Superior efficiency
that fully values our quality, to ensure top margin are cost effectively captures maximum value and logistics capabilities
 scale, reliability and for lumber, panels and sourced internally and from each tree using for low-cost and
 sustainable practices engineered wood externally to maximize data-driven optimization reliable operations
 mill margins
 8
HOW WE DO IT ESG

Our Sustainability Strategy

 WEYERHAEUSER
 SUSTAINABILITY AMBITIONS
 ESG
 FOUNDATION

 Working to Solve
 3 BIG CHALLENGES BY 2030
 BUSINESS POSITIVE
 ALIGNMENT IMPACT CLIMATE HOMES COMMUNITIES

 Sustainability Is a Core Value
 Sustainability Is a Core Value
 For more information, see our full ESG Presentation, view our alignment with key ESG frameworks, and visit www.wy.com/sustainability.
 9

STRONG ESG FOUNDATION ESG

 Environmental Stewardship
 TIMBERLANDS MANUFACTURING
 WE PLANT WE HARVEST WE LEAVE OUR MILLS HAVE WE STORE WE REDUCED OUR
 ABOUT
 ONLY 2% TREE BUFFERS IMPROVED the equivalent of GREENHOUSE GAS

 150 of our forests each year
 ALONG WATERWAYS TO
 PROTECT AQUATIC
 ENERGY
 EFFICIENCY
 9 MILLION
 METRIC TONS
 EMISSIONS
 BY MORE THAN
 MILLION HABITAT
 TREES 16%
 IN THE LAST
 FIVE YEARS of CO2
 IN OUR
 EVERY YEAR WOOD PRODUCTS
 SINCE 2000
 EVERY YEAR

 100% That’s like taking
 2 MILLION
 WE MEET ABOUT

 70%
 OF OUR WE PARTICIPATE IN CARS

 100% 11
 ON AVERAGE
TIMBERLANDS WE USE
 OFF THE ROAD
 every year!
 OF OUR OWN
& WOOD FIBER
PROCUREMENT
 OF OUR
 HABITAT 95% ENERGY NEEDS
 IS CERTIFIED
 TIMBERLANDS
 ARE REFORESTED
 CONSERVATION OF EVERY 98% USING
 RENEWABLE
 TO THE AFTER HARVEST PLANS LOG OF OUR WASTE IS
 IN NORTH AMERICA BIOMASS
 REUSED OR
 RECYCLED
 Sustainable Forestry • Carbon Sequestration • Reduced Environmental Footprint 10
STRONG ESG FOUNDATION ESG

 Social Responsibility and Corporate Governance
 SAFETY HUMAN CAPITAL MANAGEMENT GOVERNANCE
 WE DRIVE SIGNIFICANT
 ETHISPHERE OUR
 SAFETY IMPROVEMENT
 90% OUR
 VOLUNTARY
 NAMED WY ONE OF THE GOVERNANCE
 PRACTICES
WE ARE AN
 10.00
 OF JOB OFFERS TURNOVER WORLD’S ALIGN WITH
INDUSTRY EXTENDED WERE WAS ONLY MOST ETHICAL INVESTOR
LEADER IN 1.56
 ACCEPTED 6.5% COMPANIES® STEWARDSHIP
 IN 2020 GROUP
SAFETY 1990 2020
 IN 2020
 PRINCIPLES

 RECORDABLE INCIDENT RATE

 WE’VE APPOINTED BOARD DIVERSITY
 94% 1,600+
 WE

 REDUCED 7 NEW 4
 SERIOUS
 OF ALL SALARIED
 EMPLOYEES HAVE AN
 LEADERS & DIRECTORS
EMPLOYEE INJURIES
 INDIVIDUAL EMPLOYEES TO OUR BOARD
 BY 60% DEVELOPMENT
 HAVE COMPLETED
 UNCONSCIOUS
 SINCE 2015
 5
 IN 2020
 PLAN BIAS TRAINING Women Men
 Racially Diverse

 Operating Safely • Developing Our People • Maintaining Strong Integrity 11
TIMBERLANDS

 ✓ Unrivaled portfolio that cannot be replicated

 ✓ Diversified holdings at scale
 SUPERIOR
 ✓ Unmatched timber-growing expertise
 HOLDINGS
 CREATE VALUE
 ✓ Superior supply chain
 TODAY AND
 TOMORROW
 ✓ Enduring value across market cycles

 ✓ Enhancing portfolio over time

 12
OUR TIMBERLANDS PORTFOLIO
Unmatched Quality, Scale and Diversification

 High value Douglas fir
 3 ▪ Premium land west of the Cascade mountains
MILLION ▪ Sawlogs are approximately 90% of harvest
 North: 1%
 ACRES IN THE
 WEST ▪ Unique Japan export presence

 UNMATCHED
 West ASSETS
 & Supply-Chain
 Premium Southern yellow pine 55% CAPABILITIES
 7 ▪
 ▪
 Superior quality pine plantation
 Balanced mix of grade and fiber logs South
MILLION Scale operations in every major region
 ACRES IN THE ▪
 44%
SOUTH

 1 Diverse hardwoods and softwoods
 ADJUSTED EBITDA(1)
MILLION ▪ Premium hardwood sawlogs BY REGION (2020)
ACRES IN THE ▪ Maximizing value with over 50 product grades
NORTH (1) See appendix for reconciliation to GAAP amounts and definition of Adjusted EBITDA. Other is excluded.
 Approximate total acres as of December 31, 2020. 13
TIMBERLANDS CUSTOMERS
Capture Full Value Through a Diverse Customer Mix

 TIMBERLANDS REVENUE BY END MARKET (2020)

 21%
 55%
 24%

 THIRD-PARTY WEYERHAEUSER EXPORT
 DOMESTIC CUSTOMERS MILLS CUSTOMERS

 We flex supply to meet dynamic customer demands and capture market opportunities

 14
TIMBERLANDS EXPORT MARKETS
Unrivaled Market Position and Supply Chain Expertise

 UNIQUE JAPAN BUSINESS
 • Multi-decade relationships supplying
 steady post & beam housing market
 • Western timberlands ownership provides
 premium logs at unrivaled scale
 74%
 JAPAN • Largest log export facility in North
 EXPORT America creates substantial supply chain
 advantage and efficiencies
 REVENUE
 20%
 CHINA OTHER EXPORT MARKETS
 • Direct-to-customer strategy facilitates
 consistent demand
 6% • Flexibility to quickly respond to shifts in
 KOREA global wood demand
 • Future growth opportunities
Percentages based on 2020 full year Timberlands export sales. 15
TIMBERLANDS Enduring Value Across Market Cycles NCREIF TIMBERLAND INDEX 600 INDEXED MARKET VALUE PER ACRE, BY REGION 500 Perpetually Growing 400 Asset INDEX TO 1987 U.S. SOUTH = 100 300 Low 200 Correlation With Other Asset 100 Classes 0 1987 1990 1993 1996 1999 2002 2005 2008 2011 2014 2017 2020 Northwest South Source: National Council of Real Estate Investment Fiduciaries (NCREIF) Timberland Index. Changes in index 16 composition may affect average market values (e.g. NCREIF Northwest expanded to include Idaho in 2013).
TIMBERLANDS PORTFOLIO MANAGEMENT
 Disciplined and Opportunistic

 ENHANCING AND OPTIMIZING TIMBERLAND HOLDINGS
 ✓ Continue to strategically
 optimize and upgrade
 7.5
 U.S. South
 NEARLY portfolio
 6.0 U.S. West 70%
 INCREASE ✓ Completed strategic
 SINCE 2012
 4.5
 Alabama acquisition and
 3.0 announced sale of North
Millions of acres

 NEARLY Cascades holdings
 1.5
 40%
 0.0 INCREASE
 SINCE 2012
 ✓ Strong deal sourcing,
 2012 2013 2014 2015 2016 2017 2018 2019 2020
 diligence and execution
 expertise

 $1.6 BILLION OF PROCEEDS(1) ✓ Maximize portfolio value
 FROM STRATEGIC DIVESTITURES SINCE 2017 and returns
 (1) Divestitures include Montana (2020), Michigan (2019), Uruguay (2017) and Twin Creeks (2017). Twin Creeks proceeds include sale of acres to and redemption of interest in the joint venture.
 17
REAL ESTATE, ENERGY & NATURAL RESOURCES

 ✓ Continually evaluate every acre

 ✓ Deliver a significant premium to timber value
 MAXIMIZE
 THE VALUE OF
 ✓ Capture the full value of surface
 EVERY ACRE and subsurface assets
 WE OWN
 ✓ Focus on emerging natural
 climate solutions

 ✓ Generate consistent and
 reliable cash flow

 18
REAL ESTATE
Unlock Higher and Better Use (HBU) Value

 Asset Value Optimization (AVO) PROCESS CONTINUALLY
 EVALUATE EVERY ACRE

 REAL ESTATE
 Nimble Business
 Model 1.3 MILLION ACRES
 with HBU attributes

 Low Operating
 Costs 55–80%
 ACQUISITIONS, Premium to Timber Value
 TIMBERLANDS DIVESTITURES &
 VALUATION SINCE INCEPTION

 Minimal Capital consistently exceeding 30% target
 Investment
 ≤1%
 of timberland acres
 SOLD ANNUALLY
Approximate acres as of December 31, 2020. 19
ENERGY & NATURAL RESOURCES
Maximize the Value of Surface and Subsurface Rights

 Cell
 Towers Wetland
 Infrastructure Mitigation
 Rights of Way Oil &
 Banks Oil &
 Natural
 Gas Natural
 Wind and Gas
 Solar Power 25%
 EBITDA MIX (1)
 Aggregates
 & Industrial
 Materials 67%
 Aggregates 8%
 & Industrial Wind,
 Materials Solar &
 Other

 EBITDA Generated From Lease and Royalty Payments
(1) See appendix for reconciliation to GAAP amounts. Percentages are approximate based on 2020 full year results. 20
REAL ESTATE, ENERGY & NATURAL RESOURCES
 Consistent, Reliable Cash Generation

 ADJUSTED EBITDA(1)
 $ in millions
 $274
 $264 $255
 $241 $241 ✓ Shifting societal
 preferences driving
 $189 robust demand for
 rural recreational
 properties

 ✓ Continued strong
 demand from
 recreational and
 investment buyers

 2016 2017 2018 2019 2020 2021
 Outlook
 Real Estate Energy & Natural Resources

(1) See appendix for reconciliation to GAAP amounts.
The quantity of real estate HBU property was reduced by divestitures of the company’s Michigan and Montana timberlands in 2019 and 2020, respectively.
 21
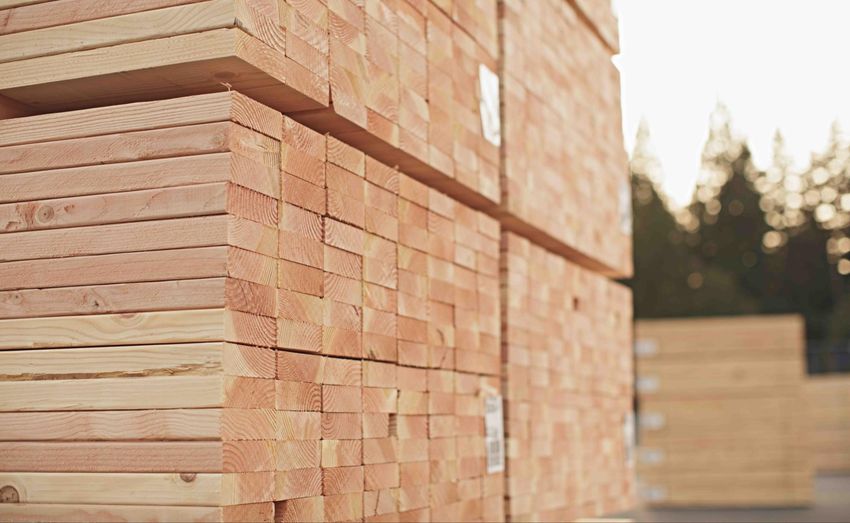
WOOD PRODUCTS

 ✓ Unmatched scale, brand and reputation

 ✓ Diversified mix of high-quality products
 MAXIMIZING
 MARGIN ✓ Diverse customer mix and demand drivers
 THROUGH THE
 BUSINESS ✓ Relentless focus on industry-leading
 CYCLE cost structure

 ✓ Superior returns through the cycle:
 “Black at the bottom”

 22
WOOD PRODUCTS PORTFOLIO
Industry-Leading Scale, Diversification and Quality

 2nd largest producer
 in North America
 • 19 lumber mills
 LUMBER • 5.2 BBF capacity EWP
 19%
 4th largest producer Lumber Distribution
 in North America
 5%
 48%
 • 6 oriented strand board mills
 ORIENTED
STRAND BOARD • 3.1 BSF capacity OSB
 28% UNMATCHED
 #1 engineered wood capacity
 in North America ASSETS
 • 6 engineered wood mills (42 MMCF capacity) & Supply-Chain
 ENGINEERED • 3 veneer/plywood mills (610 MMSF capacity) CAPABILITIES
WOOD PRODUCTS • 1 medium density fiber mill (265 MMSF capacity) ADJUSTED EBITDA(1)
 BY BUSINESS (2018-2020)
 Located in the largest
 homebuilding markets
 • 18 distribution centers
 DISTRIBUTION (1) See appendix for reconciliation to GAAP amounts. Other is excluded.
 Statistics for full year 2020. Source: Competitor reports, public filings, APA. Production capacity for engineered wood represents total solid section press capacity. Weyerhaeuser engineered solid section facilities
 also may produce engineered I-joists to meet market demand. In 2020, approximately 25 percent of Weyerhaeuser’s total press production was converted into I-joists. 23
WOOD PRODUCTS
Diverse Demand Drivers and Customer Mix

 PERCENT OF SALES BY END MARKET (2020)

 18%
 59% 23%

 NEW RESIDENTIAL: REPAIR & REMODEL: NON-RESIDENTIAL CONSTRUCTION,
 SINGLE & MULTI-FAMILY PROFESSIONAL AND DIY INDUSTRIAL AND OTHER USES

 Customers value our quality, scale, reliability and sustainable practices

Percentages are approximate based on 2020 full year Wood Products net sales. 24
WOOD PRODUCTS
 Achieved “Black at the Bottom”

 Improved EWP & Distribution EBITDA
 Delivering and Maintaining Record Low Cost Structure Through Market Headwinds
 $274

 ADJUSTED EBITDA(1)
 Lumber OSB
 14% 15% $ in millions

 100% Cost 100% Cost
 Reduction Reduction

 95% 95%
Cost Net of Logs/MBF

 Controllable Cost/M38
 Indexed to 2013

 Indexed to 2013
 90% 90%
 $12

 85% 85%

 2013 2014 2015 2016 2017 2018 2019 2020
 80% 80%
 2013 2015 2017 2019 2020 2013 2015 2017 2019 2020 EWP Distribution

 Positioned for Superior Performance Through the Cycle

 (1) See appendix for reconciliation to GAAP amounts. 25
INDUSTRY-LEADING PERFORMANCE
Significant, Sustainable Margin Improvement Through the Cycle

 26
OPERATIONAL EXCELLENCE
Delivering Superior Execution and Ongoing Improvement

OUR FOCUS TIMBERLANDS WOOD PRODUCTS
 AREAS Harvest & Haul • Silviculture • Controllable Cost • Recovery •
 Marketing • Merchandising Reliability • Product Mix ACHIEVED
 $750
 MARGIN MILLION
 SINCE 2014
IMPROVEMENT
 FUTURE VALUE Cross-
 Business TARGET
COST AVOIDANCE OpX
 $50-75
 MILLION
 EFFICIENCY IN 2021

 OUR PERFORMANCE VS. PEERS
 OPX
 HIGHLIGHTS Western Timberlands Lumber, OSB and EWP Distribution
 BY BUSINESS Best EBITDA Highest Largest Margin
 per acre Margin Improvement 27
DRIVING SUPERIOR RELATIVE PERFORMANCE
Our OpX Scorecard
 TIMBERLANDS WOOD PRODUCTS
 ADJUSTED EBITDA(1,2) PER ACRE ADJUSTED EBITDA MARGIN(1,3)

 WEST LUMBER(4) ORIENTED STRAND BOARD
 $220 35% 50%

 $180 40%
 25%
 30%
 $140
 15% 20%
 $100
 10%
 5%
 $60 0%

 $20 -5% -10%
 2011 2012 2013 2014 2015 2016 2017 2018 2019 2020 2011 2012 2013 2014 2015 2016 2017 2018 2019 2020 2011 2012 2013 2014 2015 2016 2017 2018 2019 2020

 Weyerhaeuser Timberlands & ENR vs Peers Weyerhaeuser vs Peers Weyerhaeuser vs Peers

 SOUTH ENGINEERED WOOD PRODUCTS DISTRIBUTION
 $80 20% 6%
 4%
 15%
 $60
 2%
 10% 0%
 $40
 5% -2%

 $20 -4%
 0%
 -6%
 $0 -5% -8%
 2011 2012 2013 2014 2015 2016 2017 2018 2019 2020 2011 2012 2013 2014 2015 2016 2017 2018 2019 2020 2011 2012 2013 2014 2015 2016 2017 2018 2019 2020

 Weyerhaeuser Timberlands & ENR vs Peers Weyerhaeuser vs Peers Weyerhaeuser vs Peers

Source for competitor data: public SEC filings, National Council of Real Estate Investment Fiduciaries (NCREIF). Results include only North American operations.
(1) See appendix for reconciliation to GAAP amounts.
(2)
 We are “Black at the Bottom”
 2020 EBITDA for Weyerhaeuser Southern Timberlands reflects announced 10 percent reduction in 2020 fee harvest volumes. Timberlands peers include NCREIF, PotlatchDeltic and Rayonier. To improve comparability with peer
 disclosures, amounts shown for Weyerhaeuser include Timberlands EBITDA and non-timber income currently reported in the company’s Energy & Natural Resources business.
(3) Wood Products peers include BlueLinx, Boise Cascade, Canfor, Interfor, Louisiana Pacific, Norbord and West Fraser. 28
(4) 2017-2020 lumber margins include expenses for softwood lumber countervailing and anti-dumping duties for all companies shown.
DISCIPLINED CAPITAL ALLOCATION
Long-Term Commitment to Balancing Three Key Priorities

 29
DISCIPLINED CAPITAL ALLOCATION
Balanced and Sustainable Philosophy – Three Key Priorities
 RETURN CASH INVEST IN MAINTAIN AN APPROPRIATE
 TO SHAREHOLDERS OUR BUSINESSES CAPITAL STRUCTURE

 CORE ALLOCATION

 Sustainable Disciplined Capital Investment Grade
 Base Dividend Expenditures Credit Rating

 OPPORTUNISTIC ALLOCATION

 Supplemental Dividend Value-Enhancing Liability
 & Share Repurchase Growth Opportunities Management

 $380 MILLION $280 MILLION $900 MILLION
 of cash returned to shareholders of disciplined capex of gross debt reduction
 in 2020 in 2020 in 2020
 30
RETURNING CASH TO SHAREHOLDERS
 “Base Plus Variable Supplemental” Dividend Framework

 CORE ALLOCATION
 Sustainable Base Dividend TARGETED RETURN OF CASH
 TO SHAREHOLDERS
 ▪ Quarterly cash base dividend of $0.17 per share Calculated on an Annual Basis
 ▪ Supported by cash flow from Timberlands and
 Real Estate & ENR Annual Adjusted FAD
 ▪ Positioned to grow over time 75-80% Payout
 Targeted Annual
 0 Return
 OPPORTUNISTIC ALLOCATION to Shareholders
 Supplemental Dividend & Share Repurchase Quarterly Base Cash Dividends
 ▪ Flexible tools to achieve total return of 75-80% of
 annual Adjusted FAD(1)
 VARIABLE
 ▪ Primary tool will be variable supplemental cash dividend SUPPLEMENTAL
 ▪ Generally paid annually in first quarter based on CASH
 DIVIDEND(2)
 prior year cash flow

 First quarter 2021 Adjusted FAD totaled $645 million
(1) See appendix for definition of Adjusted FAD and reconciliation to GAAP amounts.
(2) Weyerhaeuser may also utilize opportunistic share repurchase to return cash under certain circumstances. 31
RETURNING CASH TO SHAREHOLDERS
 Dividend Framework is Sustainable Over the Business Cycle

 ADJUSTED FUNDS AVAILABLE FOR DISTRIBUTION (1)

 $1,240 EXCESS CASH above 75-80%
 $1,250
 of Adjusted FAD available for
 $1,049 $1,081 growth, debt paydown and
 $971 additional share repurchase
 $1,000

 $750 SUPPLEMENTAL DIVIDEND
 or share repurchase to achieve
 $514
 BASE
 $500 targeted return of 75-80%
DIVIDEND
 of annual Adjusted FAD

 $250
 $ millions

 SUSTAINABLE BASE DIVIDEND
 $0
 $ supported by Timberlands and
 2017 2018 2019 2020 Average Real Estate & ENR cash flow,
 even at bottom of the cycle
 Adjusted
 $2,080 $2,032 $1,276 $2,201 $1,897
 EBITDA (1)

 Our cash flow supports the base dividend, even in adverse markets
 (1) See appendix for reconciliation to GAAP amounts and definitions of Adjusted EBITDA and Adjusted FAD. 32
RETURNING CASH TO SHAREHOLDERS
Demonstrated Commitment

 $2,957

 RETURNED
 NEARLY
 $9 BILLION
 TO SHAREHOLDERS $1,361
 $1,181
 SINCE 2014 $1,073
 $941
 $810
 Through Dividends and
 Share Repurchase
 $381

 $ millions
 $127

 2014 2015 2016 2017 2018 2019 2020 2021
 Q1 YTD
 Dividends Share Repurchase

 33
DISCIPLINED INVESTMENTS
Sustain and Enhance Our Operations

 CAPITAL EXPENDITURES UPDATED 2021 OUTLOOK
 $ in millions
 $460 Wood Products – $320 million
 $425 $419 $427
 • Maintenance capex
 $384
 • Projects to improve costs and reliability
 • Beginning Holden Sawmill modernization
 $281
 Timberlands – $125 million
 • Reforestation and silviculture
 • Roads and infrastructure

 Corporate – $15 million
 • IT system upgrades

 2016 2017 2018 2019 2020 2021 Real Estate & ENR – Very minimal
 Outlook • Primarily entitlement activities

 Increased 2021 outlook by $40 million for additional high return projects

Capital expenditures for 2016 exclude discontinued operations. 34
MAINTAIN AN APPROPRIATE CAPITAL STRUCTURE
Solid Balance Sheet and Financial Flexibility

 INVESTMENT GRADE OPPORTUNISTIC AMPLE STRONG ASSET
 CREDIT PROFILE LIABILITY MGMT LIQUIDITY COVERAGE
 Repaid $225 million
 2026 term loan in May 2021 $1.5 billion available Nearly 85% of business
 Baa2 Moody’s revolving line of credit assets are in Timberlands
 Redeemed $825 million
 of 2023 notes Cash earmarked to repay
 BBB Standard & Poor’s Reduced pension obligation $150 million 2021 maturity
 by $765 million

 NET DEBT TO ADJUSTED EBITDA (LTM)(1)
 6.0

 3.5x Target
 4.0
 Net debt/Adjusted
 3.5x
 EBITDA over the cycle 2.0

 0.0
 Q3.16 Q1.17 Q3.17 Q1.18 Q3.18 Q1.19 Q3.19 Q1.20 Q3.20 Q1.21

 (1) Last twelve months Adjusted EBITDA for each quarter presented. See appendix for reconciliation to GAAP amounts. 35
SUPERIOR SHAREHOLDER VALUE
Capitalizing on Strong Portfolio and Operational Performance

 36
FAVORABLE FUNDAMENTALS ACROSS OUR MARKETS
Driven By Continued Demand for U.S. Housing

 ORIENTED STRAND
 LUMBER BOARD WESTERN LOGS SOUTHERN LOGS

Increasing demand from Increasing demand from Rising domestic wood Improving sawlog demand
residential construction residential construction products production
activity activity Fiber log demand generally
 Fire salvage activity resulting stable
Favorable industry operating High industry operating rates in more small diameter logs
rates and higher large log premium Log pricing flat, expect
 Pricing in record territory sawlog prices will rise slowly
B.C. mill closures reduced Favorable Japanese demand over time
industry capacity
 Improved Chinese log Emerging log export
Pricing in record territory demand, with European and opportunity
 Australian supply challenges
Mass timber and CLT gaining
momentum

 37
OUR WORKING FORESTS ARE PART OF THE CLIMATE SOLUTION
An Endlessly Renewable Resource that Absorbs and Stores Carbon

 OUR GROWING FORESTS
 ABSORB CO2
 FROM THE ATMOSPHERE

WE PLANT MORE TREES
THAT ABSORB EVEN MORE CO2
AS THEY GROW WOOD IS THE ULTIMATE
 OUR WOOD PRODUCTS Green-Building Material
 STORE CARBON ✓ Stores carbon
 FOR THE LIFE OF THE PRODUCT
 ✓ Endlessly renewable
 ✓ Lower GHG emissions than concrete & steel

 38
WEYERHAEUSER INVESTMENT THESIS

 DISCIPLINED SUPERIOR
 UNMATCHED
 PORTFOLIO + INDUSTRY-LEADING
 PERFORMANCE + CAPITAL
 ALLOCATION
 SHAREHOLDER
 VALUE

 ESG Strong ESG Foundation | Our Forests and Wood Products are Natural Climate Solutions

 39
APPENDIX
Market Overview and Supplemental Information

 40
EXPECT LONG-TERM GROWTH IN U.S. HOUSING

• Increased demand from major buyer segments
• Low mortgage rates, and record low inventories for existing and new home sales
• Uptick in mortgage rates could dampen demand
• Material constraints, and labor and lot availability may slow builders’ pace of construction

 U.S. HOUSING STARTS
 SEASONALLY ADJUSTED ANNUAL RATE
 2.5
 Single-family Multi-family

 2.0
 Millions of units

 1.5

 1.0

 0.5

 0.0
 1970 1975 1980 1985 1990 1995 2000 2005 2010 2015 2021
 2020
 YTD
 Source: U.S. Census Bureau ANNUAL
 YTD as of April 2021 41
LEVEL OF CONSTRUCTION REMAINS BELOW HOUSING NEED

• Current pace of building activity is still insufficient to meet underlying demand
• U.S. housing market underbuilt by approximately 4 million single-family homes, per Freddie Mac
• Favorable demographics with millennials entering prime homebuying years

 U.S. POPULATION BY AGE ANNUAL U.S. HOUSING NEED
 2021 MILLIONS OF UNITS
 Millennials
 are the
 6 largest
 demographic BASELINE AVERAGE
 5
 cohort DRIVER DEMAND

 New Household Formations 1.2
 4

 Removals 0.3
Millions

 3

 Second Home Demand 0.1
 2
 Natural Vacancy Rate 0.1
 1
 ANNUAL NEW UNITS REQUIRED 1.7
 0
 0
 3
 6
 9
 12
 15
 18
 21
 24
 27
 30
 33
 36
 39
 42
 45
 48
 51
 54
 57
 60
 63
 66
 69
 72
 75
 78
 81
 84
 87
 90
 93
 96
 99

 Source: U.S Census Bureau, FEA Source: FEA, Q1 2021
 Based on 2020-2030
 42
STRONG REPAIR & REMODEL ACTIVITY
 • Demand transitioning from do-it-yourself home improvement to larger, professionally built projects
 • Expect continued favorable repair & remodel sales volumes
 • Housing stock continues to age, with median age greater than 40 years
 • Rising home equity

 U.S. HOUSING STOCK U.S. RETAIL BUILDING MATERIALS SALES
 MEDIAN AGE OF OWNER-OCCUPIED HOMES TOTAL SPENDING
 45 500
 42 years 450

 40 400

 350
Years of Age

 35 300

 $ Billions
 250

 200
 30
 150

 100
 25
 50

 0
 20 2001 2003 2005 2007 2009 2011 2013 2015 2017 2019 2021
 1993 1995 1997 1999 2001 2003 2005 2007 2009 2011 2013 2015 2017 2019 YTD
 ANNUAL
 YEAR Annualized
 Source: U.S. Census Bureau 2019 American Housing Survey, FEA Source: U.S. Census Bureau
 2021 YTD Annualized as of March 2021

 43
LUMBER DEMAND AND FUNDAMENTALS ARE FAVORABLE
 • Strong new residential construction activity and solid home improvement demand
 WEYERHAEUSER’S
 • Favorable industry operating rates AVERAGE LUMBER SALES
 • Pricing in record territory REALIZATIONS
 • Infrastructure bill would increase residential and non-residential demand Approximate change
 AS OF JUNE 18, 2021(1)
 • Mass timber and CLT will drive higher non-residential usage over time

 NORTH AMERICAN LUMBER PRICING Q2 QTD vs. +$240/MBF
 Q1 AVERAGE HIGHER
 LUMBER CONSUMPTION FRAMING LUMBER COMPOSITE
 BY END USE, 2020 1,300
 Q2 CURRENT vs. +$240/MBF
 QTD

 1,100
 Q1 AVERAGE HIGHER

 Repair & 900
 New Remodel
Residential 40% WY’s
 31% 700
 SENSITIVITY
 $/MBF

 500
 CHANGE IN REALIZATIONS
 $10/MBF
 300 ≈ $45 million
 EBITDA
 100
 Industrial Non-Residential
 2005 2007 2009 2011 2013 2015 2017 2019 2021
 ANNUALLY
 23% & Other
 6% QUARTERLY
 Source: Random Lengths (1) Changes in average realizations typically lag
 Source: FEA Q2 QTD as of 6/18/2021 changes in industry benchmark pricing due to
 length of order files. 44
LUMBER
B.C. Mill Closures Have Reduced Industry Capacity

• Log supply declining in British Columbia due to fires, pine beetle and lower allowable cut
• Canadian lumber exports to the U.S. remain subject to duties
• Canadian share of lumber market has decreased
• U.S. Southern lumber production gaining share

 NORTH AMERICAN LUMBER PRODUCTION ANNUAL CHANGE IN LUMBER PRODUCTION
 BY REGION, 2020 BY REGION
 British
 1.4
 Columbia 2019 2020
 U.S. South
 15% 0.9
 35%
 0.4

 Billion board feet
 (0.1)

 (0.6)

 (1.1)

 Other (1.6)
 Canada
 (2.1)
 24%
 (2.6)
 U.S. West British Other Other U.S. U.S. U.S.
 U.S. Other
 22% Columbia Canada West South
 4%
 Source: FEA Source: WWPA
 Total North American softwood lumber production 58 BBF in 2020 45
OSB MARKET FUNDAMENTALS ARE POSITIVE

 • Strong demand from new residential construction activity WEYERHAEUSER’S
 • High industry operating rates AVERAGE OSB SALES
 • Pricing remains in record territory REALIZATIONS
 Approximate change
 AS OF JUNE 18, 2021(1)

 NORTH AMERICAN ORIENTED STRAND BOARD PRICING Q2 QTD vs. +$285/MSF
 7/16” NORTH CENTRAL Q1 AVERAGE HIGHER
 OSB CONSUMPTION
 BY END USE, 2020
 1,300 CURRENT vs. +$425/MSF
 Q2
 Q1 AVERAGE HIGHER
 1,100 QTD
 Repair &
 Remodel
 900
 25%
 WY’s
 $/MSF

 700
 SENSITIVITY
Non-Residential 500 CHANGE IN REALIZATIONS
 & Other $10/MSF
 9% New 300
 Residential ≈ $30 million
 57% 100 EBITDA
 Industrial 2005 2007 2009 2011 2013 2015 2017 2019 2021
 9%
 ANNUALLY
 Source: Random Lengths
 QUARTERLY
 Source: FEA Q2 QTD as of 6/18/2021
 (1) WY reports OSB realizations in MSF 3/8”. Changes
 in average realizations typically lag changes in industry
 benchmark pricing due to length of order files. 46
WESTERN LOGS
 Favorable Domestic and Export Demand
 0.7
 U.S. WESTERN HOUSING STARTS
 0.6
 SEASONALLY ADJUSTED ANNUAL RATE
• Largest driver of demand is growing U.S. housing activity 0.5
 0.4
 Single-family
 Solid Japanese demand for premium logs

 Millions
• 0.3 Multi-family

• Improved Chinese demand with European and Australian supply challenges 0.2
 0.1
• Able to rapidly flex volume in response to changing markets 0
 2010 2011 2012 2013 2014 2015 2016 2017 2018 2019 2020 2021
 Source: Bureau of Census
 ANNUAL YTD
 YTD as of April. 2021

 0.8
 JAPAN HOUSING STARTS
 WESTERN SAWLOG PRICING 0.7
 0.6 WOOD-BASED
 900
 DELIVERED DOUGLAS FIR #2 0.5

 Millions
 800 0.4
 YTD
 0.3
 700
 0.2
 600 0.1
 500 0.0
 $/MBF

 2010 2011 2012 2013 2014 2015 2016 2017 2018 2019 2020 2021
 400 Source: JAWIC
 ANNUAL LTM
 LTM as of March 2021

 WY’s
 300
 60 CHINA SOFTWOOD LOG IMPORTS
 200
 SENSITIVITY FROM ALL COUNTRIES

 Million cubic meters
 50 All Other
 100 New Zealand
 40
 CHANGE IN REALIZATIONS Europe
 0 30
 1997 1999 2001 2003 2005 2007 2009 2011 2013 2015 2017 2019 2021 $25/MBF 20
 USA
 YTD
 Source: Log Lines, Weyerhaeuser
 YTD as of April 2021
 ANNUAL ≈ $30 million 10

 EBITDA -
 2010 2011 2012 2013 2014 2015 2016 2017 2018 2019 2020 2021

 WY transacts Western logs primarily in MBF but reports in ton equivalents. A $5/ton change in WY
 ANNUALLY ANNUAL
 LTM

 realizations is approximately $40 million of annual EBITDA. Source: China Gov't Statistics. Customs Code Numbers: 4403-2000 Logs, coniferous. 47
 LTM as of March 2021
SOUTHERN LOGS
 Improving Sawlog Demand Will Drive Long-Term Price Improvement

 • Sawlog demand increasing as mill operating rates rise U.S. SOUTH CAPACITY ADDITIONS
 2019-2022
 • WY fiber log demand stable 2.5 BBF
 EXPECTED
 • WY’s timberlands are well positioned to benefit from rising lumber 2021-2022
 production and capacity across the South
 • Additional upside opportunity from Southern log exports

 60
 SOUTHERN SAWLOG PRICING New Sawmill Capacity
 Announced
 DELIVERED SOUTHERN AVERAGE PINE SAWLOG New Sawmill Capacity
 Completed
 55 WY Timberlands
 WY Export Facility
 50
$/GREEN TON

 Source: Forisk, Company Reports

 1,200
 45 SAWMILL CAPACITY ADDITIONS
 YTD ANNOUNCED BY STATE
 900 2021-2022
 40
 WY’s
 SENSITIVITY 600

 MMBF
 35
 1997 1999 2001 2003 2005 2007 2009 2011 2013 2015 2017 2019 2021 CHANGE IN REALIZATIONS
 YTD
 Source: Timber Mart-South
 YTD as of Q1 2021 ANNUAL $5/ton 300

 ≈ $60 million
 EBITDA 0
 FL AL LA VA AR TX GA MS
 ANNUALLY Source: Forisk, Company Reports

 48
WELL-LADDERED DEBT PROFILE
Minimal Maturities Until 2023

 ✓ $5.3 billion of long-term
DEBT MATURITY PROFILE(1) debt currently outstanding
$ in millions • 100% fixed rate
 • Weighted average
 maturity of 7.3 years
 $1,250 • Weighted average
 interest rate of 6.2%
 $1,051

 $750
 ✓ Repaid $225 million 2026
 $750
 term loan in 2021 Q2
 $436
 $312 $300 $275
 ✓ Redeemed $825 million of
$150 2023 bonds in 2020 Q3-Q4
 ✓ Remaining 2021 bonds to
2021 2022 2023 2024 2025 2026 2027 2028 2029 2030 2031 2032 2033
 be repaid at maturity
 ✓ Revolver used for working
 capital management as
 needed
(1) $860 million WestRock note maturing 2023 includes extension option.
Revolving credit facility was undrawn as of March 31, 2021. This credit facility has a capacity of $1.5 billion and expires in January 2025. 49
ENVIRONMENTAL, SOCIAL & GOVERNANCE
External Recognition

 LISTINGS ON ESG INDICES ESG RATINGS AND RANKINGS

 3BL MEDIA ETHISPHERE JUST CAPITAL
 named WY one of the named WY one of the named WY one of
 100 BEST WORLD’S MOST AMERICA’S MOST
 CORPORATE CITIZENS ETHICAL COMPANIES® JUST Companies

 We have a
 “WINNING” RATING
 from
 2020 WOMEN ON BOARDS

 50
WE ARE TIMBER-GROWING EXPERTS
Deeply Committed to Environmental Stewardship

 PROPRIETARY SEEDLINGS CUSTOMIZED PLANTING TARGETED SILVICULTURE HEALTHY FORESTS
 We cultivate seedlings with We deploy the best genetic Our practices generate Our forests are diverse
 superior survival, growth, and material for each acre superior volume and and more resistant to
 wood-quality characteristics on our land base value in each geography disease and drought

 100% WE PROTECT 100%
 ESG OF OUR
 TIMBERLANDS ARE WATERWAYS
 OF OUR
 FORESTS ARE

 REFORESTED AND CRITICAL CERTIFIED
 AFTER HARVEST HABITAT

 51
OUR TIMBER SUPPLY-CHAIN EXPERTISE IS UNRIVALED
We Capture Maximum Value At Each Step

 MATURE FORESTS SUSTAINABLE HARVESTING DATA-DRIVEN MARKETING OPTIMIZED TRANSPORTATION
 We grow diverse product Our expert harvest planning We maximize the value We offer dependable, year-round
 offerings in scale quantities captures value at the point of every log using supply with world-class logistics
 with superior, reliable quality of financial maturity data-driven optimization and efficient harvest & haul

 WE HAVE
 WE OFFER WE HAVE THE
 SUPPLY FLEXIBILITY UNIQUE VALUE LARGEST
 CHAIN TO RESPOND
 Diverse Products at Scale
 LOG EXPORT
 EXPERTS QUICKLY Year-Round Supply
 Superior Quality FACILITY
 TO CHANGING IN THE U.S.
 Reliability
 MARKETS
 Unmatched supply chain capabilities
 52
OUR WOOD PRODUCTS SUPPLY CHAIN IS EFFICIENT
We Drive Out Cost and Maximize Value From Raw Materials to End Use

 FIBER PROCUREMENT LOW-COST MANUFACTURING PRODUCT DISTRIBUTION DIVERSE CUSTOMERS
 We source the optimal mix of Our operational excellence and We maximize value by using Our customers value our
 raw materials internally and reliability focus drives top margins the right mix of our own and quality, scale, reliability and
 externally to maximize margins for lumber, OSB and EWP other distribution channels sustainable practices

 OUR MILLS OUR
 WE MAXIMIZE HAVE IMPROVED PRODUCTS STORE
 THE RESOURCE
 ENERGY
 ESG
 THE EQUIVALENT OF
 BY USING
 EFFICIENCY 9 MILLION
 95% 16% METRIC TONS
 OF EACH LOG IN THE LAST
 OF CO2
 ON AVERAGE 5 YEARS EACH YEAR

 53
54
ADJUSTED EBITDA RECONCILIATION
Total Company

 $ Millions 2017 2018 2019 2020
 Adjusted EBITDA1 $2,080 $2,032 $1,276 $2,201
 Depletion, depreciation & amortization (521) (486) (510) (472)
 Basis of real estate sold (81) (124) (116) (141)
 Unallocated pension service costs (4) — — —
 Special items included in operating income (343) (28) 1 122
 Operating Income (GAAP) $1,131 $1,394 $651 $1,710
 Non-operating pension and other post-employment benefit costs (62) (272) (516) (290)
 Interest income and other 40 60 30 5
 Net Contribution to Earnings $1,109 $1,182 $165 $1,425
 Interest expense, net (393) (375) (378) (443)
 Income taxes (134) (59) 137 (185)
 Net Earnings (Loss) (GAAP)2 $582 $748 $(76) $797

1. Adjusted EBITDA is a non-GAAP measure that management uses to evaluate the performance of the company. Adjusted EBITDA, as we define it, is operating income adjusted for depreciation, depletion, amortization, basis of real estate sold, unallocated pension service
 costs and special items. Adjusted EBITDA excludes results from joint ventures. Adjusted EBITDA should not be considered in isolation from, and is not intended to represent an alternative to, our GAAP results.
2. Net earnings for 2017, 2018, 2019 and 2020 include net charges of $52 million, $122 million, $354 million and $285 million, respectively, of after-tax non-operating special items which are reported in non-operating pension and other post-employment benefit costs,
 interest income and other, interest expense, net, and income taxes.
 55
NET DEBT TO ADJUSTED EBITDA RECONCILIATION
Total Company
$ Millions 2016 2017 2018 2019 2020 2021
 Q3 Q4 Q1 Q2 Q3 Q4 Q1 Q2 Q3 Q4 Q1 Q2 Q3 Q4 Q1 Q2 Q3 Q4 Q1
 1,2,3
Net Debt to Adjusted EBITDA (LTM) 5.3 3.7 3.6 3.3 2.9 2.5 2.5 2.2 2.5 3.0 3.3 3.9 4.7 4.9 4.5 4.1 2.9 2.3 1.5
 Total debt $8,310 $6,610 $6,606 $6,604 $5,995 $5,992 $5,928 $5,924 $5,921 $6,344 $6,401 $6,293 $6,590 $6,377 $7,426 $6,299 $5,974 $5,475 $5,475
 Less: Cash and cash equivalents 769 676 455 701 497 824 598 901 348 334 259 212 153 139 1,458 643 787 495 1,016
 $7,541 $5,934 $6,151 $5,903 $5,498 $5,168 $5,330 $5,023 $5,573 $6,010 $6,142 $6,081 $6,437 $6,238
Net Debt $5,968 $5,656 $5,187 $4,980 $4,459

 $1,427 $1,583 $1,701 $1,794 $1,929 $2,080 $2,170 $2,301
Adjusted EBITDA (LTM) 1,2,3 $2,237 $2,032 $1,853 $1,559 $1,362 $1,276 $1,324 $1,367 $1,804 $2,201 $2,889
 Depletion, depreciation & amortization (457) (512) (541) (537) (531) (521) (508) (498) (488) (486) (489) (494) (507) (510) (510) (503) (483) (472) (467)
 Basis of real estate sold (54) (109) (106) (103) (108) (81) (79) (91) (113) (124) (160) (171) (149) (116) (130) (131) (147) (141) (106)
 Unallocated pension service costs (1) (5) (5) (5) (4) (4) (2) (2) (1) — — — — — — — — — —
 Special items in operating income (129) (135) (73) (264) (457) (343) (339) (149) 58 (28) (40) (20) 33 1 33 41 (92) 122 110
Operating Income (LTM) (GAAP) 1 $786 $822 $976 $885 $829 $1,131 $1,242 $1,561 $1,693 $1,394 $1,164 $874 $739 $651 $717 $774 $1,082 $1,710 $2,426
 Equity earnings (loss) from joint ventures 21 22 17 10 2 1 1 1 — — — — — — — — — — —
 Non-operating pension and other post-employment
 41 48 12 (6) (35) (62) (64) (69) (70) (272) (718) (715) (713) (516) (55) (55) (49) (290) (289)
 benefit costs
 Interest income and other 43 43 43 42 38 39 42 44 46 60 58 53 46 30 21 17 13 5 5
 1
Net Contribution to Earnings (LTM) $891 $935 $1,048 $931 $834 $1,109 $1,221 $1,537 $1,669 $1,182 $504 $212 $72 $165 $683 $736 $1,046 $1,425 $2,142
 Interest expense, net of capitalized interest (410) (431) (435) (421) (405) (393) (387) (379) (374) (375) (389) (388) (386) (378) (356) (368) (388) (443) (437)
 Income taxes (42) (89) (102) (105) (56) (134) (140) (171) (183) (59) 75 177 159 137 36 (61) (167) (185) (377)
 1
Net Earnings (Loss) from Continuing Operations (LTM) $439 $415 $511 $405 $373 $582 $694 $987 $1,112 $748 $190 $1 ($155) ($76) $363 $307 $491 $797 $1,328
 Earnings from discontinued operations, net of income
 107 612 592 554 489 — — — — — — — — — — — — — —
 taxes
 1
Net Earnings (Loss) (LTM) (GAAP) $546 $1,027 $1,103 $959 $862 $582 $694 $987 $1,112 $748 $190 $1 ($155) ($76) $363 $307 $491 $797 $1,328
 Dividends on preference shares (33) (22) (11) — — — — — — — — — — — — — — — —
Net Earnings (Loss) to Common Shareholders (LTM)
 $513 $1,005 $1,092 $959 $862 $582 $694 $987 $1,112 $748 $190 $1 ($155) ($76) $363 $307 $491 $797 $1,328
(GAAP) 1
1. LTM = last twelve months.
2. Net debt to Adjusted EBITDA is a non-GAAP measure that management uses to evaluate the performance of the company. Net debt to Adjusted EBITDA, as we define it, is long-term debt and borrowings on line of credit, net of cash and cash equivalents divided by the last
 twelve months of Adjusted EBITDA.
3. Adjusted EBITDA is a non-GAAP measure that management uses to evaluate the performance of the company. Adjusted EBITDA, as we define it, is operating income adjusted for depreciation, depletion, amortization, basis of real estate sold, unallocated pension service costs
 and special items. Adjusted EBITDA excludes results from joint ventures. Adjusted EBITDA should not be considered in isolation from and is not intended to represent an alternative to our GAAP results. 56
ADJUSTED EBITDA RECONCILIATION
Timberlands

 $ Millions 2011 2012 2013 2014 2015 2016 2017 2018 2019 2020
 Western Timberlands and Energy & Natural Resources (ENR) $283 $263 $380 $579 $470 $449 $520 $544 $332 $354
 Less: EBITDA attributable to Western ENR1 4 5 7 8 11 6 12 12 14 14
 Western Timberlands 279 258 373 571 459 443 508 532 318 340
 Southern Timberlands and ENR 290 339 372 457 472 469 428 398 410 319
 Less: EBITDA attributable to Southern ENR1 64 41 44 47 42 43 45 47 58 45
 Southern Timberlands 226 298 328 410 430 426 383 351 352 274
 Northern Timberlands 29 28 32 47 41 26 23 19 15 4
 Other Timberlands (15) (8) 46 2 7 6 22 — (5) (8)
 Adjusted EBITDA including Legacy Plum Creek operations1,2 $519 $576 $779 $1,030 $937 $901 $936 $902 $680 $610
 Less: EBITDA attributable to Plum Creek3 175 203 235 291 260 36 — — — —

 Weyerhaeuser Timberlands Adjusted EBITDA1 $344 $373 $544 $739 $678 $865 $936 $902 $680 $610
 Depletion, Depreciation & Amortization (138) (143) (168) (207) (208) (366) (356) (319) (301) (257)
 Special Items — — — — — — (48) — (32) 102

 Operating Income (GAAP) $206 $230 $376 $532 $470 $499 $532 $583 $347 $455
 Interest Income and Other 4 3 4 — — — — — — —

 Loss Attributable to Non-Controlling Interest — 1 — — — — — — — —

 Net Contribution to Earnings $210 $234 $380 $532 $470 $499 $532 $583 $347 $455

1. Adjusted EBITDA is a non-GAAP measure that management uses to evaluate the performance of the company. Adjusted EBITDA, as we define it, is operating income adjusted for depreciation, depletion, amortization, basis of real estate sold, unallocated pension service costs
 and special items. Adjusted EBITDA excludes results from joint ventures. Adjusted EBITDA should not be considered in isolation from and is not intended to represent an alternative to our GAAP results.
2. Results exclude Real Estate, Energy & Natural Resources, which was reported as part of legacy Weyerhaeuser’s Timberlands segment. West includes Plum Creek Washington and Oregon operations. South includes Plum Creek Southern Resources. North includes Plum Creek
 Northern Resources less Washington and Oregon. Results from Longview Timber are included in Other for 2013 and in Western Timberlands for 2014 and forward. Other also includes results from international operations and certain administrative charges.
3. Results represent Plum Creek Timberlands EBITDA from October 1, 2011 through February 18, 2016. 57
ADJUSTED EBITDA RECONCILIATION
Wood Products

 $ Millions 2011 2012 2013 2014 2015 20161 2017 2018 2019 2020

 Lumber ($7) $130 $317 $319 $212 $289 $459 $459 $183 $799

 OSB (4) 143 247 46 41 183 359 329 59 466

 EWP 6 17 45 79 114 145 173 177 207 188

 Distribution (37) (29) (33) 2 10 25 38 32 33 86

 Other (1) (15) (2) — (5) (1) (12) (10) (6) (12)

 Adjusted EBITDA2 ($43) $246 $574 $446 $372 $641 $1,017 $987 $476 $1,527

 Depletion, Depreciation & Amortization (151) (133) (123) (119) (106) (129) (145) (149) (191) (195)

 Special Items (52) 6 (10) — (8) — (303) — 68 8

 Operating Income (GAAP) ($246) $119 $441 $327 $258 $512 $569 $838 $353 $1,340

 Interest Income and Other 3 1 — — — — — — — —

 Net Contribution to Earnings ($243) $120 $441 $327 $258 $512 $569 $838 $353 $1,340

1. Amounts presented reflect the results of operations acquired in our merger with Plum Creek Timber, Inc. beginning on the merger date of February 19, 2016.
2. Adjusted EBITDA is a non-GAAP measure that management uses to evaluate the performance of the company. Adjusted EBITDA, as we define it, is operating income adjusted for depreciation, depletion, amortization, basis of real estate sold, unallocated
 pension service costs and special items. Adjusted EBITDA excludes results from joint ventures. Adjusted EBITDA should not be considered in isolation from and is not intended to represent an alternative to our GAAP results. 58
ADJUSTED EBITDA RECONCILIATION
Real Estate, Energy & Natural Resources

 $ Millions 2016 2017 2018 2019 2020

 Real Estate $142 $178 $196 $193 $176
 Energy & Natural Resources 47 63 68 81 65
 Adjusted EBITDA1 $189 $241 $264 $274 $241
 Depletion, Depreciation & Amortization (13) (15) (14) (14) (14)
 Basis of Real Estate Sold (109) (81) (124) (116) (141)
 Special Items in Operating Income (14) — — — —
 Operating Income (GAAP) $53 $145 $126 $144 $86
 Interest Income and Other 2 1 1 — —
 Net Contribution to Earnings $55 $146 $127 $144 $86

1. Adjusted EBITDA is a non-GAAP measure that management uses to evaluate the performance of the company. Adjusted EBITDA, as we define it, is operating income adjusted for depreciation, depletion, amortization, basis of real estate sold, unallocated pension
 service costs and special items. Adjusted EBITDA excludes results from joint ventures. Adjusted EBITDA should not be considered in isolation from and is not intended to represent an alternative to our GAAP results. 59
ADJUSTED FUNDS AVAILABLE FOR DISTRIBUTION (FAD)
RECONCILIATION

 $ Millions 2017 2018 2019 2020 Q1 2021
 Net Cash from Operations $1,201 $1,112 $966 $1,529 $698
 Capital Expenditures (excluding discontinued operations) (419) (427) (384) (281) (53)
 Funds Available for Distribution1 $782 $685 $582 $1,248 $645
 Cash for product remediation payments (from product remediation
 192 96 (68) (8) —
 insurance recoveries)
 Cash tax payments attributable to Cellulose Fibers divestiture 75 — — — —
 Cash contribution to our U.S. qualified pension plan — 300 — — —
 Adjusted Funds Available for Distribution2 $1,049 $1,081 $514 $1,240 $645

1. Funds available for distribution (FAD) is a non-GAAP measure that management uses to evaluate the company's liquidity. FAD, as we define it, is net cash from operations adjusted for capital expenditures. FAD measures cash generated during the period (net of capital
 expenditures) that is available for dividends, repurchases of common shares, debt reduction, acquisitions, and other discretionary and nondiscretionary capital allocation activities. FAD should not be considered in isolation from, and is not intended to represent an
 alternative to, our GAAP results.
2. Adjusted funds available for distribution (Adjusted FAD) is a non-GAAP measure that management uses to evaluate the company's liquidity. Adjusted FAD, as we define it, is net cash from operations adjusted for capital expenditures and significant non-recurring
 items. Adjusted FAD measures cash generated during the period (net of capital expenditures and significant non-recurring items) that is available for dividends, repurchases of common shares, debt reduction, acquisitions, and other discretionary and nondiscretionary
 capital allocation activities. Adjusted FAD should not be considered in isolation from, and is not intended to represent an alternative to, our GAAP results. 60
You can also read