WHITE PAPER POPULATION ON MAPPING AND - IN INDIA - NACO
←
→
Page content transcription
If your browser does not render page correctly, please read the page content below
White Paper
on Mapping and
Population
Size Estimation of High-Risk Groups for

                                                         In India

                  National AIDS Control Organisation
                       India’s Voice against AIDS
        Ministry of Health & Family Welfare, Government of India
                             www.naco.gov.in

                                                              White Paper on Mapping and Population
                                                    Size Estimation of High-Risk Groups for HIV in India
                                                                                                           I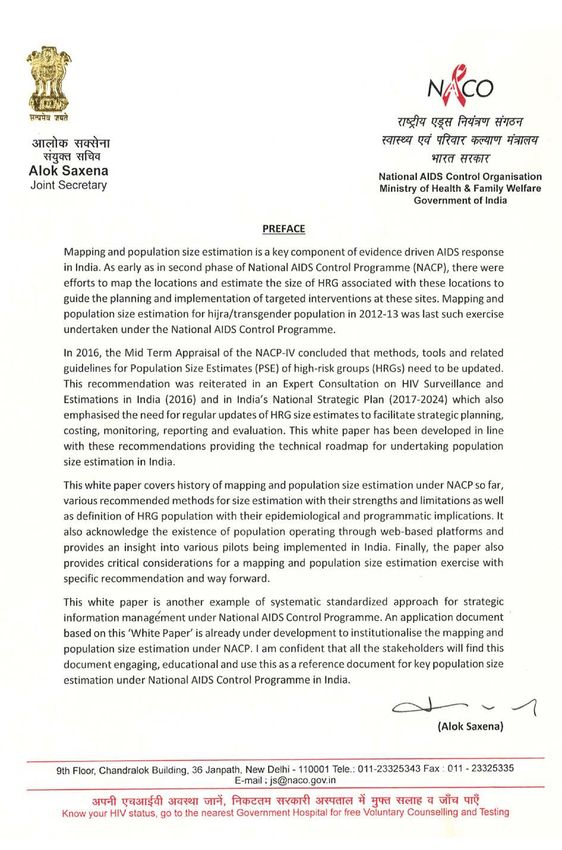
Suggested Citation:
          National AIDS Control Organization (2019). White Paper on Mapping and Population Size Estimation of High-risk
          Groups for HIV in India. New Delhi: NACO, Ministry of Health and Family Welfare, Government of India.

          For additional information about ‘White Paper on Mapping and Population Size Estimation of
          High-risk Groups for HIV in India’, please contact:
          Strategic Information Management Division (Surveillance)
          National AIDS Control Organisation (NACO)
          Government of India
          Ministry of Health and Family Welfare
          6th and 9th Floor
          Chanderlok, 36, Janpath, New Delhi, 110001

     White Paper on Mapping and Population
II   Size Estimation of High-Risk Groups for HIV in India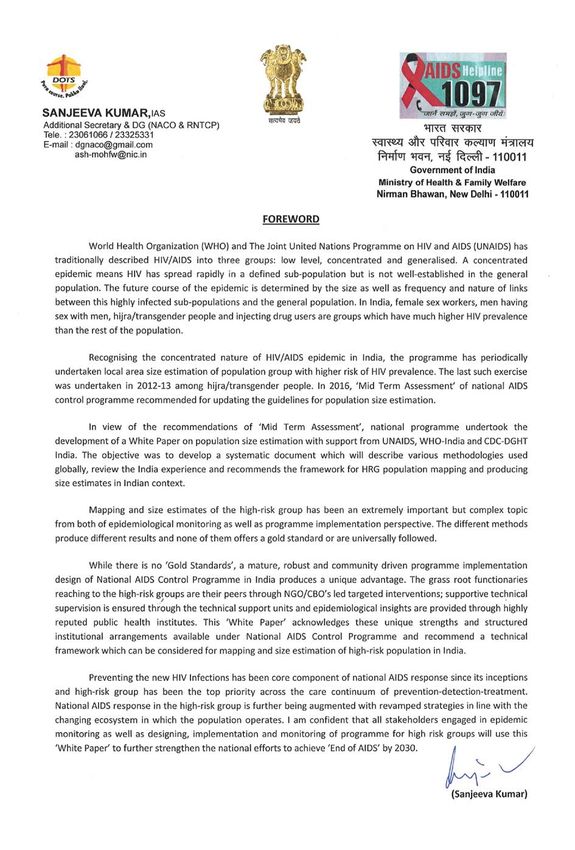
White Paper
on Mapping and
Population
Size Estimation
     Estimation of
                of High-Risk
                   High-RiskGroups
                             Groupsfor
                                    for

                                                        In India

                   National AIDS Control Organisation
                        India’s Voice against AIDS
         Ministry of Health & Family Welfare, Government of India
                              www.naco.gov.in

       GOI/NACO/SI/White Paper on Mapping and Population Size Estimation/060619

                                                                   White Paper on Mapping and Population
                                                         Size Estimation of High-Risk Groups for HIV in India
                                                                                                                III
White Paper on Mapping and Population
IV   Size Estimation of High-Risk Groups for HIV in India
White Paper on Mapping and Population
Size Estimation of High-Risk Groups for HIV in India
                                                       V
White Paper on Mapping and Population VI Size Estimation of High-Risk Groups for HIV in India
White Paper on Mapping and Population
Size Estimation of High-Risk Groups for HIV in India
                                                       VII
White Paper on Mapping and Population VIII Size Estimation of High-Risk Groups for HIV in India
MESSAGE
The old saying “What gets measured gets done” is very true for the HIV response as it means measuring
something gives you the information you need in order to make sure you achieve what you set out to do.
Over the years, a comprehensive understanding of the HIV epidemic was developed in India through the
collection, analysis and dissemination of data, guiding programmes to reach the right people, in the right
place and at the right time. Also, having high-quality data re the HIV response has enabled ambitious,
measurable and time-bound targets to be set for monitoring progress and guaranteeing accountability.

With a concrete target set of end the AIDS epidemic by 2030 as part of the Sustainable Development
Goals, it is vital to have the right data to track whether India is on course to meet its commitments to the
2016 United Nations Political Declaration on AIDS to achieve the 2020 targets and beyond.

This White paper on mapping and population size estimation of High-risk Groups for HIV in India offers
valuable recommendations on how to proceed with the updating of key populations size estimates by
capitalising on a very strong existing institutional arrangements, great experience in disease surveillance
and use of data for decision making while addressing the challenges.

Reviewing the objectives of the size estimates, clearly defining High-risk groups for HIV, introducing
new approaches and periodicity of population size estimates (e.g. stratified local area estimates, direct
mapping in strategic locations, complemented with extrapolation and virtual mapping, biennially with
revalidation between two rounds) will all improve the quality of the data at a lesser cost usable for local
planning , implementation and monitoring of impact of programmes and will also help in the design of
differentiated programmes targeting key populations based on their specific needs and location in both
the physical and virtual space.

Finally, the data collected from size estimates will also support the development of projections and
estimations of the HIV epidemic at national, states and districts levels. The proposed approach will
further strengthen the institutionalization of the collaboration between different stakeholders involved
in making available quality population size estimates of High-risk groups for HIV in India.

NACO must be commended for leading these strategic changes in the context of a concentrated HIV
epidemic which will not only facilitate measuring the commitments made by India but will also support
‘’getting the job done’’ in ending AIDS as a public threat in this country by 2030.

                                                                                              Dr Bilali Camara

                                                                                     Medical Epidemiologist
                                                                            UNAIDS Country Director for India

                                                                              White Paper on Mapping and Population
                                                                    Size Estimation of High-Risk Groups for HIV in India
                                                                                                                           IX
White Paper on Mapping and Population X Size Estimation of High-Risk Groups for HIV in India
White Paper on Mapping and Population
Size Estimation of High-Risk Groups for HIV in India
                                                       XI
Contents
Foreword V
Preface VII
Message IX
Acknowledgement XI
Abbreviations XV
Executive summary XVI
1 Introduction 01
2 Definition of High-risk groups 03
3 Review of MPSE methods 07
4 Mapping and population size estimations under NACP 18
5 Mapping of population operating through web-based platforms 24
6 Discussion 26
7 Recommendations 29
8 Way forward 34
White Paper on Mapping and Population
XII Size Estimation of High-Risk Groups for HIV in IndiaTables
Table 1: Men who have sex with men, definitions and size estimate 04
Table 2: Population proportions of High-Risk Groups in UNAIDS regions 06
Table 3: Categories of MPSE methods 07
Table 4: Strengths, limitations and context of various mapping & population size
17
estimation methods
Table 5: National level HRG size estimates (2004) 19
Table 6: National level HRG size estimates, MTR (NACP-III) 21
Table 7: Definitions of High-risk population groups 30
Boxes
Box 1: Wisdom of the crowd 09
Box 2: Mapping 10
Box 3: Enumeration 10
Box 4: Programme multiplier 12
Box 5: Unique object multiplier 14
Box 6: Capture recapture 15
White Paper on Mapping and Population
Size Estimation of High-Risk Groups for HIV in India
XIIIWhite Paper on Mapping and Population XIV Size Estimation of High-Risk Groups for HIV in India
Abbreviations

        AIDS   Acquired Immuno Deficiency Syndrome
        BSS    Behavioural Surveillance Survey
        CBO    Community Based Organization
         CM    Crosswise Method
        DHS    Demographic and Health Survey
      DSACS    Delhi State AIDS Control Society
        FGD    Focus Group Discussion
        FSW    Female Sex Worker
        GPS    Global Positioning System
        HIV    Human Immunodeficiency Virus
        HRG    High-risk Group
       H/TG    Hijra/Transgender People
       IBBA    Integrated Biological and Behavioural Assessment
        IBBS   Integrated Biological and Behavioural Surveillance
    ICMR-NIE   Indian Council of Medical Research-National Institute of Epidemiology
        IHAT   India Health Action Trust
         HIF   Hotspot Information Format
        IDU    Injecting Drug User
         KII   Key Informant Interview
         KP    Key Population
       MPSE    Mapping and Population Size Estimation
       MSM     Men who have Sex with Men
       MSW     Male sex worker
        MTR    Mid-term Review
      NACO     National AIDS Control Organization
       NACP    National AIDS Control Programme
       NGO     Non-Governmental Organization
       NFHS    National Family Health Survey
      NSUM     Network Scale-up Method
        NSP    National Strategic Plan
      PLHIV    People Living with HIV
        PSA    Participatory Site Assessment
       PWID    People Who Inject Drugs
        RDS    Respondent Driven Sampling
      RDSAT    Respondent Driven Sampling Analysis Tool
          RI   Regional Institute
       SACS    State AIDS Control Society
          TI   Targeted Intervention
        TSU    Technical Support Unit
     UNAIDS    Joint United Nations Programme on HIV/AIDS
         UT    Union Territory
         UN    United Nations
       WHO     World Health Organization
      WOTC     Wisdom of the Crowd

                                                                  White Paper on Mapping and Population
                                                        Size Estimation of High-Risk Groups for HIV in India
                                                                                                               XV
Executive summary
India’s HIV epidemic is concentrated among high-risk groups-or key populations
as they are referred globally-of female sex workers, men having sex with men,
hijra/transgender people and injecting drug users. As the National AIDS Control
Programme endeavors to further reinforce HIV prevention, early diagnosis,
treatment and care services among these populations towards achieving ‘End of
AIDS by 2020’, understanding the geographic location and size of these populations is
critical to inform programme planning, location prioritization and resource allocation.
There are population size estimates for female sex workers, men having sex with
men, and injecting drug users from 2004 and 2009-11 mapping and population
size exercises conducted in the country. A separate exercise for hijra/transgender
people was conducted in 2012-13 when the programme recognised them as separate
group from men having sex with men. Asides from these initiatives, there has not
been a major population size estimation exercise for the high-risk groups in recent
times, although there has been ‘re-validation’ exercise to update the information
periodically by the National AIDS Control Organisation (NACO) with State AIDS
Control Societies and Technical Support Units.
In 2016, the Mid Term Appraisal (MTA) of the National AIDS Control Programme
(NACP) IV recommended that methods, tools and related guidelines for Mapping and
Population Size Estimations (MPSE) of high-risk groups (HRGs) and their validation
need to be upgraded. This recommendation was reiterated in an Expert Consultation
on HIV Surveillance and Estimations in India (2016) and in India’s National Strategic
Plan (2017-2024) which also emphasised the need for regular updates of MPSE
to facilitate strategic planning, costing, monitoring, reporting and evaluation.
Consequently, NACO commissioned White Paper on mapping and population size
estimation of HRG population in India to describe prevalent methods with their
strengths and limitations, detail the evolution of size estimation under NACP and
finally to recommend the contour for periodically undertaking the population size
estimation in India.
A key consideration before undertaking any mapping and population size estimation
exercise is defining the population as that will determine the population who ‘are
measured’. While there are broad definitions mentioned in UN documents, various
countries have their own interpretations of these definitions to accommodate
the local context and target-setting. While some define female sex workers, men
White Paper on Mapping and Population
XVI Size Estimation of High-Risk Groups for HIV in Indiahaving sex with men, hijra/transgender people and injecting drug users quite specifically, others have
it extremely broad. However, all in all, each of them can lead to varying estimates and essentially no
population size estimate across countries can be compared unless they have the same definition.
There are direct and indirect methods to estimate the high-risk group population size. The direct
methods-wherein data is collected from/on the high-risk groups-are: Wisdom of the Crowds, Census/
Comprehensive Mapping, Enumeration, Multiplier and Capture-Recapture. The indirect methods are:
General Population Survey and Network Scale-up. Methods to undertake mapping of high-risk groups
operating through web-based platforms for solicitation are in early stage of development with pilot
initiatives underway in different parts of the country having high urban density.
While no method is perfect, building on India’s history of conducting venue-based mapping and
size estimates, local area estimates method using direct mapping and population size estimation
approach is most suitable method from programme implementation purposes. However, in a large and
heterogeneous country like India, with a total population of around 1.3 billion and 36 States/Union
Territories, it is impossible to obtain local area estimates for all geographical areas across the country,
no matter which methodology is used. Such an endeavour would be too time consuming and costly.
Therefore, collecting local area estimates using direct mapping and population size estimates methods in
strategically selected locations, and then using extrapolation procedures to make inferences about areas
which do not have direct estimates, is recommended for India.
From implementation perspective, it is recommended to integrate MPSE in the HIV prevention Targeted
Interventions of the National AIDS Control Programme with an aim to repeat the exercise biennially
as that would periodically inform the programme plan for course-correction and re-calibration of
interventions as and when required. As the Targeted Intervention programme has matured over the
years and institutional arrangements are in place to undertake such a large-scale exercise, this approach
will also enable community-driven mapping of high technical rigour in a resource efficient manner.
It will be strategic to complement the Mapping method with other direct methods also such as Multiplier
and Capture-Recapture methods, as and when opportunities arise. Additionally, a size estimation
component can be in-built into the periodic Behavioural Surveillance Surveys planned under the
National AIDS Control Programme to further enrich understanding of the population size. Even specific
assessments can be encouraged to include size estimation in local level data collection efforts subject to
objective alignment and resource availability.
Recommendation is also to explore the possibility of integrating appropriate questions under relevant
household surveys such as the National Family Health Survey. While household surveys tend to
underestimate the prevalence of people engaged in High-risk behaviour, it will still provide information
on the minimum estimated size of the relevant populations.
As a full-fledged MPSE exercise will take a minimum of 6-9 months from designing to outcome, it is
recommended to develop an interim working estimate for the country on a priority basis using the same
approach adopted during the planning stage of National AIDS Control Programme III. An immediate
next step will be to develop an “application document” to implement periodic MPSE as recommended
in this White Paper. Methods for mapping high-risk groups operating through web-platforms and use
of social media/mobile phones also need further development, by building on the learnings from pilot
initiatives being undertaken in some States.
White Paper on Mapping and Population
Size Estimation of High-Risk Groups for HIV in India
XVII1 Introduction
1.1 Background
In 2016, a mid term appraisal (MTA) of the National AIDS Control Programme
(NACP) IV was conducted by the National AIDS Control Organization (NACO),
in collaboration with a group of national and international experts. The MTA
concluded that methods, tools and related guidelines for mapping and population
size estimation (MPSE) of high-risk groups (HRGs), or key populations (KP) as they
are referred to internationally, and their validation needed to be upgraded.1 This
recommendation was reiterated in an Expert Consultation on HIV Surveillance and
Estimations held in India (2016)2 and in India’s national strategic Plan (2017-2024)
which also emphasized the need to regularly update MPSE to facilitate strategic
planning of the AIDS response costing, monitoring, reporting and evaluation.3
As an immediate follow-up, a Working Group on ‘monitoring and evaluation
and size estimation’ was created by NACO with the task of reviewing current
methods and practices of HRG mapping and size estimation used in India and
making suggestions for their improvement. One of the recommendations by the
group was to develop a White Paper to present experiences, best practices and
lessons learned in India and across the world, in designing and implementing
MPSE for different types of HRG. In addition, the paper also aimed to provide
strategic recommendations on how to implement MPSE in India by building on past
achievements and lessons, while at the same time addressing the need to conduct
MPSE activities at scale, while using standardized approaches that were cost
effective and efficient.
In the context of recommendations outlined above, this white paper describes
various methodologies used globally to estimate sizes of different high-risk groups,
highlights their strengths as well as weaknesses, reviews the India experience
and recommends the framework for producing size estimates beneficial for HRG
programming in the Indian context.
1.2 Rational and objective
In many countries, including in India, the HIV epidemic is concentrated among
populations who are at higher risk of infection. These include female sex workers
(FSW), men who have sex with men (MSM), hijras/ transgender (H/TG) people,
1
Mid-term appraisal of national AIDS control programme phase IV, National AIDS Control Organisation, 2016.
2
Expert Consultation on HIV surveillance and estimations in India, 2016. (2018). New Delhi: National AIDS Control Organization,
Ministry of Health & Family Welfare, Govt of India.
3
National Strategic Plan for HIV/AIDS and STIs 2017 –2024, National AIDS Control Organisation, 2017.
White Paper on Mapping and Population
1 Size Estimation of High-Risk Groups for HIV in Indiaand people who inject drugs (PWID) or injecting drug users (IDUs), as they are more commonly
referred to, in India.
The population is often described as ‘hidden’ because their behaviours continue to be
stigmatized. In many countries, these behaviours are also illegal or criminalized. Therefore,
comprehensively enumerating key populations is a challenging endeavour.
Yet, MPSE are important to understand the volume and patterns of the epidemic and its
trends over time to put in place policies and programmes. As populations at higher risk are not
uniformly distributed across the country, size estimations are important in the assessment of
programmatic needs across different locations and planning of prevention, care and treatment
interventions and services. They also facilitate target-setting and budgeting or costing of
programme interventions.
These estimates are not only needed to ensure efficient allocation of resources. They
are necessary also for advocacy and resource mobilization purposes. Understanding the
populations at risk of HIV or living with HIV in specific settings helps inform policy decision-
making to intervene with prevention and other measures to alleviate the burden of the disease.
MPSE are also a critical input in epidemiological models like Spectrum which is used to produce
HIV estimations on core indicators at national and sub-national level to monitor and evaluate
the response to the epidemic. Key indicators include HIV incidence and prevalence as well as
numbers of people living with HIV (PLHIV), AIDS-related deaths and treatment needs.
As it is not possible to physically count all people belonging to various HRGs, their sizes are
estimated using a variety of methods. Many different methods have been experimented,
and some methods are used more often than others. However, the choice of a particular
size estimation method, or a mix of methods, hinges on strategic information needs and the
objectives for which MPSE are being developed at different levels.
Global experience accumulated over the years with implementation of population size
estimations has shown that there is no single method uniformly suited to every context.
There also is no perfect method; each has its own strengths and weaknesses.
This White Paper discusses various methods of MPSE, Indian experiences and lesson learnt, best
practices in estimating the size of HRG in India and beyond, and also makes recommendations to
update and further strengthen MPSE in India’s national and sub-national context.
The specific aims of the white paper are to:
ŹŹ Provide an overview of various methods of mapping and population size estimations.
ŹŹ Discuss the strengths and weaknesses of different methods and tools in the light of
strategic information needs in the AIDS response India.
ŹŹ Recommend the contour for periodically undertaking the mapping and population size
estimations in India.
1.3 Structure of the white paper
The succeeding sections of this White Paper are aligned with its objectives. Section 2 focusses
on the issue of definitions of HRG as a fundamental aspect of size estimation. Section 3 provides
an overview of the various methods of MPSE and also highlights best practices from various
countries. Section 4 describes the history and current status of MPSE in India. Section 5 focuses
on mapping and estimating populations operating via web-based platforms and provides insight
into various pilots being implemented in India. Section 6 discusses the critical considerations
while undertaking mapping and MPSE exercises. Recommendations for MPSE in India are
included under Section 7. Section 8 provides the way forward.
White Paper on Mapping and Population
Size Estimation of High-Risk Groups for HIV in India
22 Definition of
High-risk groups
The term ‘High-risk group’ is used to describe a group of people who are at increased
risk of being exposed to HIV because they have frequent risky behaviour (unsafe sex or
sharing of injecting equipment) on a regular basis. The definitions mentioned in various
United Nations documents tend to adopt broader definitions of these groups as listed
below: 4,5
1 Sex
workers 2 Men who have sex
with men 3 People who
inject drugs
Consenting males, females Males who have sex Men or women
or trans-gender adults (aged with males regardless who have injected
18 years or older) who of whether or not they any time within the
regularly or occasionally have sex with women or previous 12 months
receive money or goods in have a personal or social (not including for
exchange for sexual services gay or bisexual identity medical purposes)
While there are broader definitions mentioned in UN documents, they are not
necessarily followed universally as standard definitions. Various countries have
used various definitions in the past while carrying out population size estimation.
For example, UNAIDS defines MSM as “males who have sex with other males,
regardless of whether or not they have sex with women or have a personal or social
identity associated with that behaviours, such as being ‘gay’ or ‘bisexual’.” However,
definitions used by countries have varied by description of sexual behaviours (anal,
oral) or nature of sexual encounter (any sex, paid sex only) and time frame (life
time, past 12 months, past 6 months, past 3 months, etc.) (Table 1). While some
definitions are quite specific, some are extremely broad. These local definitions may
accommodate local programming. However, use of each of them can produce widely
varying estimates and make comparability across countries and regional or global
aggregation more challenging (Table 2).
4
UNAIDS Terminology Guidelines (2015).
5
Estimating sizes of key populations: guide for HIV programming in countries of the Middle East and North Africa / World Health
Organization. Regional Office for the Eastern Mediterranean (2016).
White Paper on Mapping and Population
3 Size Estimation of High-Risk Groups for HIV in IndiaTable 1: Men who have sex with men, definitions and size estimates 6
Country Estimated size Definition Males As% of males
(15-49) (15-49)
Afghanistan (2015) 10,700 Males 15+yrs; both active and passive 8,049,121 0.1
Australia (2011) 190,000 Self-identify as men who have sex with men 5,614,708 3.4
Bangladesh (2015) MSM:101,695 MSM: Males 10+ yrs; who had sex with males with consent in the last year 45,033,462 MSM: 0.2
regardless of whether they have sex with women or have a personal/social
MSW: 29,777 gay or bisexual identity but do not sell sex. MSW: 0.1
MSW: Males who sell sex to other males in exchange of money or gifts in last
3 months
Cambodia (2012) 20,000 Males 15+yrs; who have sex with males in the last year regardless of whether 3,966,282 0.5
they have sex with women or have a personal/social gay or bisexual identity
China (2013) 3,960,000 Males 15-65 yrs; who have sex with men in recent year 400,323,128 1.0
India (2012-13) 300,000 Programme data of Targeted Intervention Programme based on the criteria 349,619,823 0.1
– Very high risk MSM (15 or more male partners per week). MSM: Males 15+
yrs; who had anal or oral sex with a male/hijra partner in the last one month
and are visible on the hotspot
Indonesia (2012) 1,095,970 Males 15+ yrs; men who have sex with men excluding transgender 68,582,937 1.6
Japan (2013) 519,721 Not available 27,384,599 1.9
Lao PDR (2015) 58,320 Not available 1,793,814 3.3
Malaysia (2014) 170,000 Males 18+ yrs, who had engaged in anal sex with men at least once in the 8,472,244 2.0
previous six months
Mongolia (2014) 3,118 Males 15-49 yrs; who had anal or oral sex with men in the past 12 months 836,336 0.4
Myanmar (2015) 252,000 Males 15+ yrs; who has had anal sex with another male in the past 6 months 14,349,533 1.8
6
Source: GARPR online reporting 2016. China 2013 HIV estimation and United Nations, Department of Economics and Social
Affairs, Population Division (2015), World Population Prospects. The 2015 Revision.
Size Estimation of High-Risk Groups for HIV in India
White Paper on Mapping and Population
45
(Table 1: Contd...)
Country Estimated size Definition Males As% of males
(15-49) (15-49)
Nepal (2012) MSM: 196,270 MSM: Males who have oral and/or anal sex with other biological males, at 6,373,961 MSM: 3.1
least once, in the past 12 months.
MSW: 11,376 MSW: 0.2
MSW: Males 16+yrs; who had oral and/or anal sex with other males in the
White Paper on Mapping and Population
past 12 months in exchange for money or other benefits.
Pakistan (2012) MSM: 150,000 MSM: Not available. 46,674,112 MSM: 0.3
Size Estimation of High-Risk Groups for HIV in India
MSW: 63,732 MSW: Males 13+yrs; who undertakes sexual activity with a man in return for MSW: 0.1
money or benefits
Philippines (2015) MSM: 531,500 MSM: Males 15+ yrs; who had oral or anal sex with a male in the past 12 24,435,734 MSM: 2.2
months.
MSW: 86,600 MSW: 0.4
MSW: Males 15+yrs; who had oral or anal sex with a male in the past
12 months and accepted cash or kind in exchange for sex regardless of
establishment-based or not
Sri Lanka (2013) 7,551 All men who have sex with other men as a matter of prevalence or practice, 5,049,250 0.1
regardless of their sexual identity or sexual orientation.
Thailand (2015) 571,000 Prevalence of same sex behaviors in the last 12 months among males 17,681,890 3.2
Viet Nam (2013) 382,506 Men who have sex with men 26,182,125 1.5Table 2: Population proportions of High-Risk Groups in UNAIDS regions
Proportion of adult UNAIDS regions Total
population (15-49) that is Asia and Caribbean East and East Europe Latin North Africa West and
a member of each group, Pacific Southern and Central America and Middle Central
by appropriate gender Africa Asia East Africa
Female sex Number of 12 2 7 9 5 3 11 47
workers Countries
Median 0.35 – 0.58 0.68 0.49 1.18 1.19 0.67
range 0.18–2.33 2.40–2.50 0.25–3.00 0.42–1.25 0.12–1.91 0.94–2.78 0.57-3.00 0.12–3.00
25–75 0.26–0.67 – 0.41–1.66 0.46-0.97 0.16-1.52 – 0.84-1.88 0.39–1.23
Percentiles
Men who have Number of 14 4 9 11 9 3 12 62
sex with men Countries
Median 1.69 2.71 1.28 1.39 1.49 0.9 0.72 1.22
Range 0.09–4.06 0.40-5.00 0.16–3.20 0.18–4.00 0.59–5.47 0.61-2.08 0.05-2.00 0.05–5.47
25–75 0.26–3.0 – 0.25–1.85 0.62–2.04 0.99–3.30 – 0.34-1.38 0.50–2.00
Percentiles
People who Number of 10 – 7 8 – 1 3 30
inject drugs Countries
Median 0.06 – 0.6 2.18 – 0.06 0.1 0.11
range 0.001–1.04 – 0.004–2.72 0.47–3.30 – – 0.05-1.60 0.001–3.30
25-75 0.03–0.16 – 0.03–1.58 1.11–2.97 – – – 0.05–1.41
Percentiles
Transgender Number of 3 1 1 – 5 – – 10
people Countries
Median 0.02 0.38 0.31 – 0.12 – – 0.11
range 0.02–0.06 – 0.03–0.42 – – 0.02–0.42
25-75 – – – – 0.06-0.18 – – 0.04-0.25
Percentiles
Source: Quick Start Guide for SPECTRUM Avenir Health, January 2017
Size Estimation of High-Risk Groups for HIV in India
White Paper on Mapping and Population
63 Review of MPSE methods
This section describes the main mapping and population size estimations (MPSE)
methods and discusses how they work as well as their respective strengths and
weaknesses.
The review of scientific literature and reports in the preparation of this paper has
focused mainly on experience with implementation of these methods in the past 10
years. However, additional readings are suggested in the bibliography section of the
paper.
Select examples from India and the Asia Pacific region as well as other parts of the
world are presented to understand advantages, limitations, challenges and lessons
learned in estimating the sizes of HRG by using different MPSE methods and tools.
Except for MPSE methods using representative population-based surveys, most of
these approaches are intended to produce estimates for smaller geographical areas.
Data for the MPSE may be collected directly from the HRG or from the general
population (WHO/UNAIDS 2010). Accordingly, MPSE methods are grouped into two
broad categories: Direct method and Indirect method (Table 3). In the direct method,
data is collected from the HRG. In the indirect method, data is collected from the
general population.
There are various methods of MPSE in each category. The methods under each
category have been described in the subsequent sections.
Table 3: Categories of MPSE methods
Direct method (data from/on Indirect method (data from
key populations) general population)
Wisdom of the crowds General population survey
Census/comprehensive mapping Network scale-up
Enumeration
Multiplier (programme/service/ unique object)
Capture-recapture
White Paper on Mapping and Population
7 Size Estimation of High-Risk Groups for HIV in India3.1 Direct methods
This section briefly describes the methodology for each of the direct methods mentioned in the
table above. For further details on any of these methodologies, the guidelines and publications
referenced in this document should be consulted.7
3.1.1 Wisdom of the crowds
The “wisdom of the crowds (WOTC)” considers that aggregate predictions from a large
crowd can be accurate and produce results which will be comparable to those obtained
from experts. As a size estimation method, WOTC assumes that HRG/ KPs are familiar
with the size of their population. One of the ways to implement WOTC is to ask survey
participants during a survey among HRG as to how many of their members live in a
specific geographical area. Then the mean or median of their responses is taken as an
estimated size of the population.
The WOTC method is based on a couple of key assumptions: (a) the people who are
sampled have unique information or perspectives about the population in question, and
(b) individual responses to the question are independent of each other so that in the
aggregate, extreme values tend to cancel each other out.
The strength of this method is that it is very simple to implement, requiring only the
addition of a few questions to an already planned survey, thereby adding very little cost.
The weakness of the method is that it tends to produce low estimates with extremely
wide plausible ranges, possibly because people are knowledgeable about the sizes of
their own networks, but beyond those, their estimate is mostly conjecture.
Review of the literature indicates that this method has been used, along with other
popular MPSE methods, in a number of African countries including Ghana, Kenya and
Tanzania. Box 1 highlights their experiences with the WOTC method.
3.1.2 Census/comprehensive mapping
Through the census or comprehensive mapping methods, an attempt is made to count
every member in a population. This direct mapping and size estimations takes place by
visiting every hotspot and collecting information on the number of members of HRG/
KP associated with that hotspot. Generally, the field assessment team talks to several
key informants (including members of key populations and other key informants
who are knowledgeable of the local context and presence of vulnerability and risk
behaviours) to arrive at an estimated population size for each hotspot. Efforts are made
to complete the exercise in a short period of time to minimise the effects of migration or
mobility between areas.
However, these mapping methods must still account for double or multiple counting
among hotspots and sometimes adjust for other factors such as the frequency with
which HRGs visit hotspots and movements across different hotspots.
7
It is also important to mention that there are other direct MPSE methods described in the literature. For example, MPSE methods
like Reverse Tracking Method (RTM), Proxy Respondent Method (PRM), Respondent Driven Sampling (RDS), successive
sampling and Crosswise Method (CM) have been used in a few countries but are still under development. The suggested
reading after the reference section includes some of the papers on evolving methods of size estimation.
White Paper on Mapping and Population
Size Estimation of High-Risk Groups for HIV in India
8Box 1 Wisdom of the crowd
In Ghana, the WOTC method was utilised as part of the 2011 Ghana Men’s Study (Quaye et al.
2015). It was used in combination with other MPSE methods including mapping, unique object
multiplier, service multiplier and modified Delphi. These different methods were employed
in different stages involving an Integrated Bio-Behavioural Survey (IBBS), preceded by
literature review and a formative pre-assessment, and stakeholder consultations. Compared
to the other methods, WOTC produced significantly lower estimates of the number of MSM
and the confidence intervals of the estimates were abnormally wide across all study sites.
The WOTC method was also used in Nairobi, Kenya (Okal et al. 2013) and in Zanzibar, Tanzania
(Khalid et al. 2014) to estimate the size of FSW, MSM and IDU. In both cases, the method
was also used in combination with multiplier and other MPSE methods and integrated into an
already planned IBBS survey among key populations. Like in Ghana, the estimates in Kenya
and Zanzibar, using WOTC were significantly lower than those produced by using other MPSE
methods, and the confidence intervals of the estimates were very wide.
In all three cases, the WOTC method was used in a survey among HRG, as this is a necessary
precondition for its application.
Wherever the population of interest is well-defined and visible, census or
comprehensive mapping is thought to provide better results than other methods. It
specifically works well for relatively smaller geographical areas. It is not that suited for
geographically large or diverse areas where HRGs are more scattered. One of the major
limitations of census or comprehensive mapping method is that its implementation is
costly and time consuming.
The method is also not well suited for estimation of the size of populations that are
more ‘hidden’ and do not frequent physical venues or hotspots much.
In the past, a number of countries in Asia including India, Bangladesh and Nepal carried
out MPSE among various HRGs using various mapping methods. Box 2 highlights their
experiences.
3.1.3 Enumeration
Whereas census or comprehensive mapping aims to map all the locations and estimate
all the members of a given population group at these locations, enumeration develops
a sampling frame and estimates all the members within selected units (preferably
randomly selected with stratifications) of the sampling frame. For example, in a city, a
small number of brothels, bars, lodges or other hotspots can randomly be selected to
arrive at the average number of FSW per brothel, per bar and per lodge to estimate the
total number of FSW in the city by extrapolating it to the entire sampling frame of FSW
for the city.
The enumeration method has the advantage of involving a simple calculation which is easy
to understand, but it may not perform well for the hidden components of HRG. Enumeration
shares similar advantages and disadvantages with census and comprehensive mapping. The
additional benefit however is that, as it tends to cover a smaller fraction of the population,
it requires fewer people and lesser time to implement. The experience with use of the
enumeration method in India and Rwanda is illustrated in Box 3.
White Paper on Mapping and Population
9 Size Estimation of High-Risk Groups for HIV in IndiaBox 2 Mapping
India carried out a large-scale comprehensive mapping exercise in 2008-09 among HRG
including FSW, MSM and IDU across 17 major States. A similar exercise in selected
States including Andhra Pradesh and Karnataka was undertaken in 2010-11. In 2013, a
comprehensive mapping among hijra/ transgender (male-to-female) people was carried out
across 17 major States. These mapping studies covered only “visible” HRGs.
Bangladesh carried out a mapping exercise in 2015 (NASP, 2016) covering all the major HRGs
including FSW, MSM, male sex worker (MSW), hijra/TG and IDUs. It covered 21 districts of
the country and extrapolated estimates for the remaining 43 Districts. One of the major
challenges was the significant hidden component of HRGs, particularly among MSM and IDU.
Efforts to account for the missing component using an adjustment factor was challenging.
Nepal undertook a similar mapping exercise in 2016 (NCASC, 2017) among FSW, MSM,
MSW, Hijra/TG and IDU across 44 selected districts (out of a total 75 Districts). Districts
were selected in a way to ensure representation from different epidemiological as well as
ecological zones so it could be extrapolated for the remaining 31 Districts. Nepal also faced
challenges in estimating the size of hidden sub-groups in MSM, IDU and FSWs, especially
home-based FSW who mainly operate through mobile phones.
Box 3 Enumeration
As part of a collaborative study on “Heterogeneity of the HIV Epidemic in North-Eastern States
of India” in 2002-03, NACO carried out a population size estimation exercise among injecting
drug users (IDUs) in five North-Eastern States. Enumeration was used to estimate the size of
this HRG in two cities including Imphal (Manipur) and Shillong (Meghalaya). Injecting sites
were mapped and listed and nearly one-third of these were randomly selected for visits by
field enumeration teams. The total number of IDUs at each site was estimated through direct
observation and key informants interviews. The mean number of IDU per site was calculated
and applied to the entire list of injecting sites to arrive at the total estimated size of IDUs in the
city. The main challenge of using this method was to reach out and enumerate IDUs who were
not frequenting known injecting sites.
In Rwanda, enumeration was used in 2010 to estimate the size of FSW across all provinces
of the country (Mutagoma, 2014). Each province was divided into three separate strata: bars,
brothels and streets. A sample of bars, brothels and streets from each stratum was randomly
selected and visited by the field teams. They identified and counted FSW at each randomly
selected physical hotspot. The average number of FSW was then calculated for each stratum
and applied to the entire province to estimate the size of FSW in a province. The stratification
process helped improve the accuracy of the size estimates however, FSW not frequenting
physical venues or hotpots were not covered.
White Paper on Mapping and Population
Size Estimation of High-Risk Groups for HIV in India
103.1.4 Programme multiplier
In general, programme multiplier methods rely on having information from at least
two data sources that overlap in a known way. More specifically, in the case of the
programme multiplier, the first source should be a count or listing from programme data
(e.g., number of FSW who visited the programme STI clinic in the last month, number
of MSM who visited the programme Drop-in Center in the last one month). The second
source should be a representative survey among members of the key population whose
size is being estimated (e.g. BSS, IBBS). In the survey, each respondent will be asked
whether they received the specific service. Several alternative programme multipliers
can be considered for a size estimation exercise depending on availability and quality of
programme data.
Calculation of the estimated size, based on the programme multiplier, is mathematically
very simple. The size is derived by multiplying “number of members of a given
population who attend a specific programme service” over a defined period of time by
“inverse of the proportion of the same population group who responded (in the survey)
that they attended the same service” during the same period of time.
Estimated size = n *(1/p)
where:
n is the number of HRG members who accessed a specific service during a defined
period of time.
p is the proportion of members of key populations who reported having accessed
the same service during the same time period in a representative survey among that
population.
Programme multiplier method is one of the most popular and widely used methods in
the recent past, particularly after the publication of the last size estimation guideline by
UNAIDS/WHO in 2011 (Wesson, 2017). Its popularity is mainly due to its simplicity and
straightforwardness. However, this method requires good quality programme data (first
source) as well as appropriate questions inserted into a good quality, representative
survey with a well-designed survey instrument (second source).
One of the major challenges in implementing the programme multiplier method
correctly is finding data for the two sources that correspond with one other. One of
the important factors behind successful use of the multiplier method is the need to
have clear, consistent definitions between different data sources. First, the population
definitions must be clear and consistent. Second, the time reference period must be the
same in both data sources. Third, the age range of the populations to be compared must
be similar. Finally, the catchment area for the services or institutions must be clear and
should ideally be the same as that covered in the sub-population survey from which
multipliers are derived.
3.1.5 Unique object multiplier
In the case of the unique object multiplier method, the first source should be a count of
unique objects (e.g., unique key ring, hand band etc.) distributed among the members
of a given HRG whose size is being estimated shortly before the survey (e.g. one week
before). The second source should be a representative survey (e.g., BSS, IBBS) of the
population. In the survey, each respondent is, then, asked whether they received the
unique object during the week before the survey.
White Paper on Mapping and Population
11 Size Estimation of High-Risk Groups for HIV in IndiaEstimated size = n *(1/p)
Where:
n is the number of unique objects distributed among members of the relevant
population group during a defined period of time.
p is the proportion of members belonging to that same population who report in a
representative survey having received the same unique object during the defined period.
Like the programme multiplier, the unique object multiplier method is one of the most
popular and widely used methods in recent years, particularly in areas where there
is no programme intervention and no opportunity to use a programme multiplier
approach. Applying the method requires a survey among HRGs but is, in this case, quite
cost effective. This method is dependent on: good record keeping of distribution of
unique objects through different channels, as well as use of a “unique object” that will
memorable to the recipient, and that will unlikely be mistaken for any other object or
passed on to another person because it is attractive.
Box 4 Programme multiplier
In India, the programme multiplier method was used as part of the Integrated Bio-Behavioural
Assessment (IBBA) implemented under the Avahan Project in 2006-07. This method was used
for estimation of the size of FSW in five districts in Maharashtra, five districts in Tamil Nadu and
three Districts in Andhra Pradesh. For MSM, this method was used in four Districts in Andhra
Pradesh, three Districts in Tamil Nadu and one District in Maharashtra. Based on participatory
consultations with programme staff and a review of existing programme monitoring data,
indicators for “exposure to Avahan interventions” were selected to be used as programme
multipliers including (1) registration with the project, (2) contacted by peer educator or outreach
worker in the past one month, (3) received a new health card in the last three months and (4)
visited Avahan clinic in the past three months. Although the survey instrument was sufficiently
specific in asking respondents if they had been exposed to specific Avahan interventions, some
respondents were not aware as to who had provided the services they had received. This was
due, in part, to the varying intensity of branding of project activities by the State level and NGO
partners, and that in some Districts, various NGOs were providing the same type of service,
which made it difficult for clients to differentiate between services provided by different
providers (Vadivoo, 2008).
In Myanmar, the programme multiplier method was utilised in 2013-14 to estimate the size of
IDU/PWID in 10 townships spread across the country including in Yangon, the capital city. This
was a population size estimation effort undertaken in connection with Myanmar’s first ever IBBS.
Three different “exposure to interventions” indicators were used as programme multipliers: (1)
received an HIV test from a specific NGO in the past three months, (2) visited Drop-in Center of
a specific NGO in the past three months, and (3) received methadone treatment from a specific
health facility in the past three months. The main challenge was to explain the differences in
estimates produced by using the three different programme multipliers as well as other size
estimation methods such as unique object multiplier and Delphi method. Consensus on final
size estimation for each township was reached through triangulation and analysis of results and
consultations among various stakeholders. Furthermore, an extrapolation method was applied
to estimate the size of IDU/PWID at national scale by using results from the 10 townships
covered by the IBBS (Myanmar MoH, 2014).
White Paper on Mapping and Population
Size Estimation of High-Risk Groups for HIV in India
12One of the major challenges in implementing the unique object multiplier is the
inability to track the exact number of unique objects distributed to members of a given
population. There are many possibilities for over- or under-estimation related to the
distribution of the objects. For example, individuals receiving more than one object,
not recalling receiving the object, passing the object on to another person as well as
fewer objects distributed than thought, or objects distributed to people who are not
eligible for the survey can all lead to over-estimation of HRG size. People reporting
having received the object, when they did not, or people who received the object
being more likely to have participated in the survey than those who did not which is
particularly an issue when peer outreach workers recruit regular clients as recipients
of the unique object, can all lead to under-estimation. The last is a common reason for
under-estimating the population size when the multiplier method is used, because it
violates the assumption of independence of the two sources used for the calculation. It
happens when the survey is not random and there is a greater likelihood of inclusion of
Other people exposed to programme interventions challenges with the unique object
multiplier method include differences in definition, reference period, or catchment
areas used for the two data sources.
3.1.6 Capture-recapture method
Like the multiplier method, the capture-recapture (CR) method also involves tagging
people in two overlapping data sources. Based on a method first used to estimate sizes
of animal populations (such as the number of fish in a pond), this method is sometimes
referred to as ‘mark and capture’ or ‘capture and release’.
The standard steps for implementing CR method are as below:
ŹŹ Prepare an exhaustive list of the sites where the population can be found, based on
information collected during mapping or sampling frame development exercise of BSS.
ŹŹ Visit all the sites and tag all members of the population found at the site. Keep a
count of the persons tagged (C1).
ŹŹ Re-visit all the sites one week later and tag all the members encountered during
the second visit.
ŹŹ Keep a count of the persons tagged during the second visit (C2).
ŹŹ Identify and count the persons who were tagged twice, both in the first and second
visit (R).
The three key counts mentioned above i.e. total Captureed in Captureed in
list 1 only list 2 only
number of persons captured during the first visit
(C1), total number of persons captured during
the second visit (C2) and total number of persons Not
captured twice (R)–in both first as well as second captureed
captures - are used to estimate the population
size using the following simple mathematical Not
formula: captureed
Captureed in
list 1 and 2
White Paper on Mapping and Population
13 Size Estimation of High-Risk Groups for HIV in IndiaN = (C1 * C2)/R
Where:
N is the estimated total population size.
C1 is the total number of persons captured on the first visit.
C2 is the total number of persons captured on the second visit.
R is the total number of persons captured on both the visits.
Box 5 Unique object multiplier
Bill and Milind Gates Foundation (BMGF) funded ‘Avahan Project’ integrated the unique object
multiplier method as one of the MPSE methods in the IBBA conducted in 2006 and 2009 as
part of the overall evaluation framework of the Avahan Programme. This was implemented
in the following five States of India: Andhra Pradesh, Maharashtra, Tamil Nadu, Manipur and
Nagaland. The method was used for estimating the size of FSW in 16 Districts, for MSM in 10
Districts, and for IDUs in three districts in the North-East region. The main challenge was to
keep track of the number of unique objects Distributed. Also, some respondents could not
remember correctly in the survey whether they had or had not received the unique the object
as the uniqueness of the object was questionable (Vadivoo, 2008).
Myanmar used the unique object multiplier method in 2013-14 as part of an IBBS conducted
among IDU in 10 townships of the country including the capital city. Plastic bracelets in different
colors with a “Getting to Zero” label were used, because of their uniqueness and simplicity. The
distribution took place just one week before the survey and the unique objects were distributed
in a way that tried to avoid survey participants to receive more than one bracelet. However,
there was still a major challenge in documenting the exact number of bracelets distributed.
There were also challenges in explaining why the size estimates of IDU was smaller by this
method than for the other MPSE methods used in the same survey, in most of the townships
(Myanmar MoH, 2014).
In the CR method there are four key assumptions that need to be fulfilled to produce rigorous results:
1 2 3 4
Samples are Each member of The individuals identified There is no major
independent the population in both captures are in-migration or out-
from each has an equal correctly identified as migration from the
other and not probability of recaptures, and no one population between
correlated. being captured. else is identified as a the first and second
recapture. captures.
White Paper on Mapping and Population
Size Estimation of High-Risk Groups for HIV in India
14A simple two-stage sample capture-recapture method is relatively easy to use, because it does not
require much data or statistical expertise. However, it is difficult to see all of the four underlying
assumptions fulfilled when this method is used to estimate the size of populations at higher risk, for HIV
infection. Fulfilling the last assumption is particularly challenging as most of the HRG populations are
prone to mobility and migration. These factors undermine the ability to perform good capture-recapture
exercise. These same limitations also apply to the programme and unique object multiplier methods.
Box 6 Capture-Recapture
In Thailand, an exercise using the Capture-Recapture method was carried out in 2015 to estimate
the size of MSM in Chiang Mai–the second largest city in Thailand, located in the northern part of
the country. Overall, eight key venues (i.e., two boy bars, two men massage parlours, two public
parks and two pubs frequented by MSM) were selected for two capture-recapture exercises. A
very short gap of one week was built in between the two captures and a brooch was used as a tag.
The main challenge in implementing the method was to satisfy all assumptions. Also, one week
between the capture and the recapture rounds was found be too short (Surit, 2016).
Capture-recapture method was also used in 2003-04 in Imphal, the capital of Manipur State
of India to estimate the size of the IDU population present in this major city of the North-East
Region of India. Nearly one-third of all injecting sites were randomly selected for the first capture.
Each of these sites were visited and all IDU present were tagged. Another random selection of
one-third of all injecting sites was performed independently from the first, for involvement in the
second capture after two weeks of the first tagging. Each of the selected sites was visited and all
the ‘matches’ were identified and counted. All other necessary information was recorded. The
main challenge was fulfilling the four key necessary conditions for the capture-recapture method
to work, particularly the second one. It was very difficult to ensure an equal probability of being
tagged for every IDU in each of the two rounds.
3.2 Indirect methods
Indirect methods collect data from the general population. Population survey and network
scale-up methods are two of indirect methods of MPSE using data collection from the general
population.
3.2.1 General population surveys
Indirect methods of MPSE are used primarily for producing MPSE of key populations
in relatively small geographical areas. However, in countries where large-scale
representative sample surveys involving the general population are regularly done (e.g.,
Demographic Health Surveys), this method can also be used for the same purpose. This
method use the proportion of respondents who respond “yes” to questions of whether
they have engaged in particular risk behaviours (i.e., paying for sex, having anal sex and/
or injecting drugs).
White Paper on Mapping and Population
15 Size Estimation of High-Risk Groups for HIV in India3.2.2 Network scale-up
A second method, using general population surveys, is network scale-up method (NSUM),
in which questions about High-risk behaviours among acquaintances of respondents
are asked as part of general population surveys. The biases include respondents’ social
isolation or their ignorance of High-risk behaviours (transmission error) among their
acquaintances. Also, estimating their personal network size is not always straightforward
and can be complicated for some respondents (Abu abdul-quader 2014). There is mixed
acceptance of the utility of network scale-up methods, as these methods appear to
consistently produce estimates that are considered too high (Wesson, 2017).
3.3 Summary of MPSE methods and lessons learnt
Critical review of experience and lessons learned in designing and implementing MPSE
using different methods underscores the point that there is no gold standard or flawless
methodology for MPSE. Each method has its own strengths and limitations, and the estimates
generated by different methods can vary substantially. Some methods are better for capturing
HRG population members who are often present in public venues. Others are more apt for
situations where a large number of them are either not present nor easily identifiable at
public venues. The strengths and weaknesses of various methods have been summarised in
Table 4 (Abdul-Quader 2014). In addition, the relevance of some of the methods has become
increasingly limited in the context of the changing dynamics, where High-risk contacts and
interactions increasingly occur outside of physical locations through chatting and dating tools
and apps, via the internet or smartphones.
Besides the well-established methods as recommended by United Nations documents, there
are few other methods which has been implemented in one or other ways for population
size estimation. For example, the successive sampling (SS) size estimation method relies on a
Bayesian model that uses prior knowledge from local experts or population size estimates from
previous studies, in conjunction with observed data from a respondent driven sampling (RDS)
study to estimate likely population sizes. The population sizes estimated through this method
are presented as a distribution with means, median and probability intervals, rather than a
point estimate and confidence intervals.
As there is no gold standard, experts have recommended that multiple methods be used to
generate multiple estimates, and then triangulated, in order to reach a point estimate. The
Delphi method has usually been used to synthesize the results of the various methods resulting
in some midpoint or median among the available estimates. While estimating the size of the
HRG population in Kenya, Okal et al. used modified Delphi during the analysis phase. For this,
they convened a workshop with a variety of stakeholders to synthesise the new information
and the estimates gathered during the study to interpret results. At the workshop, preliminary
point estimates for population sizes, were presented, median estimate of all methods used
identified and feedback and expert opinions elicited. In addition, upper and lower plausibility
bounds for the estimates were established based on the shared local and international data.
White Paper on Mapping and Population
Size Estimation of High-Risk Groups for HIV in India
16You can also read