Who drives on ride-hailing platforms in Latin America? - A profile of Uber drivers in Brazil, Chile, Colombia and Mexico
←
→
Page content transcription
If your browser does not render page correctly, please read the page content below
Who drives on ride-hailing
platforms in Latin America?
                                       Labor Markets Division
A profile of Uber drivers in Brazil,
Chile, Colombia and Mexico

Oliver Azuara
Stephanie González                               TECHNICAL
Lukas Keller                                       NOTE Nº
                                              (IDB-TN-1779)

                                              September 2019
Who drives on ride-hailing platforms in Latin
America?

A profile of Uber drivers in Brazil, Chile, Colombia, and Mexico

Oliver Azuara
Stephanie González
Lukas Keller

September 2019
Cataloging-in-Publication data provided by the
Inter-American Development Bank
Felipe Herrera Library
Azuara, Oliver.
Who drives on ride-hailing platforms to drive in Latin America?: a profile of Uber drivers in
Brazil, Chile, Colombia, and Mexico / Oliver Azuara, Stephanie González, Lukas Keller.
p. cm. — (IDB Technical Note ; 1779)
Includes bibliographic references.
1. Ridesharing-Latin America. 2. Taxicab drivers-Latin America. 3. Flextime-Latin
America. I. González, Stephanie. II. Keller, Lukas. III. Inter-American Development
Bank. Labor Markets Division. IV. Title. V. Series.
IDB-TN-1779

http://www.iadb.org

Copyright © 2019 Inter-American Development Bank. This work is licensed under a Creative Commons IGO 3.0 Attribution-
NonCommercial-NoDerivatives (CC-IGO BY-NC-ND 3.0 IGO) license (http://creativecommons.org/licenses/by-nc-nd/3.0/igo/
legalcode) and may be reproduced with attribution to the IDB and for any non-commercial purpose. No derivative work is allowed.

Any dispute related to the use of the works of the IDB that cannot be settled amicably shall be submitted to arbitration pursuant to
the UNCITRAL rules. The use of the IDB's name for any purpose other than for attribution, and the use of IDB's logo shall be
subject to a separate written license agreement between the IDB and the user and is not authorized as part of this CC-IGO license.

Note that link provided above includes additional terms and conditions of the license.

The opinions expressed in this publication are those of the authors and do not necessarily reflect the views of the Inter-American
Development Bank, its Board of Directors, or the countries they represent.
Who drives on ride-hailing platforms in Latin
                    America?
 A Profile of Uber Drivers in Brazil, Chile, Colombia, and
                          Mexico

                                                Abstract
Digital platforms can improve the functioning of markets characterized by coordination problems and
high levels of fragmentation, such as the transportation market. In recent years, the adoption of digital
platforms across Latin America (Latam), notably in the ride-hailing sector, has been considerable. This
expansion may increase the availability of better job alternatives for workers in the region, which is
characterized by high levels of informality and citizen’s insecurity. To evaluate the viability of this
hypothesis, we explored the characteristics of Uber drivers (UDs) by combining Uber administrative
data with a survey designed and applied for this project. The characteristics we analyzed include
drivers’ past and current labor profiles, labor aspirations, and financial behaviors. We found that the
average UD in Latam is male, 38 years old, and highly educated. Most drivers have no previous
experience in the transportation sector. The mean duration of use of the platform is 19 hours per week,
and the majority of UDs use it less than 30 hours per week. The average hourly gross income for UDs
utilizing the platform is three times a given country’s hourly minimum wage, with slight disparities by
country, gender, and age. The main reasons cited for joining the platform are the ability to generate
more income and have work more flexible working hours. Only 40% of drivers would choose to work a
fulltime job (that provides the same total income from all sources) over driving for Uber. The majority of
UDs are financially stretched or insecure and show low levels of retirement preparedness. However,
UDs have a strong desire to accumulate more savings, at least in the short term. Based on these
findings, we suggest different policy alternatives to leverage ride-hailing platforms to improve the lives
of their drivers in Latin America, including facilitating the participation of women and migrants as drivers,
promoting financial inclusion and financial literacy, easing voluntary contributions to retirement products
and exploring alternatives to acquire coverage against multiple risks, including paying social security
contributions.

                By Oliver Azuara, Stephanie González and Lukas Keller

                                            October, 2019

The authors would like to thank Jesica Torres, Mariano Bosch and Carmen Pages-Serra for their
valuable input. Special thanks to Guy Levin and Elizabeth Mishkin for being vital partners in this project.
They helped to conceptualize the survey questionnaire, shared insightful comments through the
collection of the survey data and provided the Uber administrative data used in this paper. Under the
agreement granted by the IDB, Uber Technologies has the right to review the paper, solely to confirm
that confidential information is not being represented in a misleading fashion; to wit, they cannot seek
to dispute or influence the findings or conclusions of the paper. The opinions expressed in this
publication are those of the authors and do not necessarily reflect the views of Uber Technologies Inc.,
the Inter-American Development Bank, its board of directors, or the countries they represent.
2
Keywords
Administrative income. Total payout (inclusive of promotions and exclusive of Uber’s
      commission) that a driver received in the previous 4 weeks driving with Uber.
Digital platform. Plug-and-play business model that allows multiple participants (producers and
        consumers) to connect to it, interact with each other, and create and exchange value.
Financial inclusion. The pursuit to make financial services accessible to and affordable for all
      individuals and businesses, regardless of net worth and size, respectively.
Financial literacy. The education and knowledge associated with understanding how money is
      made, spent, and saved, as well as the skills and ability to use financial resources to make
      decisions.
Gig economy. Labor market configuration in which temporary positions are common and
      organizations contract with independent workers for short-term engagements.
Hourly income driving with Uber. Total payout earned in the last 4 weeks (28 days), divided by
      the total hours online on the Uber app in the same period. Payout includes any promotions
      and excludes commissions paid to Uber.
Hourly minimum wage. Country’s monthly minimum wage, divided by 40 weekly hours, and
      multiplied by 4.3 weeks. For the period covered by the survey, the monthly minimum
      wages in the four countries considered were, in local currency, CLP$288,000 in Chile,
      R$998 in Brazil, and COP$828,116 in Colombia. In Mexico, unlike in the other countries
      the minimum wage is set per workday. Hence, the monthly minimum wage reported here
      for Mexico was MXN$3,084, which is the product of multiplying MXN$102.68 (the daily
      minimum wage) by 30 (days in a month).
Hours online. Number of hours a driver was online on the Uber app in the previous 4 weeks.
Internal migration. Uber drivers who have been living in the city where they were surveyed for
       less than five years.
International migration. Uber drivers who were born in a different country from the one in which
       they were surveyed.
Self-reported income generated from other platforms. Total monthly individual income
       generated during the last month by working as a driver but using alternative ride-hailing
       platforms. This income was reported by the UDs surveyed.
Self-reported income. Total monthly individual revenue generated by driving with Uber, less
       Uber’s commission or service fee but including costs or expenses such as fuel costs. This
       income was reported by the UDs surveyed.
Social security. Protection for individuals and households, provided by a society, to ensure
       access to health care and guarantee income security, particularly in cases of old age,
       unemployment, sickness, work injury, maternity, or the loss of a breadwinner.
Uber. Ridesharing company that provides personal mobility by connecting drivers and users
      through a platform.

                                                                                                 i
JEL Codes
J18, J21, J24, J26, J4, J6, J8
iiIndex
I. Introduction ......................................................................................................................... 1
II. Latin America: Uber’s second biggest region for revenue ................................................... 2
III. The survey and complementary administrative data from Uber ........................................... 6
i. Who are Uber drivers in Latam? ..................................................................................... 7
ii. Life before Uber.............................................................................................................. 8
iii. Life with Uber .................................................................................................................11
iv. Motivation for driving with Uber ......................................................................................16
v. Financial behaviors and health of Uber driver partners ..................................................19
IV. Conclusions .......................................................................................................................23
References ...............................................................................................................................25
Annex I. Uber Drivers as Fraction of Total Drivers in Mexico.....................................................27
Annex II. Uber-IDB Survey Questionnaire .................................................................................29
iiiI. Introduction
I.1 Ride-hailing platforms are becoming an increasingly important alternative personal
transportation industry. The proportion of the adult U.S. population that reports having
used Internet-connected mobile apps that match them with individual drivers at least once
more than doubled between 2015 and 2018, from 15% to 36%.1 Globally, ride-hailing
companies, such as Uber and Didi, completed an estimated 24 billion rides in 2018, up 50%
from the previous year.2 Fueled by digital innovation and increased online connectivity, the
popularity of these services reflects the broader rise of on-demand online platforms as
intermediaries of supply and demand in various sectors of the economy.
I.2 The rise of ride-hailing platforms has derived from a service supply model that sets
relatively low barriers for drivers to start providing car rides through the platform.
Upon qualifying to drive with a platform, an individual can spend as much or as little time
driving as he or she prefers over any given time. This flexibility makes these platforms an
attractive way to generate income for many people, including those with no prior
professional driving experience. Hall and Krueger (2018) showed that only 20% of Uber
drivers (UDs) in the U.S. worked in the transportation industry in their previous job, and 28%
did so throughout their career.
I.3 The desire, among policymakers and researchers, to understand the broader labor
market implications of the on-demand economy has increased significantly. Many
scholars have focused on analyzing the impact of providing services through ride-hailing
platforms on labor decisions. The publication of a series of driver studies have offered
information about the hours of work, income, as well as the motivations and backgrounds
of participants in the ride-hailing platform economy. Most of these focused on developed-
country markets, such as the U.S., Europe, and Australia (see, for example, Hall & Krueger
2018, Landier et al. 2016, and Alphabeta 2019). Meanwhile, research focused on the labor
market implications of ride-hailing and other on-demand platforms in less developed
contexts is scarce.
I.4 Latin America (Latam) is one of the fastest-growing regions for ride-hailing
companies, but there is a gap in knowledge regarding the reasons for this growth
and perspectives on its future. There has been extraordinary demand for ride-hailing
platforms in Latam. Their business model has succeeded through a combination of different
elements, including geographic factors (high levels of urbanization and demand for
transportation solutions); regional characteristics of public transportation (Latam is the third-
largest car-owning region in the world); and, structural labor market conditions (high levels
of informality).3
I.5 For this report, IDB partnered with Uber Technologies, Inc. to better understand the
characteristics of participants in the ride-hailing industry in Latam. Although the
platform economy has grown significantly in the region in recent years, data on the
characteristics of individuals participating in it is very scarce. In 2018, IDB partnered with
Uber Technologies, Inc. to better understand the potential impact of on-demand platforms
on labor markets in the region. This report draws on an original survey, implemented in
collaboration with Uber, among a representative sample of 5,251 of its platform’s drivers in
1 Jiang (2019).
2 ABI Research (2018).
3 The average level of contributions in the four selected countries is 69%, with important differences by country.
See Labor Markets and Social Security Information System (https://www.iadb.org/en/sector/social-
investment/sims/home)
1Brazil, Chile, Colombia, and Mexico. Furthermore, Uber provided anonymized
administrative data on various characteristics (i.e., drivers’ earnings, hours worked), used
to validate and complement the survey data.
II. Latin America: Uber’s second biggest region for revenue
II.1 Latam is characterized by high levels of urbanization, a lack of efficient public
transportation, and millions of private cars. The region has experienced virtually
unprecedented urban growth during the last decades. By 2020, the total regional population
will exceed 660 million, 82% of which will be living in cities.4 This rapid urban growth has
yielded significant challenges in the form of poor urban planning and limited mobility.5 Such
challenges have compelled the population to rely on cars as a primary mode of conveyance,
which has intensified congestion in all cities throughout the region. The average duration of
an individual’s commute to work, via public transportation, is 3 to 4 hours, which represents
a loss of a minimum of 2 hours of wages.6 At the same time, the average mileage of cars is
the lowest in the world (see Figure II.1).
F IGURE II.1 T OTAL C ARS AND A VERAGE M ILEAGE BY REGION
Total Cars. Millions Miles Per Car. Thousands
300 14
12
250
10
Miles per Car (thousands)
200
Total Cars (Millions)
8
150
6
100
4
50
2
0 0
Europe US & Latin Japan / S. Middle East India Australia / Other Asia
Canada America Korea & Africa NZ
Source: UBER (2019).
II.2 These conditions have favored the network and liquidity model required by ride-
hailing companies to expand their service. Ride-hailing platforms increase their value
when they attract new platform users and deepens engagement with existing platform users.
Both dynamics grow the network scale and liquidity, which further increases the value of the
platform to existing drivers and users.7 This occurred in Latin America during recent years.
Citizens of the region need affordable, reliable, and safe transportation.8 Platforms allow for
4 Department of Economic and Social Affairs, Population Division (2018).
5 Ezquiaga Arquitectura, Sociedad y Territorio S.L. (2015).
6 IDB (2013).
7 Uber Technologies Inc. (2019).
8 LAC is the most violent region in the world. A total of 43 of the most violent cities in the world are in Latin America
and the Caribbean (IDB, 2019).
2route traceability, real-time verification of the driver’s location and approach, and the use of
electronic payments. Users much appreciate these characteristics, not only in the
megalopolis of the region but also in small- and medium-sized cities. The expansion of ride-
hailing platforms has occurred over the last three years, and Uber has taken the lead,
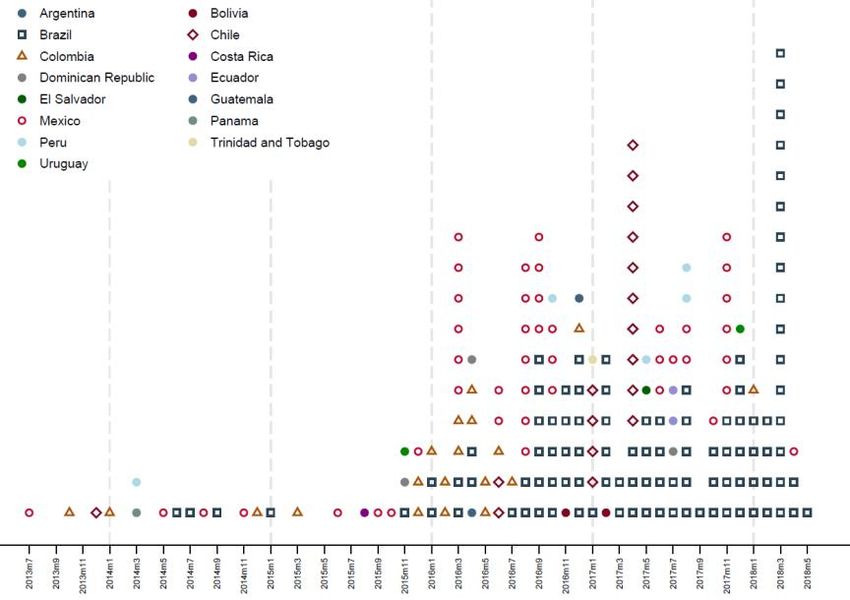
covering all of the main cities of Latam. Figure II.2 shows the expansion of Uber’s coverage
in the region since 2013. The company started operations in that year, but, between 2016
and 2018, it expanded its service to midsize and large cities in almost every Latin American
country.
F IGURE II.2 E XPANSION OF U BER IN C ITIES OF L ATIN A MERICA AND THE C ARIBBEAN
(M ORE THAN 100 T HOUSAND I NHABITANTS )
2013 2014 2015 2016 2017 2018
Source: UBER.
II.3 A total of 286 million people live in 598 cities in LAC. Uber was able to expand its
platform to cover 70% of this universe (34% of the cities) between 2013 and 2018. Of
the 15 countries in which Uber operates, only three have less than 50% coverage of cities
with a population of more than 100,000 inhabitants (Dominican Republic, El Salvador, and
Panama). By contrast, three countries have almost full coverage in large cities (above 85%;
Chile, Mexico, and Uruguay). Table II.1 provides more details on coverage, by country and
cities in the region.
3T ABLE II.1 C OVERAGE OF U BER IN LAC C ITIES
Population in Cities Uber Coverage in Cities
(>100K Inhabitants) (>100K Inhabitants)
Country
Population Cities Total Population
Cities
(millions) Number % Number %
Argentina 41 29.5 2 5% 16.2 55%
Bolivia 12 5.0 2 17% 3.1 62%
Brazil 279 111.6 101 36% 73.0 65%
Chile 23 11.6 17 74% 10.7 93%
Colombia 51 27.1 19 37% 20.8 77%
Costa Rica 4 2.2 1 25% 1.4 64%
Dominican Rep. 10 4.4 3 30% 1.6 37%
Ecuador 15 6.4 2 13% 3.4 52%
El Salvador 9 1.5 1 11% 0.2 16%
Guatemala 4 1.7 1 25% 1.0 57%
Mexico 120 66.2 44 37% 57.0 86%
Panama 6 1.2 1 17% 0.5 40%
Peru 22 16.7 5 23% 12.1 72%
Trin. & Tob. - - 0* 0% 0.0 100%
Uruguay 2 1.4 1* 50% 1.3 91%
Total 598 286.7 201 34% 202.4 71%
Source. UBER Technologies Inc.
II.4 Competition in the ride-hailing industry has been growing significantly in recent
years, both globally and in Latin America. Uber, as the leader in the industry, dominated
the ride-hailing market in Latin America during its most important growth phase between
approximately mid-2015 and late 2017. Since then, and following the entrance of a number
of competitors with equivalent business models, its overall market share, measured in terms
of its share of total quarterly ride-hailing app downloads, has declined from 74% (Q3/2017)
to 44% in the second quarter of 2019 (see figure II.3.A). Among the most important current
competitors of Uber in the region are 99 (20% download market share), Didi (10%), and
Beat (9%) (see figure II.3.B).
4F IGURE II.3 D ISTRIBUTION OF R IDE -H AILING A PPS IN LAC
A. Quarterly downloads B. Total downloads
Uber Otro
36
Millions
30
24
18
12
6
-
2014/Q3
2014/Q4
2015/Q1
2015/Q2
2015/Q3
2015/Q4
2016/Q1
2016/Q2
2016/Q3
2016/Q4
2017/Q1
2017/Q2
2017/Q3
2017/Q4
2018/Q1
2018/Q2
2018/Q3
2018/Q4
2019/Q1
2013/Q1
2013/Q2
2013/Q3
2013/Q4
2014/Q1
2014/Q2
2019/Q2
Source. IADB based on Sensor Tower Data.
II.5 The rapid expansion of Uber’s platform transformed Latam into Uber’s second most
important region in terms of revenue. Total worldwide Uber revenue increased from
US$3.9 billion in 2016 to 11.3 billion in 2018. This is exclusive to revenue generated by its
so-called “core platform”, which consists primarily of ridesharing and food delivery services.9
Latin America has played a major role in this increase, seeing revenue surge from US$0.5
billion to 2 billion over the same period. This means that the region increased its contribution
to the generation of total revenue from 13% to 18%, making LAC Uber’s fastest-growing
region worldwide in that period. Figure II.4 provides more detail on Uber’s distribution of
revenue by region over the last 3 years.
9 Uber Technologies Inc. (2019).
5F IGURE II.4 E VOLUTION OF U BER R EVENUE B ETWEEN 2016 AND 2018
12.0
1.0
10.0
Total Revenue (billions US$)
1.7
8.0
0.8
2.0
1.2
6.0
1.6
4.0 0.3
0.7 6.1
0.5
4.3
2.0
2.4
-
2016 2017 2018
US & Canada Latin America Europe, Mid. East & Africa Asia Pacific
Source. UBER (2019).
II.6 While the share of workers offering driving services through on-demand platforms is
still relatively low across Latin America, considering the previously described trends,
this share is set to increase markedly over the next decade. Household data from
Mexico shows that in the 43 cities in which Uber operated as of the first quarter of 2018, an
average of 0.1% of the employed population drove Uber at least part time.10 This compares
with an average of 0.9% of the employed population being registered as taxi drivers and an
average of 4% mentioning “driving” as their secondary occupation in these cities.11 The
trends concerning the growth of the on-demand ride-hailing suggest a significant increase
of the share of platform drivers vs. traditional taxi drivers in the region over the next decade.
III. The survey and complementary administrative data from Uber
III.1 Uber and the IDB contracted with Ipsos Public Affairs LLP to conduct a Web-based survey
among a representative sample of Uber drivers in Brazil, Chile, Colombia, and Mexico
between February and March 2019.12 These markets were selected on the basis of their
considerable potential variation in UD characteristics, as well as their combined importance
within the overall Latam Uber market. The four countries accounted for the majority of Uber’s
drivers in Latin America at the start of the survey. The final number of completed interviews
was 5,251, with the following distribution across countries: Brazil, 1,470 UDs; Chile, 1,387
UDs; Colombia, 1,152 UDs; and Mexico, 1,251 UDs.
III.2 The final version of the instrument comprised five modules: demographic characteristics;
life before Uber; experience with Uber; satisfaction with the platform; and financial behaviors
10 See Annex I.
11 Estimates using household surveys in the region.
12 We define UDs as those providing car rides through any one or more of the following services: UberX, SUV,
UberXL, Rideshare, Black, Uberselect, or Uberxselect.
6and health.
III.3 The total number of respondents to the self-administered questionnaire was 5,251. The
overall response rate was 9.5%, after accounting for the oversample of Chile and Brazil.
Our results also include the sample weights, calculated by Ipsos, to achieve a balance of
the characteristics used for the sampling process. Uber compared the distribution of
characteristics of the drivers using the weighted sampling weights with that of the total driver
population of interest and did not find any relevant differences between these groups,
including with respect to average work hours or hourly earnings.13
i. Who are Uber drivers in Latam?
III.4 The first module of the survey included a series of seven questions concerning general
sociodemographic characteristics of the respondents.
III.5 The average UD in Latam is male, 38 years old, and living with a partner in a four-
member household. In each of the selected countries, drivers are mainly male (94%) at a
prime working age (25-54 years, 83% of the sample), averaging 37.7 years of age. The
fraction younger than 25 years, as well as the fraction older than 54 are 9% and 8%,
respectively. Most of them are either married or cohabitating (65%), and their average
household size is 3.7 members. Table III.1 provides a summary of UD characteristics,
overall and by country.
T ABLE III.1 S OCIODEMOGRAPHIC C HARACTERISTICS OF UD S IN L ATAM
Characteristic Brasil Chile Colombia Mexico Total
1,152 1,251
Num
Uber drivers 1,470 1,378 3,781
% 28 26 22 24
Male (%) 95 91 94 94 93.5
Avg 37.2 37.9 38.1 37.7 37.7
Age
Med 35.9 36.0 37.1 36.6 36.3
Single (%) 25 34 25 22 27
Cohab. / married (%) 66 57 66 69 64
Avg 3.4 3.8 3.6 3.8 3.6
Num. Household members
Med 3 4 4 4 4
10 to 12 yrs of educ. 45 41 18 34 35
%
Terciary educ. / more 47 56 71 49 55
Internal 7.7 12.7 7.3 5.0 8.3
Migration (%)
International 0.5 10.4 1.5 1.9 3.7
Source. IDB-UBER Survey.
III.6 UDs have high levels of education. Around 90% of the surveyed UDs reported that they
had either a complete or incomplete secondary education level. About half of them reported
having completed tertiary education (more than 12 years of schooling). This percentage was
13
The Ipsos survey has a stratified design. Its weights were constructed to make the sample representative of all
drivers in terms of the services they offer. Other strata were designed in proportion to the population and are
self-weighting. All reported survey statistics are weighted to reflect the survey design.
7higher in Colombia, where 71% of all UDs had completed more than 12 years of education.
In other words, UDs are more educated than the general population in their respective
countries.14
F IGURE III.1 D ISTRIBUTION OF UD S BY E DUCATION LEVEL
Total observations: 5,251 (1,378 in Chile, 1,470 in Brazil, 1,152 in Colombia, and 1,251 in Mexico)
Source. IDB-UBER Survey.
III.7 Driving on the platform seems to be a particularly attractive economic activity for
international migrants, particularly in Chile. Around 8% of all drivers were not born in the
city in which they drive, and approximately 4% of drivers are international migrants, here
defined as being born in another country. Chile stands out in this regard, as more than 10%
of its UDs were born in another country. This fraction is significantly higher than the share
of international migrants in the total population (6.7%).15
III.8 Drivers are the primary income providers in their homes, and the income distribution
of UD households in each country is similar to that of the total population. UD
households are somewhat more concentrated in the middle part of the income distribution
than households at the national level. A relatively smaller proportion of UD households are
in the upper and lower parts of the income distribution.
ii. Life before Uber
III.9 The second module was designed to capture the work profile of UDs before they joined the
platform. It consisted of 11 questions, focused on the characteristics of the job(s) they had
or still have.
III.10 The majority of UDs were economically active before joining the platform. A large
proportion of UDs (73.5%) reported themselves as having been actively employed during
14 According to the national household surveys, 25% of Chileans reported having more than 12 years of education,
whereas in the case of Brazil, Colombia, and Mexico, this figure is 16.3%, 17%, and 16.3%, respectively.
15 See: https://www.extranjeria.gob.cl/media/2019/07/Estimación-Población-Extranjera-en-Chile.pdf
8the month before they joined the platform. Almost half of UDs were employed full-time in
that period; 21% were self-employed and 9% were employed part-time. UDs who had been
staying in the home as full-time parents or homemakers comprised up 2% of the sample,
and those who were retired, 2%16. There are significant differences by country. For example,
UDs who declared they had a full-time job ranged from 39% in Brazil to 57% in Chile; drivers
who described themselves self-employed before joining Uber made up 12% in Chile, 20%
in Mexico, 25% in Brazil and 27% in Colombia. Similarly, 7% were employed part time in
Chile, whereas around 11% held part-time jobs in Mexico and Colombia, and 9% did in
Brazil.
III.11 Among unemployed individuals and students, joining the platform was an
opportunity to generate income. The share of UDs who were unemployed the month
before starting to drive with Uber was 22% of all respondents. Brazil and Colombia had the
highest share, 28% and 24%, respectively; in Chile and Mexico, this share was 19% and
16%, respectively. A total of 7.5% of UDs were studying the month before they started using
Uber. This percentage was slightly higher in Colombia (9%) and Mexico (8%), and slightly
lower in Chile (7%) and Brazil (6%). It is worth noting here that almost half of those who
identified themselves as students were also economically active before joining the platform.
III.12 Most UDs who were economically active before joining the platform had only one job,
and less than half of them kept it after starting to drive with Uber. UDs who were
employed before starting to use the platform held an average of 1.2 jobs: 89% had only one,
8% had two, and 3% had three or more. A total of 38% of UDs kept their previous jobs.
According to Uber’s administrative records, of these, more than half use the platform for
fewer than 10 hours per week; 38% for an amount of time ranging between 10 and 30 hours
per week; and 9% spent more than 30 hours per week on the platform. The remaining 62%
changed their occupation or status: 29% of UDs left their job voluntarily, 20% involuntarily,
and 14% reported that their job ceased to exist.
III.13 UDs who kept their jobs after joining the platform drive half as many hours as those
who left their jobs, and they do this mostly during weekends. There are significant
differences across countries. For example, Mexican UDs who left their jobs after joining the
platform averaged 27 hours per week, whereas those who kept their jobs averaged 16 hours
per week. Similarly, Chilean UDs in the first group averaged 19 hours per week, and in the
second group, only 10 hours per week.
III.14 Drivers were more likely to have a formal job before joining the platform, relative to
the average for the selected countries.17 The share of UDs who reported having
contributed to a mandatory pension scheme the month before joining the platform was 55%.
The variation across countries in this regard is significant: whereas 71% of Chilean UDs
declared that they contributed to a pension system, only 23% did in Mexico; UDs in
Colombia and Brazil reported 68% and 58%, respectively. Another measure of informality
is whether the person and his or her employer pay contributions to a health system. In this
case, a total of 59% of UDs were formally employed the month before joining the platform,
with significant differences by country: Chilean and Colombian UDs reported rates higher
than 70%, whereas Mexicans reported 55% and Brazilians, 31%.
III.15 UDs were employed mainly in the service industry before joining the platform. The
majority of UDs were working in “other services” (42%). A total of 18% of UDs were working
in the transportation sector, with this percentage ranging from 14%, in Mexico, to 21%, in
16 These categories are not mutually exclusive.
17 Formality is defined as a job in which the person or an employer makes social security contributions.
9Brazil. A total of 11% of UDs was working in the manufacturing and construction sector, and
8% held jobs in the education and health industries.
III.16 The majority of UDs (60%) reported having no previous experience in the
transportation sector, and only 10% had experience as taxi drivers. This distribution
was similar in each country. Other relevant experience in the sector was gained by working
as private chauffeurs and in delivery services. UDs without previous experience as taxi
drivers reported having more years of education: 65% of them had at least some tertiary
education, whereas, among those with experience, only 41% had reached this educational
level. Furthermore drivers in the first group were 1.2 years younger than those in the second,
on average.
F IGURE III.2 UD E XPERIENCE IN THE T RANSPORTATION S ECTOR
Total observations: 5,251 (1,378 in Chile, 1,470 in Brazil, 1,152 in Colombia, and 1,251 in Mexico)
Source. IDB-UBER Survey.
III.17 UDs with previous experience as taxi drivers prefer driving on the platform. Between
60% and 75% of UDs with experience in the taxi industry reported feeling pride about
working with Uber. In the UDs’ opinion Uber clients are more respectful. Over 60% of UDs
reported that working with Uber has given them more independence and dignity, and they
declared having achieved a more stable income through the platform. To add up all these
dimensions for UDs with experience as taxi drivers, we created a “quality index.”18 A higher
index value indicates a better perception of their experience driving with Uber, relative to a
previous experience as a taxi driver. This index value was highest for Mexican UDs, followed
by Colombian, Brazilian, and Chilean UDs.19
18 The index was constructed using the five questions included to compare the experience of driving for Uber with
previous experience driving a taxi. This is meant to determine the level of agreement on the following
statements: (a) I feel greater pride working with Uber; (b) The clients I meet through Uber are more respectful;
(c) My earnings through Uber are more stable; (d) Working with Uber has given me more independence and
dignity; and (e) I make more money with Uber. The combination of dimensions was derived using the
Polychoricpca command in STATA, which displays the eigenvalues and eigenvectors from the principal
component analysis eigen decomposition. Regardless of the self-report bias, this index is indicative of the main
reasons for the level of satisfaction for those with experience with the two services.
19 This average is conditional on driving during the previous 4 weeks to the survey. According to the administrative
records of Uber, 2% of respondents did not drive during that period.
10iii. Life with Uber
III.18 The third module of the survey was designed to obtain a work profile of UDs since their
decision to work on the platform. It included 17 questions on issues such as job
characteristics, willingness to seek another job, reservation wage, use of other platforms,
current contributions to pension and health schemes, and additional insurance coverage.
III.19 UDs use the platform 19 hours per week on average, and the majority use it less than
30 hours a week. A total of 36% of UDs reported using the platform less than 10 hours per
week, and 42% reported between 10 and 30 hours a week. Only 22% use it more than 30
hours. Mexican drivers are the exception, with one-third using the platform in excess of 30
hours during the week.
F IGURE III.3 UD W EEKLY H OURS ONLINE D URING THE P REVIOUS M ONTH
Total observations: 5,161 (1,344 in Chile, 1,449 in Brazil, 1,136 in Colombia, and 1,232 in Mexico).
Source. UBER Administrative data.
III.20 UDs older than 55 years use the platform more heavily, relative to other age groups.
Drivers of prime working age averaged 19 hours a week, whereas UDs younger than 25
years averaged 16 and those older than 54 averaged 23 hours. The country for which the
percentage of UDs older than 55 years who were online more than 30 hours per week is
highest is Mexico (51%), whereas it is lowest in Chile (20%).
III.21 Half of UDs use the platform during the day, while one-third use it primarily on
weekends. The distribution of hours among drivers is as follows: day, 48%; night, 18%; and
weekends, 35%. The variation of platform use, according to time and age, is also significant.
Two thirds of UDs older than 55 use the platform during the day, whereas 46% of prime-age
UDs use it during the day. Younger UDs (18 to 25) are more likely to use the platform during
weekends (45%).
III.22 Only 7% of UDs are female, and they use the platform 14 hours per week, with
significant differences, relative to males. These include differences in the length and time
11of usage. Almost 90% of women use the platform less than 30 hours a week, compared to
77% of males. Similarly, most females use the platform during the day, compared to males
(54% females vs. 47% of males). There are also significant differences by country. In
Colombia, there are more differences between female and male UDs. Female UDs use the
platform less than 10 hours (52% vs. 37% of males) and do so mostly during the day (60%
vs. 48% of males). In the case of Brazil, the difference between genders manifests primarily
in which time of day they make use of the platform: 70% of females use it during the day,
compared to 56% of males. In Mexico, the difference between genders is mostly a matter
of the duration of use: 43% of females drive less than 10 hours per week, compared to 26%
of males. In Chile, the main difference is also in hours driven, as 60% of female UDs use
the platform less than 10 hours, compared to 45% of males.
III.23 Half of UDs reported having a job. One-quarter declared driving with Uber as their
only economic activity, and almost one-fifth considered themselves unemployed and
looking for a job.20 A total of 49% of UDs reported being employed full-time, part-time, or
self-employed. This percentage is quite similar across the four countries, with the highest in
Chile (55%) and the lowest in Brazil (45%). By contrast, there are important differences
across countries regarding those who reported use of the platform as their only economic
activity. The highest levels were in Mexico and Brazil (33% and 29%, respectively), and the
lowest were in Colombia and Chile (15% and 17%, respectively). Finally, a total of 18% of
respondents classified themselves as unemployed and looking for a job. Within this
category, there was a similar share of Colombian, Brazilian, and Chilean UDs (22%, 20%,
and 19%, respectively), whereas the share of Mexicans was the lowest (11%).
III.24 The proportion of UDs who have full-time jobs is similar to that of UDs who are self-
employed. A total of 22% reported having a full-time job, and 21% considered themselves
independent workers. In the first case, Chilean UDs reported the highest rate (32%). In the
second case, Colombians, Brazilians, and Mexicans showed the highest share (26%, 23%,
and 20%, respectively), whereas Chileans showed the lowest (only 14%). For the case of
UDs with part-time jobs, the overall share was 9%, with the four countries having similar
values.
III.25 The average hourly income generated using the platform during the month before the
interview was US$11.6, with some differences by country, gender, and age.21 Each
driver determines the hours online and he can reject (or ignore) dispatches while remaining
online. The variation in usage of the platform is reflected in the variation in earnings. The
administrative records show a similar average hourly income in Mexico and Chile (US$12.6
and US$12.4, respectively) and a lower income in Brazil and Colombia (US$10.9 and
US$10.5, respectively). In terms of gender, males make US$0.64 (6%) more than females
in the four countries.22 This difference is more prominent in Brazil (US$1.45, or 15%),
followed by Colombia (US$0.79, or 8%), Mexico (US$0.69, or 6%), and Chile (US$0.40, or
3%). Finally, in terms of age, UDs between 18 and 24 earn, on average, US$0.89 more than
the average hourly wage of all Uber drivers. When considering individual countries, Mexico
and Chile stand out. In these two countries, young UDs earn US$1.04 and US$2.53,
respectively, more than the average driver in the country.
20 UDs were asked to classify their labor status using the following categories: employed full time; employed part
time; self-employed; student; unemployed looking for a job; long-term sick or disabled; homemaker; retired; only
Uber; other. These categories are not mutually exclusive.
21 These numbers are based on administrative records provided by Uber Inc.
22 This value is similar to one reported by Cook et al. (2018).
12F IGURE III.4 UD Q UARTILE I NCOME D ISTRIBUTION P ER H OUR U SING THE P LATFORM *
(USD, PPP**. After commissions, but before expenses such as fuel costs)
Total observations: 5,161 (1,344 in Chile, 1,449 in Brazil, 1,136 in Colombia, and 1,232 in Mexico)
* The variation in the usage of the platform is reflected in the level of hourly income generated by drivers.
** Income is USD adjusted by purchasing power parity (PPP), constant 2017 International US dollars. IMF
World Economic Outlook, April 2019.
Source. IDB-UBER Survey.
III.26 The majority of UDs included in the survey under-reported the monthly revenue they
generated by driving with Uber. Comparing self-reported data with Uber’s administrative
data, 68% of Mexican UDs reported a lower income, followed by Colombia (62%), Chile
(54%), and Brazil (50%). The median proportions between the revenue gap (self-reported
revenue minus administrative income) by country are as follows: -31% in Mexico, -24% in
Colombia, -8% in Chile, and 1% in Brazil.
13F IGURE III.5 UD I NCOME P ER H OUR . S ELF -R EPORTED VS . A DMINISTRATIVE R ECORDS
(USD, PPP. After commissions, but before expenses such as fuel costs)
Total observations: 3,560 with self-reported and administrative income information (825 in Chile, 1,078 in Brazil,
709 in Colombia, and 948 in Mexico)
Income is USD PPP (constant 2017 International US dollars). IMF World Economic Outlook, April 2019.
Source. IDB-UBER Survey.
III.27 In each country, UDs’ hourly earnings from driving with Uber–including any
promotion and excluding Uber’s commission–are at least three times the national
hourly minimum wage. In Chile and Colombia, they earn almost three times the hourly
minimum wage. This figure is 3.9 and 6.5 times in Brazil and Mexico, respectively. These
differences do not consider additional costs covered by UDs, including fuel costs and
insurance.
III.28 Only 40% of UDs would stop driving with Uber if they were offered full-time salaried
work that provides the same total income (from Uber and other labor sources). The
monthly salary they report to require taking another job is more than two times -on
average- what they currently make using the platform.23 UDs declared a hypothetical
wage they would ask for to stop driving with Uber and accept a full-time salaried job that
provides the same total income. The largest share of drivers who would accept a job was in
Colombia (51%), and the lowest was in Chile (33%). In these countries, the average monthly
income that they would require to make this decision is US$2,030 and US$2,415
respectively, which is 3.3 times what they currently make through the platform. In Mexico,
the minimum income they would accept is US$1,960 (2.4 times what they now make) and
in Brazil, US$3,915 (almost 2 times what they currently make, using the platform).
23 These numbers were obtained by comparing the desired income level and the response on the income
generated through the platform. In both cases, the income distribution was trimmed to eliminate the 99th
percentile.
14F IGURE III.6 UD R ESERVATION W AGE . A MOUNT N EEDED TO S TOP D RIVING
Total observations: 1,098 would stop driving (287 in Chile, 491 in Brazil, 190 in Colombia, and 130 in Mexico)
Income distribution was trimmed to the 99th percentile.
Income is USD PPP (constant 2017 International US dollars). IMF World Economic Outlook, April 2019.
Source. IDB-UBER Survey.
III.29 A total of 28% of Uds reported using another rideshare platform, in addition to Uber,
with differences by country. The reported income generated through those platforms
is lower, overall, relative to Uber. The use of other platforms varies significantly by
country: half of the Brazilian drivers (99); one-quarter in Colombia (Cabify); one- fifth in Chile
(Beat and Cabify); and one sixth in Mexico (Didi). Of those using other platforms, Brazilian
and Mexican UDs reported generating a higher median income using Uber (33% more).24
Chilean and Colombian Uds who use other platforms reported generating the same median
income with both platforms.
III.30 A third of UDs currently contribute to a pension system, and less than half to a health
system. Drivers reported whether they made contributions to a pension system during the
last month. The lowest share was in Mexico (11%) and the largest in Colombia (36%) for all
drivers. For drivers with no other source of income aside from Uber, the shares were lower:
4% in Mexico and 22% in Colombia. Similarly, they reported whether a health system
currently covers them. In this regard, the lowest share was in Brazil (22%) and the highest
in Colombia (71%) for all drivers. For drivers with no other source of income aside from
Uber, the shares were also lower: 14% in Brazil and 58% in Colombia. In other words, many
drivers are covered through other jobs, making the total level of coverage significantly lower
compared to the total population.25
III.31 Less than a fifth have life insurance, and more than half have liability/accident
24 The calculation was made based on the sample of drivers who reported their income with both Uber and other
platforms. In both cases, the income distribution was trimmed to eliminate the 99th percentile.
25 The most recent comparable data of the percent of salaried workers contributing to social security (18-64
years old) in the selected countries is the following: Brazil (2018), 78%; Chile (2017), 84%; Colombia (2018),
69%; Mexico (2018), 44%.
15insurance. The survey also asked UDs about the coverage for risks related to the operation
of the vehicle used for driving with Uber, including life and liability/accident insurance. The
share of UDs with the first was meager, with Mexican drivers having the highest level (21%)
and Brazilians the lowest (18%). In the case of liability/accident insurance, the share was
significantly higher (58%), but the distribution by country was similar, with Mexico having
the highest (76%) and Brazil the lowest (48%).
III.32 Only half of UDs in LATAM own the cars used to drive on the platform. A total of 53%
reported owning their vehicle, and 22% reported using a vehicle owned by a close family
member. Further, a total of 15% either use a car owned by a third party (e.g., an employer)
or lease the car. Mexican UDs are outliers in this field, as 23% rent the vehicle from a third
party.
F IGURE III.7 C AR O WNERSHIP
Total observations: 5,251 (1,378 in Chile, 1,470 in Brazil, 1,152 in Colombia, and 1,251 in Mexico).
“Other” includes 336 UDs who declared that the car owner is a relative and 126 who declared it belongs to a friend.
Source. IDB-UBER Survey.
iv. Motivation for driving with Uber
III.33 The fourth module of the survey describes the primary motivations for driving with Uber, if
the real experience met these expectations, and how likely it is they keep using the platform
in the future. It included a total of four questions.
III.34 Earning more income and having more flexible working hours are the main reasons
to start using the platform. UDs were asked to think back and reflect on the time that they
decided to start driving with Uber and identify critical goals that guided their decision to start
driving with Uber. They ranked ten different alternatives from the most salient to the least
important.26 The top three reasons were: (i) earn more income (76%); (ii) have more flexible
26
These included: (1) Earn more income; (2) Maintain a stable income; (3) Have more flexible working hours; (4)
Be my own boss; (5) Have more leisure time for myself; (6) Work with better and more respectful
clients/passengers; (7) Work with a respectable, international company; (8) Further my personal development
16hours (66%); and (iii) be his/her own boss (63%). This distribution of reasons was similar
across countries, with Mexican UDs showing higher shares for all three goals.
F IGURE III.8 M AIN R EASONS TO J OIN THE P LATFORM
Total observations: 5,251 (1,378 in Chile, 1,470 in Brazil, 1,152 in Colombia, and 1,251 in Mexico)
Source. IDB-UBER Survey.
III.35 Personal development through use of the platform and driving for a respectable
international company are additional reasons to drive with Uber that received fewer
mentions by primary drivers. A total of 41% of respondents declared that personal
development had a significant impact on their decision. In terms of working with an
international company, the average was also 42%, with slight differences by country. In
Mexico and Brazil, drivers valued this reason more (48%), whereas in Chile and Colombia,
they valued it least (36%).
(soft skills, technological capacity, social interactions, etc.); (9) Feel safe driving with the Uber platform thanks
to the technology; and (10) Continue earning money after losing the job.
17III.36 Uber Drivers are generally satisfied with their experience of using the platform, but
they express some disappointment regarding the amount of income generated
through its use. UDs were asked to rate their level of satisfaction about their experience
driving with Uber by classifying the ten original reasons they had for doing so. They ranked
each reason using three possible answers (disappointed, satisfied, and more than satisfied).
About half of the UDs declared satisfaction with the platform in relation to each reason
included on the list, one third said their experience surpassed their expectations, and 20%
were dissatisfied. UDs showed their highest level of dissatisfaction with regards to their
expectation to generate a higher and more stable income using the Uber app. In fact, when
UDs were asked what employment aspects would make them accept another job and stop
driving with Uber, 80% mentioned that earning more income would be one of such aspects.
F IGURE III.9 E XPECTATIONS VS . R EALITY . S ATISFACTION
Total observations: 5,251 (1,378 in Chile, 1,470 in Brazil, 1,152 in Colombia, and 1,251 in Mexico)
Source. IDB-UBER Survey.
III.37 About 40% of UDs plan to keep driving for the foreseeable future, with one-third
agreeing, but only until something better comes up; 6% reported that they plan to
stop soon, and 13% indicated that they did not know. This module ended by asking UDs
whether they plan to keep using the platform: 38% plan to keep driving for the foreseeable
future; 34% plan to drive until a better opportunity arises; 9% intend to keep driving until
they made a certain amount of money and 6% claimed that they would probably stop driving
soon. Considering variation in these percentages by country, 52% of the Brazilian UDs plan
to keep driving for the foreseeable future, which represents a divergence of almost 20
percentage points from the UDs in Chile, Colombia, and Mexico. The percentage of those
planning to stay until something better comes up is virtually the same across all countries.
Meanwhile, there is considerable variation in the percentage of those who plan to stop
driving soon across countries: Colombian UDs were most inclined to declare a plan to stop
18soon (11%), while Chilean and Brazilian UDs with the same expectation represented 5%,
and Mexican UDs represented 3%. These numbers indicate that the liquidity network model
will require additional efforts to maintain drivers.
v. Financial behaviors and health of Uber driver partners
III.38 The last module of the survey was designed to assess levels of financial access, financial
behaviors, financial security, and retirement plans of UDs. It consisted of 17 questions,
designed to measure six different areas: (1) financial access; (2) financial security; (3) usage
of smartphones and the Internet; (4) savings profile; and (6) retirement plans and interest in
accumulating more savings.
III.39 UDs have high rates of access to basic financial products. A total of 72% of drivers in
the sample reported having primary access to a checking or savings account. This
proportion is significantly higher than the average rate (61%) of financial account ownership
among the general populations of the four countries.27 The high rates of financial inclusion
may not surprise, given that drivers are required by Uber to have a bank account to receive
payments. However, UDs can also choose to use the bank account of another trusted
person to receive Uber payments. 12% of drivers reported having a direct family member
as the owner of their Uber-linked account, with significant differences by country (18% in
Mexico, 16% in Colombia, 10% in Brazil and 4% in Chile). The corresponding question also
included the option to select employers as owners of Uber-linked accounts28. Mexico was
an outlier in this regard, as 18% of drivers reported using an employer-provided bank
account for receiving payments, whereas in Colombia, Chile, and Brazil, this share was
relatively small (4%, 1%, and 0%, respectively). For UDs owning a bank account, 15%
opened it to receive Uber payments, alluding to the platform’s potential to serve as a
foundational vehicle for financial inclusion. Uber has served as a particularly potent driver
of bank account opening in Mexico, where 34% of drivers opened their accounts to receive
Uber payments.29
III.40 One in two UD report not having any kind of household savings and three in four are
in debt. UDs were asked to indicate whether they have managed to set aside money in
savings vehicles of varying degrees of liquidity.30 Only 47% of UDs reported having
accumulated any kind of savings. UDs who managed to save use mainly one vehicle (64%
of UDs who save or 30% of all UDs), with the majority of them preferring to save in cash31
(70% UDs who save or 33% of all UDs). There are significant differences in the use of cash
as the preferred savings vehicle by country: in Colombia, the percentage of those saving in
cash was lowest (59% of Colombian UDs who save); whereas in Brazil, it was highest (74%
27 See World Bank Global Financial Inclusion (Global Findex) Database. The Findex data is representative of the
population of individuals aged 15+, whereas UDs included in the survey were 18 years of older. The compared
Findex question asks about ownership of any kind of account at a financial institution, not only savings and
checking accounts, although these two types of accounts probably account for a large percentage of accounts
owned by the surveyed populations. If anything, ownership rates of any account at a financial institution should
be even higher among UDs.
28 Categories were not mutually exclusive and UDs were allowed multiple alternative from the following list: (1)
self; (2) direct family member; (3) employer ; (4) other; (5) DK/NA.
29 Given the high levels of smartphone penetration and use (92% before joining the platform), it seems feasible to
explore other alternatives of financial inclusion through mobile devices.
30 Categories (savings vehicles) were not mutually exclusive and UDs were able to select more than one savings
vehicle from the following list: (1) personal savings; (2) cash; (3) certificates of deposit, mutual funds, stocks,
bonds; (4) pension fund; (5) land; (6) other (please specify); and (7) none of the above.
31 Cash includes the “personal savings” category.
19of Brazilian UDs who save). Drivers whose households have savings were asked to report
the main reasons for putting money aside.32 The three most salient choices were (a) to cover
short-term emergencies (37%); (b) to start a business (34%); and (c) to buy a house,
apartment, or land (34%). UDs appear to be more likely to have open loans than the general
population of the four countries. A total of 74% of drivers in the overall sample reported
having debt with a financial institution or person, with this percentage ranging from a low of
64% in Mexico to a high of 83% in Colombia. In Chile, 75% of drivers owe money to a
financial institution or person; and in Brazil 73%. For Chile, and Colombia, these values are
significantly higher compared to the results of a similar, general-population survey
implemented in the two countries.33
III.41 The majority of UDs live in economically vulnerable conditions, despite having
confidence in their financial capabilities. UDs reported feeling confident that they could
overcome any financial problem they may face. In Colombia and Chile, almost 7 in 10
responded positively (68% and 67%, respectively), while in Mexico and Brazil, 59% and
53% responded positively, respectively. For Chile and Colombia, these levels are in line with
those for the general public.34 To obtain a more fine-grained picture of UDs' level of financial
resilience, we drew on an index of "financial security" of UDs. This index classifies each
driver as either financially insecure, financially stretched, or financially secure.35 Figure III.10
shows the results. We found that only 8% of UDs can be considered as living in economically
stable conditions (financially secure), whereas 40% and 52% are financially stretched and
insecure, respectively. In Chile and Colombia, the proportion of financially secure, to
stretched, to insecure, is 7% to 43% to 50% and 8% to 45% to 47%, respectively.
Meanwhile, it is 14% to 31% to 55% and 14% to 33% to 53% respectively, for the general
population in those two countries. This suggests that UDs are more likely to live in financially
stretched conditions but less likely to experience either more extreme financial insecurity or
security than the overall population in their respective countries. Financial insecurity is
highest in Brazil, where 56% of UD can be considered living financially insecure lives.
32 The corresponding survey question included the following options: (1) Start a business; (2) Buy a house,
apartment, or land; (3) Finance the education of my kids; (4) Pay back debt; (5) Be able to cope with emergencies
or other unexpected events; (6) Accumulate funds for retirement; (7) Travel; (8) Make important purchases (car,
furniture, etc.); (9) For inheritance; (10) other. Categories were not mutually exclusive.
33 Chile and Colombia have analogous national-level data to allow for comparison, through the Gallup Global
Financial Health Study 2018. The purpose of this study was to find out how much control and influence people
in different countries believe they have over their financial situations. More than 15,000 people were interviewed
in 10 countries: Bangladesh, Colombia, Kenya, Vietnam, Chile, Greece, Japan, South Korea, the U.K., and the
U.S.
See https://news.gallup.com/reports/233399/gallup-global-financial-health-study-2018.aspx. Only 48% of the
general population have loans of this kind to repay in both Colombia and Chile.
34 66% of Chileans and 69% of Colombians reported feeling confident that they could overcome any financial
problem in the Global Financial Health Survey, including through the help of their social networks.
35 The index, designed for the Global Financial Health Study, is based on two questions: The first question asks
how long respondents would be able to use their savings or sell assets to cover their basic needs, such as food,
housing, and transportation, if they lost their income. The second inquires whether making repayments against
debts does or does not make it difficult for them to pay for other things they need. The resulting index assigns
individuals to one of three mutually exclusive categories: “Financially secure” are those persons who could cover
their basic needs for more than 6 months and for whom, at the same time, making repayments against debts
does not make it difficult to pay for other things they need. “Financially insecure” are those for whom either one
of the following two conditions are met: (i) They could cover their basic needs for less than one month by only
drawing on their savings or by selling assets; (ii) they find paying for other things they need very difficult after
making payments against their debt. Finally, “financially stretched” are those who are neither financially secure
nor insecure.
20You can also read