Who's the alien? Xenophobia in post-apartheid South Africa
←
→
Page content transcription
If your browser does not render page correctly, please read the page content below
Who’s the alien?
           Xenophobia in post-apartheid South Africa

                                          Marguerite Duponchel∗†

                                        December 2009, draft, v3

                                                    Abstract

          In May 2008, South Africa became the theatre of widespread violent attacks on migrants. Over
      sixty were killed, hundreds wounded and tens of thousands displaced. In the aftermath of the at-
      tacks, a large range of explanation of the phenomenon was iterated by researchers. This analysis
      aims at identifying the characteristics of the victims in an attempt to portray the ’Alien’. Its
      originality lies in the level of analysis as well as the method. Indeed it uses a quantitative anal-
      ysis to explore this under-researched question. In February 2009, the South African Red Cross
      (SARCS), in partnership with Wits University and the United Nations Office for the Coordination
      of Humanitarian Affairs (UNOCHA) conducted a household survey in the Johannesburg inner city
      and in Alexandra township. It covers both South African citizens and foreigners who were the
      primary, but not only, target. Questions relating to violence and displacements were incorporated
      to a larger survey on living conditions. Using a victimisation measure, I thus investigate the char-
      acteristics of those undesirable ”outsiders”.
      Results confirms that foreigners face a higher probability of being victimised on the ground of
      xenophobia. Relative poverty appears to have a positive impact on the probability of being at-
      tacked, especially in Alexandra Towwnship. Moreover the results contradict the hypothesis that
      the outbreak of violence was due to the influx of foreign nationals fleeing Zimbabwe. Indeed, the
      longer one has spent in their current living location, the higher the risk. The effect is non-linear
      with a maximum reached around a decade. Zimbabweans do also face a lower chance of victim-
      isation than other foreign nationals. Finally, the characteristics of the location do influence the
      probability that an individual will be attacked.

  ∗ University Paris 1 Pantheon-Sorbonne, CES and CNRS, and Wits University, Forced Migration Studies Programme
  † Many  thanks to UNDP South Africa, to UNOCHA-ROSA, to the South African Red Cross and to the Forced
Migration Studies Programme at Wits University. I also want to thank Lopa Barjenee, Laura Brown, Veronique Gindrey,
Pete Manfield, JP Misago, Loren Landau, Pinky Vilakazi, Hein Zeelie and all the volunteers of the Red Cross.

                                                        1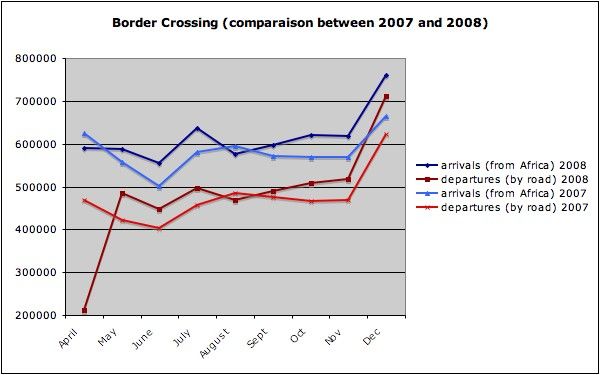
1      Introduction
On May 11 2008, Alexandra township witnessed the start of pogroms against outsiders who some
perceived were not South African enough. The extreme violence quickly spread to other provinces
and eventually lasted until the end of that month. Those events are remembered as the May 2008
xenophobic riots. Hundreds of homes and shops were looted and burnt. 62 people died across the
country, among which 21 were South African citizens. Many were injured. An estimated 100,000 fled
their homes and found refuge wherever they could.

    My colleague at UNDP (United Nations Development Programme) recalled her story. When the
xenophobic violence erupted in May 2008 and started to spread around the country, she got worried
that Mike, her Mozambican gardener, might be in danger. Mike, who previously stayed in Pretoria,
had moved to Thembisa three years before to live with his South African girlfriend. As the violence
quickly reached the township1 , she phoned to make sure that he was alright. Mike confirmed that
there had been violent attacks against migrants around the neighbourhood. When he was asked if he
was safe his answer was: ”Yes, they would not attack me”. Mike’s story raised questions. Why, in
the same communities, some foreigners were attacked and some were not? What made some residents
South African enough to the eyes of the community when some became aliens that needed to be chased
away at any cost? What made someone a likely target? The violence might not have been as randomly
conducted as it seemed after all. Yet to my knowledge these questions had not been investigated at
the start of this research. For good reasons: no data existed. Nevertheless, finding answers is essential
for the design of policies and programmes targeting both xenophobia and reintegration of the victims.
How can one effectively intervene if one does not know who is in need, who is vulnerable? The South
African Red Cross undergo a data collection exercise on vulnerabilities in February 2009. Some minor
additions to the questionnaire enabled to capture experiences of violence at the household level.
While I believe that quantitative analysis has the potential to reveal important features and draw new
lines of research, qualitative research should not been ignored. Xenophobia is a multi-dimensional
complex phenomenon and pluri-disciplinary analysis is necessary for a wider understanding of xeno-
phobia in South Africa, its roots, its consequences and the way forward.

    Part 2 recounts the xenophobic attacks of May 2008, the origins and aftermath and presents a
short literature review of the subsequent analysis on the causes of the events. Part 3 describes the
database, the econometric model and the explanatory variables. Part 4 reports the results and finally
Part 5 concludes.
    1 Thembisa   is located in the Gauteng province. It is one of the townships the most affected during the riots

                                                             2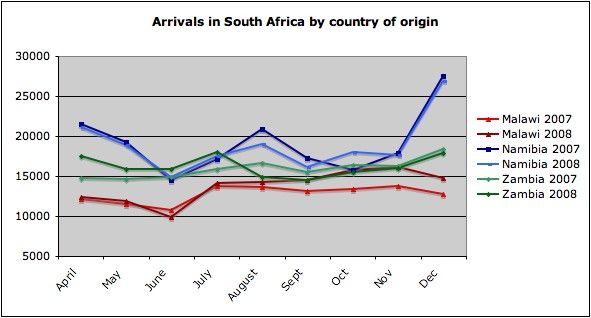
2     Xenophobia in South Africa: facts and analysis
South Africa, and more particularly the Gauteng province hosting Johannesburg and Pretoria, has
become today’s economic centre of Sub Saharan Africa. Its success has attracted a wide range of
domestic and international migrants seeking economic opportunities or refuge from oppression and a
better life. Expected to be large, the exact number of immigrants is unknown, a significant number
of them crossing the border illegally. Gindrey and Landau (2008) estimate an annual net gain of
approximately 78,000 migrants per year in the province. Their results also show that Gauteng Province
hosts 46 percent of the country’s total foreign population. May 11 2008 will be remembered by all
of them. Violent attacks on people considered as outsiders started in Alexandra township, on the
outskirts of Johannesburg. The levels of violence observed during this month of pogroms shattered
Mandela’s dream of a rainbow nation.

2.1     Facts and figures

The events of May 2008 cannot be analysed without understanding the global post-apartheid con-
text of xenophobia. Xenophobic violence can be traced to as early as a few months after the first
democratic elections on April 27 1994. In December 1994, in Alexandra, ”armed youth gangs destroy
foreign-owned property and demand that foreigners be removed from the area” (Misago et al., 2009).
Evictions, looting of property and even killings are reported elsewhere in the country. The frequency
of such events gradually increased, with an unprecedented level of violence reached in May 20082 .
Between January 2008 and the May 2008 riots, at least thirteen foreigners are killed, a large number
of shops are burnt down, many are made homeless. Violence is reported in the Eastern Cape, in the
Western Cape, in Gauteng, in Kwazulu-Natal and in the Free State.

    On May 11, an armed mob attackes foreigners in Alexandra, Gauteng. Two people are killed and
two women are raped. Sixty people are injured. Shops and homes are looted and self-appropriated by
the perpetrators. Violence in Alex will continue for several days. Hundreds of people flee their homes
and find refuge at the police station. Meanwhile, the violence spreads across the province, reaching
several townships including Diepsloot, Thembisa and Soweto. By May 16, attacks reach Cape Town,
where one Somali shopkeeper is killed. On May 17, violence grips Jeppestown in downtown Johan-
nesburg and the following day, inner city Hillbrow is affected. Violence and evictions continue in
most places. Durban is shaken on May 17. Attacks are reported in Maukasi, Dukhatole, Zandspruit,
Ramaphosa, Primrose, Reiger Park, Kya Sands, Jerusalem, Zamimplio, Joe Slovo informal settlement,
  2 See Misago et al. (2009) for details on the violent incidents recorded since the end of the apartheid era and during

May/June 2008

                                                           3
Mayfair and other places. On May 21 clashes are again reported in Durban, Mpumalanga, the Free
State and the North West province. On the same day, President Mbeki decides to involve the army to
stop the violence. Violence in Gauteng gradually scales down, but incidents are still reported in the
other provinces. Meanwhile, thousands march against xenophobia in different parts of the country3 .
By May 26, the violence is declared under control: 1384 suspects have been arrested, 342 shops looted
and 213 burnt down. Hundreds are wounded. 62 have lost their lives, 21 of them were South Africans.
Thousands are made homeless, forced to seek shelter at friends, in the government administered camps,
in churches, etc. The last shelters will close in October, five months after the riots started.
Some victims are reintegrated into their communities with insurance from the residents that they
will be safe. In some neighbourhoods, returning is impossible. Those victims either resettled in other
places where their lives were not threatened or simply decided to return to their countries of origin. For
some, going home was just not an option. However, those movements post-crisis were not extensively
monitored. One year after the event, it has become hard to locate the victims of the attacks. Foreign
nationals living in South Africa stay as quiet and invisible as possible, fearing more violence. As the
data collection shows, outsiders are still harassed. Xenophobic violent acts did not cease on May
26 2008. In September 2008, a Somali mother was murdered with her three children in her shop in
Queenstown, Eastern Cape. In Alexandra, shacks inhabited by foreigners were burnt down around
Christmas. In May 2009, two Somalis were found burnt in their shops. In late November, Zimbabweans
workers were forcibly chased from a farm in the Western Cape.
2.2 Literature review on xenophobia and ethnic violence
Xenophobia is a complex phenomenon, widely under-researched. Nevertheless in the aftermaths of
violence that shook South Africa in May 2008, sociologists, anthropologists and political scientists
produced a variety of research materials trying to explain the outburst of violence at different levels
of analysis. I identified two types of explanations: political and socio-economic. Most certainly, the
two aspects worked alongside to reach the tremendous level of violence observed in May 2008.
Sociologist Neocosmos (2006) links the outbreak of violence to a widespread xenophobic feeling
among South Africans, sentiment widely fed by the South African elite who wants to protect its inter-
ests and wealth by pointing a finger at the other (also in Sharp 2008).
This phenomenon can also be identified elsewhere. Tadjo (2008) draws the comparison between the
xenophobic violence in South Africa and the rise of the concept of Ivoirité in Côte d’Ivoire. She explains
3 Details on the events are questionable, those facts are gathered from different sources including BBC News, Mail &
Guardian and UNOCHA
4that Ivoirité was re-conceptualized from colonialism by the Ivorian elites in order to define national
legitimacy by stigmatizing foreigners. Excluding foreigners, she underlines, is one of the main recurrent
methods involved in strategies for conquering or preserving political power. In the recent history of
Cote d’Ivoire, the concept of identity has been manipulated to refer to local territory as opposed to
national territory. Outsiders became those who did not come from the locality. A clear parallel can
be drawn in the South African context where the others are not only the foreign born but also the
migrants coming from the poorer Northern provinces. In this case, the xenophobic violence cannot be
interpreted as a struggle among the poor, but instead should be seen as a competition between the
richest and the poorest. The poorest are manipulated by the elite to turn against outsiders it created
so that the richest can retain power and wealth.
Illustrating a national phenomenon, South African historian Noor Nieftagodien (2008) recalls that the
distinction between insiders and outsiders has long been defined by politics in Alexandra Township.
The laws of apartheid were purposely designed to create division between groups and rural migrants
were considered as outsiders. Yet the freedom struggle helped create a sense of community. The com-
mon enemy is now defeated, and the threat of outsiders has re-emerged since the end of the apartheid
regime.
Misago et al. (2009) attempt to identify the causes of violence while comparing seven sites: five where
xenophobic violence was reported and two where the presence of foreigners did not lead to attacks.
Through interviews with a wide range of respondents, the study identifies four factors that triggered
the violence: 1/ the presence of ”institutionalized practices that exclude foreigners from political par-
ticipation and justice”; 2/ the absence of conflict resolution mechanisms; 3/ the presence of ”political
vacuums or competition in community leadership that encourages the emergence of unofficial, illegit-
imate and often violent forms of local leadership”; and 4/ a culture of impunity, particularly with
regard to xenophobic violence.
As shown by the political explanations of the violence, the complexity of the phenomenon is ti-
tanic, and cannot be clearly de-linked from the broader reality of inequality and poverty in South
Africa (Gelb, 2008; Pillay, 2008; Fauvelle-Aymar and Wa Kagbwe-Segatti, forthcoming).
Sociologist Pillay (2008) suggests that huge socio-economic inequalities between the poorest and the
richest of the population are mainly at the root of the violence(South Africa ranks as the second most
unequal country looking at its Gini index (CIA factbook). Inequalities have risen since 1994 from a
Gini at 59.3 to 65. South Africa, which is often compared to Brazil has now a society which is more
unequal than the Brazilian one). Victims of this market violence as he refers to, are unable to recognize
or reach the real perpetrators i.e. the richest that hold power. As a consequence, violence is directed
towards those leaving the closest i.e. outsiders, whether they are foreign nationals or coming from the
5Northern provinces (Pillay, 2008). Neocosmos (2008b) confirms that it is a common occurrence that
the powerless regularly take out their frustrations on the weakest: women, children, the elderly and
outsiders. This phenomenon is also identified by psychologist Gordon Allport (1954).
Gelb (2008) explains the manifestations as resentments and hostility towards those who are per-
ceived, rightly or wrongly, to be better off or to have received preferential treatments. This sentiment
translated into the interviews of South Africans in the aftermath of the crisis (HSRC, 2008; Misago et
al. 2009). Unequal job opportunities, among others, were regularly cited as a reason for the attacks.
According to Pillay (2008) the violence was mainly directed to foreign nationals who owe houses, and
have jobs or small businesses. Yet this needs to be scientifically proven. At this stage, there is no
evidence that better off foreigners were the principal targets. Similarly, a few year before the outbreak
of violence, Dodson and Oelofse (2000) on a study on the causes of xenophobia in Capetown found
that, in a context of extreme poverty and very high unemployment, competition for jobs, mainly in
the local fishing industry, was the main factor driving the division among the communities between
indigenes and foreigners. Misago et al. (2009) also identifies necessary but not sufficient pre-conditions
for the violence among which high unemployment and poor service delivery. Confirming the theory
of relative deprivation, psychologist Sherif et al. (1961) suggest that competition for access to limited
resources results in a conflict between groups. Competition for limited resources between groups leads
to prejudices against the out-group, whose members are viewed by the in-group as a source of compe-
tition. (e.g., jobs being given to the members of the out-group).
In addition, one of the explanations for the outbreak of violence was that the influx of Zimbabweans
exacerbated tensions between communities as competition for services tightened. Esses et al. (2001)
suggest that in Northern America, ”the migration of large groups of people across borders can result in
the host community’s reaction of feeling threatened by the new-comers either because of perceptions
of economic strain or as a result of cultural dissimilarity”. Yet Misago et al. (2009) conclude that
inadequate border control and the supposedly mass influx of Zimbabweans were not a valid explana-
tion for the xenophobic riots in South Africa. The results show that outsiders who had been attacked
had been living there for years. Furthermore, no mass influx was reported from respondents. Finally,
the places where the violence occurred were not necessarily the ones with the highest proportion of
foreign nationals. If the mass influx of migrants in South African cities increased the competition for
already scarce resources, testing whether Zimbabweans are more at risks than other foreigners would
invalidate the assumption that the recent influx of Zimbabwean migrants was not a direct cause of for
the violence outbreak.
6In the only existing quantitative analysis on the subject, Fauvelle-Aymar & Wa Kagbwe-Segatti
(forthcoming) attempt to identify among all those factors potentially at the roots of the May 2008
xenophobic violence. Using a database covering 839 wards in 21 municipalities, they compared the
characteristics of the wards were xenophobic violence was reported during the xenophobic episode of
May 2008. The results show that the ratio of black men under 60 has a positive and significant impact
on the occurrence of violence at the ward level. Similarly, they identify a significant effect of the diver-
sity of groups among foreign nationals. The quality of housing in the ward, also seem to significantly
impact whether or not violence erupted in a ward. Interestingly their results suggest no significant
impact of the level of unemployment.
This study opts for a complete different approach which aims at portraying the outsiders. Indeed, as
for now, the literature only investigates the root causes of the violence. The portrait of the ”outsider”
is still dark. In fact, I strongly believe that identifying the characteristics of the victims could provide
a different and interesting new light on the xenophobia outbreak. The following research focused at
the household level and attempts at identifying the characteristics that significantly played a role in
defining the victims of May 2008.
The first step is to identify individual characteristics that might potentially be significantly cor-
related to been an outsider4 . Drawn on the literature review, the characteristics of interest would
refer to demographic and socio-economic characteristics at the household level, while controlling for
the characteristics of the place of residence. Moreover, this step will also allow us to identify the
characteristics of the location where the victims live.
The second step of the analysis will focus on foreign nationals, relying on the hypothesis that the
xenophobic violence was particularly directed towards them. The hypothesis to test is whether being
a foreigner is sufficient to be considered as an outsider or whether wealth, nationality or other factors
also influence the probability that a foreigner is perceived as outsider to get rid off. In other words, is
Mikes story the rule or the exception. If this is the rule, who are the more vulnerable foreigners?
3 Data and model
3.1 Data
The data was collected during February 2009. For the pilot phase, two places where chosen in the
Gauteng province where the violence started: Alexandra township and the Johannesburg inner city.
4 In the improbable case where the violence was conducted at random, none of the characteristics will be significant
7Over twenty volunteers from the South African Red Cross were trained on the questionnaire designed
with Wits University Forced Migration Studies Programme, and then sent to the field where coordi-
nation was insured by UNOCHA and Wits.
But before going into the data description, it is essential to give some historical background about
these two surveyed sites. The apartheid era has undoubtedly left deep scars both in the minds of South
Africans and in the geography of the territory. Not taking into account history in post-apartheid South
Africa will certainly lower the accuracy of the analysis. Because Alexandra and the Johannesburg city
centre are so particular, results, at this stage, can not be generalised to the whole country. More data
is needed and townships in Kwa Zulu-Natal, Eastern Cape and Western Cape provinces, in particular,
need ideally to be surveyed.
3.1.1 Alexandra is, and has always been, a special place (”Alexandra: A History”, 2008)
Reminder of the apartheid regime and also one of the strongholds of the struggle for freedom during the
war years, Alex is a striking illustration of urban poverty and inequalities in the newly reborn South
Africa. Established in 1904, the overcrowded ghetto, today’s home of nearly half a million people, is
situated in the North-East of Johannesburg. From its top hill, you can observe the 2sq km of houses
and shacks. On the horizon, you are able to distinguish the shining towers of the wealthy Sandton
City only a few blocks away, where billions of rands trade daily. Back in its early days, its location,
along with the ease for new arrivals to secure a pass to work in the city, often made it the first stop
for rural blacks seeking jobs in the semi-industrial suburbs.
But between then and now, history has left its traces. Alexandra’s history has long been tumultuous.
The township struggled to survive apartheid, going from intense threats of removals to numerous
failures of upgrading plans, mainly as a result of a clear disinterest on the side of the government.
The last in date, the Alexandra Renewal Plan (ARP) was launched by President Thabo Mbeki in
2001. It has improved the neighbourhood despite a very difficult first period of implementation. The
R1.3 billion seven-year development plan brought new infrastructures and housing, roads upgrade and
other improvements to Alexandrians’ daily lives. But the highly cosmopolitan and ethno-fractionalized
township is still gravely overcrowded. Alex, once constructed to host 30,000 black workers, has reached
a population estimated at half a million. Since the end of apartheid, the number of its residents has
nearly quintupled. As a result there is lot of pressure for already scarce service delivery. Poverty is
striking5 and the level of criminality remains tremendously high6 .
Meanwhile, Alexandra has always been a place whose people have been strongly politically engaged,
leading the fight for freedom from its very early days through multiple ways, such as bus-boycotts and
5 In our sample, 87% of the respondents in Alexandra reports not having access to running water in their dwelling; 4
out of 10 households interviewed do not have electricity in their dwelling
6 SAPS reports an average of four murders per month
8demonstrations. The residents played a central role in the fight against the Bantu Education Act in
1976 alongside the Soweto students. Alex has always been on the front-line of social movements. It is
by no mean a surprise to see it at the epicentre of the xenophobia events that broke out on May 11
2008.
3.1.2 Johannesburg inner-city
When arriving in Johannesburg, one can distinguish the city centre from a distance. Wherever you
are coming from, by land or by air, you can see the famous television tower and the 53 floor high
Ponte Tower from far. At the time of its construction the Ponte Tower was the highest building of
Africa. The price of a square meter was unaffordable to most South Africans. By the 90’s it had
become a symbol of crime, drugs and decay. The story of this once highly coveted building is a prefect
illustration of Johannesburg inner city.
In 1955, the Native Amendment Act urged the removals of black residents from the city centre. The
inner city was declared a ”White Only area” and the government removed illegal tenants, mainly
coloured and Indian families. It was the economic and cultural centre of Johannesburg, hosting many
firms’ headquarters. Its sky-scrappers were the pride of South Africa.
Between 1978 and 1982, the grand apartheid project started to erode, and a large influx of coloureds
and Indians moving back into the neighbourhood was recorded. The main reason was the shortage of
flats in some areas and the oversupply in Hillbrow (Morris, 94). Black people also started to illegally
penetrate the forbidden area. White families who could afford it started to migrate to the wealthy
suburbs of the North.
By the end of the apartheid era, Hillbrow and Joubert Park had switched from an essential white
population from all classes to an ”overcrowded crime ridden black ghetto” (Olufemi, 1998), hosting
among its residents drug dealers, notorious gangs and prostitutes.
With the upcoming FIFA world cup, the City of Johannesburg launched in 2008 a R171 million
uplifting programme for the inner city. The area has been cleared, but remains one of Johannesburg’s
most feared areas. Its population is essentially black. A lot of migrants who were not attracted by the
township life settled in the inner city, thus creating an intensely cosmopolitan place.
93.1.3 The data collection
The sampling strategy was designed to gather a sample with 50% of foreign nationals7 . Among the
national population, targets were set to 50% of South Africans who have lived in the locations of
interview for at least ten years (i.e. long term residents), and 50% of recent migrants who arrived in
the location less than ten years ago. Interviewers were assigned enumeration areas chosen randomly
and knocked on every fourth door. Only adults were to respond with the exception of over 16 year-olds
if they were head of household (this was mainly to avoid evicting from the sample young mothers who
could be particularly vulnerable).
In total, 2028 people were interviewed over the course of a month. Enumeration areas were chosen
randomly.
In Alexandra, we quickly switched to snowballing. Indeed, we realised the quota of foreign nationals
would be difficult to reach. Firstly, foreign nationals constitute a minority of Alexandra’s residents,
no more than 3% according to the Alex Renewal Project survey. Secondly, foreign nationals refuse to
answer or try to mask their identity, underlying the accuracy of the assumption that the situation of
foreign nationals was still difficult. Using snowballing methods we managed to successfully interview
277 foreign nationals or 28%. 385 interviewees were long term residents and 326 recent internal mi-
grants.
In the Johannesburg inner-city, we surveyed three neighbourhoods: Hillbrow, Berea and Yeoville.
There, we easily reached the 50% rate of foreign nationals. This confirmed the intuition that the
location was hosting a large proportion of foreigners. Using the ”every fourth door” sampling strategy,
548 foreign nationals were interviewed along with 470 South Africans. 160 of the latter were long
term residents (the inner city happens to be mainly a place of transit) and 310 recent migrants. Over-
all, the data is composed of 59% of South Africans, 25% of Zimbabweans, 6% of Mozambicans, 3%
of Congolese (DRC) and other less represented citizens, including Malawians, Nigerians and Zambians.
Information was collected on a wide range of issues: demographics of the household, migration
patterns, including documentation, livelihoods, access to health and education services, social partici-
pation but also on violence linked to the May attacks. We asked respondents whether they had been
threatened or attacked because of their ethnic/tribal/national identity. We focused on three periods:
before May, during May/June 2008 and after the xenophobic events. We then enquire further about
7 South Africans were to be included because some of them are in many ways vulnerable. They also have been
targeted during the xenophobic attacks. In addition, any programme design, whether it is a research exercise or not,
should include nationals to avoid exacerbating tensions in the communities. The proximity of the national elections
also created a highly volatile environment where looking for a particular group of residents could lead to conflict and
endanger both respondents and interviewers
10potential subsequent displacements due to the violence, including the length of displacements, the
relocation site, etc. We also asked whether the respondents returned to the place from which they had
been chased away or not and for what reason.
3.2 The econometric model
3.2.1 A potential selections bias
The data suffers from a potential selection bias. People who fled their homes and never came back are
completely absent from our sample. Very little is know about the victims who decided to leave for the
simple reason that there had been no adequate monitoring.
The United Nations High Commissioner for Refugees (UNHCR) assisted the displaced refugees but
very few went home. Quickly, the agency decided that resettlements would not be awarded on the
basis of xenophobic violence. Meanwhile, the United Nations Children’s Fund (UNICEF) gave grants
to support movements home. IOM also assisted vulnerable individuals who expressed the desire to
return to their country of origin. In two successive phases, IOM assisted 578 individuals who resigned
themselves to go back home, mostly originating from the Great Lakes Region8 . The Mozambican
government provided its citizens with a bus ticket to Maputo. People might also have returned home
by their own means which makes it even more difficult to track movements.
What is even less sure is how many of these people who first left came back when the storm had settled?
Probably a lot of them. Numerous stories from the camps suggested that some would have used the
repatriation process to go home and then come back again. The border crossing statistics from the
Department of Home Affairs can give a vague idea on movements out and back to the country. Figure
2 shows the different trends of arrivals (of African nationals) and departures (by road)9 between 2007
and 2008. The cycles correspond to South African holidays. Apart for Zimbabweans, trends should
follow the approximate same path from one year to the other; the only difference should be in scale.
The first graphic indeed shows very few differences between the two years, apart from a decline in
both arrivals and departures in August/September 2008. Looking at the breakdown in arrivals by
nationalities, the only main difference is an increase, relatively to the preceding year, in the rate of
arrivals of Mozambicans, Namibians and Zimbabweans in July 2008. Possibly, it can be explained by
those who were returning to South Africa after the violence. This is yet just a supposition.
Out of a large number of displaced persons, we can assume that the ones who decided to leave South
8 Phase 1: 170 Burundians, 137 Congolese (DRC), 44 Tanzanians, 15 Somalis (who went back to Ethiopia), 5 Kenyans,1
Congolese, 1 Sudanese, 1 Rwandese. Such details are not available for phase 2
9 For departures Home Affairs only give a breakdown by means of transport and not by nationalities. Presumably,
most victims would have returned home by road, however those statistics also include departures of tourists travelling
in the region.
11Africa for good constitute a clear minority. IOM, which assisted many of them, seems to believe
that the foreigners who left were the ones who had lost everything and greatly feared for their lives.
Meanwhile, in most of the interviews carried out with humanitarian staff present in the camps at the
time of the crisis revealed the same observation: when it was announced that resettlements would not
occur, people started to leave and return to their communities.
While it is important to keep in mind that we do not observe the characteristics of individuals who
left, I assume that this will not result in a significant bias in the analysis, as so many came back to
South Africa.
Another potentially and certainly more problematic source of bias resides in the fact that Alexan-
dra was where it all started and people who could afford not to obviously did not come back. They
preferred to resettle somewhere else. The main reason mentioned for returning to Alex was ”we had
no choice”, suggesting that if they had had the means to do so, victims in Alex would have moved
somewhere else. Hence, the coefficient could be biased. If only the poorest victims came back, the
results at least on the Alexandra sub-sample would over-estimate the poverty factor.
Furthermore, Alexandra was certainly not an asylum location. In our sample, only 12 interviewees
found refuge in the township. Victims from other places would hardly have relocated there. This
selection bias will eventually be corrected when the data collection is extended to other areas in the
country where people came back to or found refuge once the xenophobic riots were contained.
3.2.2 Model
The dependent variable is constructed using the answer to the question: ”Have you, or anyone in your
household, been threatened or attacked because of your ethnic group, your tribe or your nationality
during May/June 2008?”10 . I acknowledge that the formulation of the question might lead to people
over reporting xenophobic violence but the South African crime context obliges to define specifically
the type of agression11 . The ”yes or no” answer results in a dummy variable which analysis requires
the use of a non-linear model. We opted for a probit model. We thus estimated the following equation:
V iolence∗i = α0 + β 0 Xi + εi (1)
10 We decide to focus on the May 2008 attacks as opposed to a larger period of coverage, mainly because the responses
are believed to be more accurate: it is possible that attacks before or after May are remembered as xenophobic when
they were not
11 Alexandra and Hillbrow’s reputation make them rank in the most dangerous places in South Africa. Theft and
mugging are there a daily routine
12
1 if V iolence∗ > 0
where V iolence =
0 if V iolence∗ ≤ 0
Where Xi is a vector of explanatory variables for the household i. The analysis is clustered by
enumeration area to allow correlation of covariance within locations. In some regression, ward level
characteristics are introduced as controls. In these cases, the standard errors are corrected for a
potential Multon bias (1990) while clustering at the ward level. This procedure is essential to avoid
misspecification and spurious regressions, thus especially as the size of the ward is important.
3.2.3 The variables
Demographic and migration history variables
The size of the household describes the number of persons, including children, sharing the same
shelter and budget. Single migrants can potentially be perceived as outsiders in the sense that they
come to work and do not struggle for their families like most in the community.
A dummy variable is used whether or not the respondents was born in South Africa. For the
in-depth analysis of the characteristics of foreigners in relation to victimization, break down would be
made by country of origin. Foreigners are expected to face a higher chance of threat.
A binary variable is used to capture whether the household is composed of both South African
and foreigners. On the one hand, we can expect that foreigners living with South Africans would
be recognised as an insider rather than as an outsider. Typically, it is assumed that these foreigners
would have an easier access to the community life through their partners. On the other hand, foreigners
who have South African partners can be perceived as competitors. In the aftermath of the violence,
interviews of South Africans in the zone affected by violence revealed that foreigners were blamed for
steeling women. In this case, mixed households would be more at risks than non-mixed households. A
priori, the effect is unknown.
A binary variable captures whether the respondent speaks IsiZulu. This stands as a proxy for
the household. Speaking Zulu is expected to decrease the probability of being attacked or threatened
for being an outsider. Indeed, it could facilitate integration and reduce recognizability.
Time since arrival in South Africa/ in the location captures the time since arrival in South
Africa/ in the location of survey. These variables provide information on the level of integration.
13Supposedly, long-term migrants should be more integrated in the communities than new arrivals that
have had little time to settle and take part of the community activities. Hence, long-term migrants
should face a lower risk of been attacked. If this correlation is significant, it would also tend to validate
the hypothesis that the recent influx of migrants was a cause of the May 2008 attacks. It is important
to underline that the time since arrival, particularly, in Alexandra, could be linked to the level of
poverty of the household. The poorer the household, the longer it takes to afford moving to a safer
neighborhood (Richards et al. 2007). Meanwhile, we control for the different aspects of poverty. Both
durations are de facto highly correlated. Therefore the time in the current location is preferred for the
analysis. The impact of the time spent in South Africa will also be investigated for foreigners.
A binary variable is used to identify rural migrants. Under apartheid rules, rural migrants were
perceived as ”outsiders” in Alexandra (Nieftagodien 2008). The regime purposely created preferences
towards residents. Migrants from rural areas in the country were consistently stigmatised into an
out-group. Moreover, rural migrants are expected to have more difficulties to adapt into a new urban
environment than migrants coming from urban centres, whether they originate from cities in South
Africa, or from Harare, Maputo, Kinshasa etc.
Variables also capture the reasons for migrating. Those include migration for economic reasons,
educational reasons, to escape conflict or political oppression and for the purpose of familial reunion.
Migrants were asked the two principal reasons behind leaving their places of origin. Those four are the
most often cited. We expect that different types of migrants face a different degree of victimization.
Nevertheless, while controlling for wealth, country of origin and the characteristics of the place of settle-
ment in South Africa, it is highly plausible that the ”type” of migrants does not influence victimization.
Socio-economic variables
The level of education of the respondents serves as a proxy for the level of education of the
head of household. In the case of a validation of the relative deprivation theory, the level of education
should be positively correlated to the probability of victimization.
The wealth index is created using a principal component analysis. It computes different aspects
of poverty such as access to water, to electricity, to schooling as well as employment status of the
respondents (see details in Annex) . The wealth index gives an absolute measure of the household’s
level of poverty (as opposed to relative poverty) by centile. The poorer one percent have a wealth
index of 0.01 while the richer one percent score 0.99. If victims are systematically richer, than the May
142008 xenophobic violence was a struggle of classes, perpetrators chasing those who they rightly regard
as privileged. If the poorest are more likely to be victims, then it would validate the hypothesis under
which people lashed out their frustration on the more vulnerable, those competing for the same scarce
resources.
Perceived relative poverty is captured by the answer to compared with others in the area where
you live, would you say your household is poorer than average (=1), or average or richer than average
(=0)?” 35 percent of respondents consider their household poorer than average, 50 percent about av-
erage and 15 percent richer than average. The assumption is the same than for the impact of absolute
probability on the risk of being victimized except that in this case what matters is how poor one feels
compared to others in the community.
Legal variables
Criminal activity is estimated using the respondent self-reported record of arrest by the police,
either as part of a criminal investigation or related to participation in criminal activity. Although the
information does not cover the whole household it most certainly constitutes a proxy. The existence of
a crime record only concerns about 3 percent of respondents, probably underestimating the percentage
of households with individuals with crime records. Yet for those who reported a crime record, it surely
shattered the image of the whole household who then is associated with criminal activities. Crush
& Ramachandran (2009) report that a common belief is that migrants are the cause of the increased
level of crime. Following this assumption, households whose members have criminal record should be
more at risks of violence than others. If this is not the case, it will confirm that those perceptions are
divorced from reality.
The dummy for whether or not the respondents has documentation takes the value of one if the
respondents report to be a foreigner and has neither an asylum seekers nor refugee permit (section
22 and 24) nor a valid visa to be in South Africa. Defined as such, 453 respondents are classified
as illegal. Again, this individual information is a proxy for the status of household members. Note
that the repartition between Alexandra and the inner city is almost similar. Crush & Ramachandran
(2009) identify that irregular migrants are much more prone to victimization than others. If this is
true, the coefficient should be positive and significant.
Location controls
15A binary variable is issued to distinguish Alexandra township from the Johannesburg inner-city.
The first level of analysis consists in comparing the characteristics of the victims in the township with
the those living in town. The two locations are likely to observe different dynamics of xenophobic
violence. Hence, people living in Alexandra are expected to be more at risk than the inhabitants of
the inner city.
The ward variables allow controlling for the characteristics of the location of survey. They are
constructed using the 2001 Census and are average by ward (using the 2009 demarcation). Overall the
core sample covers population in eight distinct wards (EAs were arbitrarily attached to the adjacent
wards in case they originally belong to another large ward which did not allow to capture the living
conditions in the EA)12 .
Proportion of black male aged 15 to 60: Assuming that women are equally represented across
age and ethnicity, the variable is constructed by multiplying the proportion of black inhabitants by
the proportion of males and by the proportion of people aged between 15 and 60. It varies between
37 and 44 percent. I expect that the higher the proportion of black males, the higher the chance
of being victimized ceteris paribus. Indeed, Wa Kwabe-Segatti and Fauvelle-Aymar’s (forthcoming)
results suggest a positive impact on the risk of violence at the ward level. However, as our data was
collected in areas where the proportion of black people exceeds 90%, the introduction of this variable
is for control rather than explanation purposes.
The percentage of foreigners: Although Wa Kwabe-Segatti and Fauvelle-Aymar (forthcoming)
did not find a significant impact on the occurrence of violence, the percentage of foreigners in the lo-
cation might create a safer environment for foreigners, who were the principal target, on the contrary
number can exacerbate the resentment of the adoption community.
Diversity index for the foreign population: The diversity index is constructed the same way as
the almost universal ethnic diversity measure i.e. the Ethno-linguistic Fractionalization index (ELF).
The ELF is a decreasing transformation of the Herfindhal concentration index. For a ward composed
N ≥ 2 nationalities (excluding South Africans) and pn indicates the share of the group of nationality
PN
n in the foreign population, the diversity index is given by 1 − n=1 p2 n .
The diversity index of the foreign population in a given ward varies from 60 to 77. Overall the foreign
population is heterogeneous. Again no systematic differentiation between Alexandra and the inner city
is observable. Wa Kwabe-Segatti and Fauvelle-Aymar (forthcoming) find that the more heterogenous
12 Ask author for details on the ward delimitation
16the foreign population, the less the probability of violence in the ward.
Due to high correlation between these variables, it was preferred to introduce an interactive term be-
tween the percentage of foreigners and the diversity of the foreign population. The expected combined
impact on the probability of victimization is negative.
The rate of unemployment: the rate of unemployment in a ward is constructed as percentage
of the population who reported either to be unemployment or being seasonal workers but not working
at the time of interview or who answered that they could not find a job. In the wards of the surveyed,
the unemployment rate varies 26.5% and 38.5%. The effect of the rate of unemployment in the ward
on the probability of being a victim of xenophobia cannot be identified ex-ante. It is expected to
positively impact the probability of victimization. Nevertheless, Wa Kwabe-Segatti and Fauvelle-
Aymar (forthcoming) find no significant impact on the probability that a given ward experienced
violence in May 2008.
4 Results
4.1 Step 1: Which characteristics influence the probability of being vic-
timised?
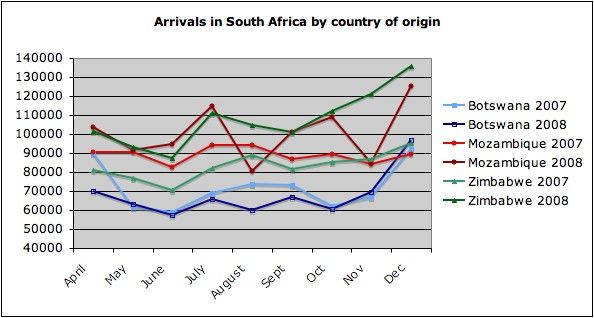
The results are reported in the first three columns of Table 1.
The main result is that foreigners face a higher probability of being victims of xenophobic attacks
then South Africans. In reality, their chances of victimization is 20 percent higher than the rest of
the population everything else kept constant. This is particularly high compared to the average pre-
dicted probability of eleven percent. Not surprisingly, foreigners were the primary target of the May
2008 aggressors. The results of columns (2) and (3) show a striking difference between Alexandra and
the inner-city: foreigners living in Alexandra face a 32 percent higher chance of having been attacked
or threatened while it is only nine percent higher in the city-centre. There will be more on this in Step 2.
Looking at the demographic variables, only the coefficient of the size of the household is significant.
Although its effect is relatively small, it confirms the hypothesis that larger households are perceived
more as insiders who are struggling to raise their family than as competitors. A single person house-
hold will be more at risk than a family of five whose members would face a four percent lesser chance
of being victimized on the ground of xenophobic hatreds ceteris paribus. Mixed households are not
significantly more at risks than others. The same applies for the ability to speak IsiZulu. This con-
tradicts the rumour, mainly spread by the media, that xenophobic violence was caused by foreigners
17Figure 1: Table 1: probit, characteristics of the victims (marginal effects re-
ported)
STEP 1 STEP 2
(1) (2) (3) (1) (2) (3) (4) (5)
Demographics
Household size -0.008 -0.015 -0.004 -0.015 -0.008 -0.008 -0.008 -0.015
(0.003)** (0.006)** (0.003) (0.007)** (0.003)** (0.003)** (0.003)*** (0.008)*
Mixed Household=1 0.003 0.011 -0.004 -0.016 0.003 0.003 0.006 -0.023
(0.014) (0.030) (0.016) (0.015) (0.014) (0.014) (0.014) (0.011)**
Speak IziZulu=1 0.010 0.036 -0.015 0.009 0.021 0.011 0.020 0.017
(0.012) (0.019)* (0.018) (0.028) (0.007)*** (0.012) (0.007)*** (0.021)
Migration History
Length in current 0.044 0.048 0.039 0.099 0.043 0.044 0.043 0.097
location
(0.018)** (0.018)*** (0.012)*** (0.046)** (0.018)** (0.018)** (0.019)** (0.048)**
Length in current -0.002 -0.002 -0.002 -0.005 -0.002 -0.002 -0.002 -0.005
location, sq
(0.001)** (0.001)*** (0.001)*** (0.002)** (0.001)** (0.001)** (0.001)** (0.002)**
Rural Origin=1 -0.003 0.019 -0.022 -0.067 -0.005 -0.005 -0.001 -0.066
(0.016) (0.019) (0.015) (0.031)** (0.016) (0.016) (0.015) (0.029)**
Foreign born=1 0.203 0.322 0.091
(0.025)*** (0.036)*** (0.016)***
Economic Migrant -0.042
(0.060)
Migrated for education 0.042
(0.058)
Escape conflict 0.040
(0.024)*
Familial reunion -0.050
(0.028)*
Poverty
Secondary school=1 -0.009 -0.009 -0.002 -0.014 -0.007 -0.006 -0.011 -0.023
(0.009) (0.019) (0.019) (0.035) (0.008) (0.009) (0.009) (0.036)
Absolute Poverty index 0.001 0.001 0.000 0.002 0.001 0.001 0.001 0.001
(0.000)*** (0.000)** (0.000) (0.000)*** (0.000)*** (0.000)*** (0.000)*** (0.000)***
Relative Poverty index 0.034 0.042 0.038 0.064 0.034 0.034 0.033 0.052
(0.006)*** (0.020)** (0.024) (0.034)* (0.006)*** (0.006)*** (0.006)*** (0.033)
Legal characteristics
Criminal record=1 0.000 0.015 -0.009 0.002 0.001 0.002
(0.042) (0.066) (0.052) (0.042) (0.043) (0.041)
Illegal migrant=1 0.023 0.030
(0.035) (0.033)
Nationality
SA -0.235 -0.191 -0.197
(0.022)*** (0.030)*** (0.026)***
ZIM -0.038
(0.019)**
MOZ 0.032
(0.039)
DRC 0.101
(0.020)***
Location characteristics
% of black males (15- -0.997 -3.759 -0.848 -0.958 -0.881 -3.568
60) in ward
(0.181)*** (1.041)*** (0.213)*** (0.174)*** (0.178)*** (0.990)***
% of unemployment in 0.605 2.645 0.510 0.590 0.543 2.558
ward
(0.233)*** (0.877)*** (0.221)** (0.210)*** (0.230)** (0.787)***
% of foreigners x -0.293 -0.305 -0.342 -0.260 -0.380 -0.421
Diversity of the (0.138)** (0.523) (0.138)** (0.151)* (0.133)*** (0.524)
foreigners’ population in
ward
Observations 1715 902 898 696 1715 1715 1715 704
Predicted p at xbar 0.071 0.089 0.056 0.181 0.183 0.071 0.069 0.180
Robust standard errors in parentheses. * significant at 10%; ** significant at 5%; *** significant at 1%
18stealing women and was directed towards people who do not speak Zulu.
The coefficients of the migration variables give us some complementary answers on the characteris-
tics of the victims. First of all, the impact of the time spent in the current location of survey is positive,
following a U-inversed pattern. The probability of attacks or threats rises to reach a maximum at the
end of the first decade living in the location. The results are similar when introducing the time since
arrival in South Africa, for foreigners, and in Gauteng, for local migrants13 .
This can be interpreted as contradicting the hypothesis that the recent influx of migrants, especially
from Zimbabwe, is one of the underlying cause of the May 2008attacks. Indeed, if the growing number
of migrants could have exacerbate competition for resources and resentment in the host community.
The ones who are more at risks have been the neighbours for many years, they are not the newly
arrived in the location. Hence, an alternative explanation is that the xenophobic attacks were more an
explosion of a long lasting resentment. During many years, inhabitants lived with and competed with
those perceived as outsiders. Knowing who they were, they became an easy target once the violence
started. On the contrary, the new comers were harder to identify and locate.
The poverty indicators are significant but their coefficients appear contradicting. Indeed, absolute
wealth, as calculated using the PCA, has a positive impact on the risk of attack. The possibility of
a non-linear relationship is ruled out while introducing the square of the index. Thus households in
the upper quantile ie. the one percent richer in the sample, face a risk of attacks ten percent higher
than the poorer quantile. Household at the mean face a five percent higher risk. This results tends
to validate the hypothesis that, everything else constant, richer households were the primary target.
Nevertheless, this result is not robust when using a wealth index constructed with only two compo-
nents14 . On the contrary, the coefficient of the relative poverty variable suggests that household who
perceived themselves as ’on average poorer’ face a higher risks of being attacked. In fact half of those
who responded to be on average poorer are situated in the 30 percent poorer of the sample. Column
(2) and (3) show that relative poverty is mainly a factor of victimization in Alexandra. Indeed the
coefficient looses significance when the regression is ran on the inner-city sub-sample.
Whether the respondent reports having a criminal record in the country does not impact the prob-
ability of being attacked. This suggests that the May 2008 attacks pogroms were not a chase against
criminal, or if it was there was a clear misperception of who to evict.
13 Results not reported, available from the author on request
14 Regression not reported; available from the author on request
19Let’s now focus on the characteristics of the location of survey.
The core regression controls for some the characteristics of the ward: percentage of black male between
15 and 60; the unemployment rate; and the percentage of foreigners interacted with the heterogeneity
of the foreign population. All coefficients are significant. The results suggest that a percentage point
higher in the proportion of blacks males decreases the probability of attacks by one percentage point.
Similarly, the sign of the interacted term suggest that the higher the proportion of foreigners and the
more heterogeneous the foreign population in the location of survey, the lower the chances of attacks
for the respondent household. This finding confirms Wa Kwabe-Segatti and Fauvelle-Aymar (forth-
coming) that the heterogeneity of the foreign group negatively impact the probability of violence in
the ward.
The rate of unemployment in the location seems to increase the probability of victimization. On
the contrary, Wa Kwabe-Segatti and Fauvelle-Aymar (forthcoming) find no significant impact of the
employment rate on the likelihood of violence at the ward level. The assumption is that whether
employment conditions do not determine the places where the violence erupted in May 2008, in those
where it did, high unemployment rates implies higher probabilities of victimization at the household
level. If unemployment is not a trigger it certainly is an aggravating factor. Inhabitants of more
depraved areas are more at risk of attacks or threats.
Those results should however be taken with caution has only eight wards were surveyed.
4.2 Step 2: what characteristics make one foreigner more an outsider than
another foreigner?
Column (1) of Step 2 is similar to column (1) of Step 1, the main difference being that it is run on the
sub-sample composed of only foreign nationals. The same explanatory variables are introduced along
with the legal status of the responding migrant. It is expected that undocumented migrants will face
higher levels of resentment linked to their illegal status in the country; but the community might not
know exact legal status of its foreign neighbours. The variable capturing criminal record is dropped
as no foreigners in the sample reports to have been arrested for criminal activities.
Most of the results are similar although the predicted probability reaches 0.18.
The demographic and migration history variables follow the same patterns. Household size has a
negative and significant effect. The probability of being victimized increases with the length of stay in
the location, following a U-inversed shape. Absolute poverty has a positive impact on the probability
of attack while relative poverty has the inverse effect. A few differences can however be observed.
Foreigners with urban backgrounds are more at risks than those coming from rural areas,a result that
20is highly unexpected. Indeed, I assumed that people from rural backgrounds would have more troubles
to integrate into Johannesburg’s life.
Column (2) and (3) of Step 1 illustrated that Alexandrians are significantly less safe than inhabi-
tants of the inner-city, suggesting that townships environments see more resentment towards foreigners.
The descriptive statistics of the population which has been victimised confirms a striking difference
between Alexandra and Johannesburg inner city. In the township, 38% of foreign nationals reported
having been victims of violence in May/June 2008, as opposed to only 12% in the inner city. One
obvious reason is that foreign-born only constitute a minority of the inhabitants in the township (about
2-3% according to the estimation of the latest Alexandra Renewal Project’s study). Hence as a small
number they become an easy target.
A major assumption to verify, once controlling for demographics, wealth, migration and location
characteristics, is whether all nationalities face the same probability of threats or whether some are
more at risk than others. In order to do so, dummy variables for the main foreign nationalities in the
sample were introduced to the core regression, while controlling for South Africans i.e. Zimbabweans
(62%), Mozambicans (16%), Congolese- DRC (8%). In doing so, distinction is made between the na-
tionality under focus and the other foreigners. The results are reported in columns (2), (3) and (4).
The results show that Zimbabweans are less at risk of xenophobic violence than others. Once again
the result tends to confirm those of Misago et al. (2009) that the influx of Zimbabweans were one
of the reasons for the eruption of violence in May 2008. Indeed, if it was the case, we would expect
Zimbabweans to face higher probabilities of threats. This is not the case, Zimbabweans are relatively
less victimized in our sample. Congolese, on the contrary, face a ten percent higher probability of vic-
timization. There could be many explanations for this phenomenon. Not coming from the neighboring
countries they might have more problems to integrate in the South African society. It could also be
a language barrier. It could simply be that they are more recognisable among the population. They
might also associate aggression with xenophobia more easily.
Finally, migrants do not all converge to South Africa, or anywhere else, for the same reasons.
Some do escape political oppression or conflict in their home countries. Some migrate for economic
opportunities, hoping that the receiving country will give them a better life. Some reunite with family
members already living in the host country. Some come to South Africa from all over the continent to
study (South Africa has a wide range of educational institutions of high quality). Some migrate for a
combinaison of those reasons and others. Xenophobic violence might be directed differently depending
on the reasons that brought the migrant to the province or to the country. Integration in the new
community can prove more or less successful depending on why one left home in the first place.
21You can also read