Why do children read more? The influence of reading ability on voluntary reading practices - Elsje van Bergen
←
→
Page content transcription
If your browser does not render page correctly, please read the page content below
Journal of Child Psychology and Psychiatry **:* (2018), pp **–**                                                        doi:10.1111/jcpp.12910

Why do children read more? The influence of reading
      ability on voluntary reading practices
Elsje van Bergen,1,2   Margaret J. Snowling,2,3 Eveline L. de Zeeuw,1 Catharina E.M. van
                Beijsterveldt,1 Conor V. Dolan,1 and Dorret I. Boomsma1
  1
      Biological Psychology, Vrije Universiteit Amsterdam, Amsterdam, The Netherlands; 2Experimental Psychology,
                              University of Oxford, Oxford; 3St. John’s College, Oxford, UK

Background: This study investigates the causal relationships between reading and print exposure and investigates
whether the amount children read outside school determines how well they read, or vice versa. Previous findings from
behavioural studies suggest that reading predicts print exposure. Here, we use twin-data and apply the behaviour-
genetic approach of direction of causality modelling, suggested by Heath et al. (1993), to investigate the causal
relationships between these two traits. Method: Partial data were available for a large sample of twin children
(N = 11,559) and 262 siblings, all enrolled in the Netherlands Twin Register. Children were assessed around
7.5 years of age. Mothers completed questionnaires reporting children’s time spent on reading activities and reading
ability. Additional information on reading ability was available through teacher ratings and performance on national
reading tests. For siblings reading test, results were available. Results: The reading ability of the twins was
comparable to that of the siblings and national norms, showing that twin findings can be generalized to the
population. A measurement model was specified with two latent variables, Reading Ability and Print Exposure, which
correlated .41. Heritability analyses showed that Reading Ability was highly heritable, while genetic and
environmental influences were equally important for Print Exposure. We exploited the fact that the two constructs
differ in genetic architecture and fitted direction of causality models. The results supported a causal relationship
running from Reading Ability to Print Exposure. Conclusions: How much and how well children read are moderately
correlated. Individual differences in print exposure are less heritable than individual differences in reading ability.
Importantly, the present results suggest that it is the children’s reading ability that determines how much they
choose to read, rather than vice versa. Keywords: Direction of causality models; reading skills; print exposure; twin
studies; causal modelling; behaviour-genetics.

                                                                             hours has been variously termed reading amount,
Introduction
                                                                             reading frequency, reading for pleasure, indepen-
Learning to read builds on language skills, it
                                                                             dent reading and print exposure. Measured here is
requires instruction and it also requires practice.
                                                                             the quantity of reading that parents state their
Cunningham and Stanovich (1997) were the first to
                                                                             children do of their own volition and not as pre-
formally propose that practice, or ‘print exposure’ is
                                                                             scribed by school. We use the term ‘print exposure’
a vital ingredient in the development of fluent
                                                                             here but, by adopting this term, we do not assume
reading. However, there are vast individual differ-
                                                                             that a child’s print exposure is the outcome of a
ences in children’s reading habits. It has been
                                                                             passive process. Indeed, a key issue is the causal
estimated that, whereas avid readers read as many
                                                                             direction of the link (or links) between reading skill
as 1.8 million words per year, reluctant readers read
                                                                             and print exposure: do children who read more
only about 8,000 words for their own enjoyment
                                                                             become better readers (print exposure ? reading), do
(Anderson, Wilson, & Fielding, 1988; table 3). Mea-
                                                                             poorer readers avoid reading (reading ? print expo-
sured longitudinally, the link between how much
                                                                             sure) or is there a reciprocal relationship between
and how well a child reads holds over a 10-year time
                                                                             reading and print exposure?
period (Cunningham & Stanovich, 1997). Measured
                                                                               To date, three studies have used a longitudinal
concurrently, the link is consistently present from
                                                                             design to investigate the relationships between read-
preschool, when the frequency of shared-reading
                                                                             ing and print exposure. Aarnoutse and van Leeuwe
correlates with emergent literacy skills, to university,
                                                                             (1998) tracked the development of children’s print
when the amount of independent reading correlates
                                                                             exposure and reading comprehension from the sec-
with word-level reading skills, reading comprehen-
                                                                             ond to sixth grades. Print exposure developed largely
sion and vocabulary size (Mol & Bus, 2011). For
                                                                             independent of reading comprehension, with mar-
decoding or word-level reading, the focus of the
                                                                             ginal influences of reading comprehension on print
current paper, the concurrent correlation during the
                                                                             exposure. Over a shorter time scale, Lepp€     anen,
school years is estimated at .38 (Mol & Bus, 2011).
                                                                             Aunola, and Nurmi (2005) assessed print exposure
The amount of time children read out-of-school
                                                                             and reading ability (accuracy, fluency and compre-
                                                                             hension) between Grades 1 and 2 in a cross-lagged
                                                                             design. Causal relationships were primarily from
Conflict of interest statement: No conflicts declared.

© 2018 The Authors. Journal of Child Psychology and Psychiatry published by John Wiley & Sons Ltd on behalf of Association for Child and
Adolescent Mental Health.
This is an open access article under the terms of the Creative Commons Attribution-NonCommercial-NoDerivs License, which permits use and distribution
in any medium, provided the original work is properly cited, the use is non-commercial and no modifications or adaptations are made.
2    Elsje van Bergen et al.

reading skills to print exposure, though there was a             common underlying environmental cause, (c) both 1
small effect of print exposure on reading accuracy.              and 2, (d) X influencing Y at the phenotypic (i.e.
Finally, Harlaar, Deater-Deckard, Thompson,                      behavioural) level, (e) Y influencing X, or (f) both 4
DeThorne, and Petrill (2011) measured print expo-                and 5 (i.e. reciprocal phenotypic influences). Twin data
sure and reading skill (i.e. a composite of accuracy             allow the investigation of causality because the differ-
and comprehension) between the ages of 10 and                    ent models give rise to different expectations for the
11 years. The effect again ran from reading skill to             cross-trait cross-twin correlation (i.e. the correlation
print exposure. However, interpretation of the find-             between X in twins with Y in the co-twin). Competing
ings from these studies is hampered by the strong                models can be distinguished best if the correlation
stability of reading ability over time, for example,             between traits is reasonably large (i.e. >.25, Duffy &
Harlaar et al. (2011) report an autoregressive effect            Martin, 1994), the traits differ in the relative impor-
of .90. Given the large autoregressive effect of earlier         tance of genetic and environmental influences, and
reading on later reading ability, there is little vari-          measurement error is accounted for by using multiple
ance remaining for any other variable to explain. It             indicators of the phenotypes (Heath et al., 1993). This
follows that understanding any putative impact of                model has been applied successfully to address
print exposure on reading (or a reciprocal relation-             causality (e.g. Ebejer et al., 2010; Gillespie, Zhu,
ship) calls for an alternative design.                           Neale, Heath, & Martin, 2003; Thomsen et al., 2009;
   An important hypothesis regarding the relation-               Toulopoulou et al., 2015).
ship between reading ability and print exposure is                  In the current study, we apply direction of causal-
that it reflects shared genetic influences. Further, on          ity models to infer the causal relations (if any)
the grounds of temporal precedence, it might be                  between reading ability and print exposure in a large
assumed that reading mediates genetic influences                 sample (N > 11,000) of 7-year-olds. Given the robust
on print exposure. While it is well established that             association between our traits of interest, the larger
differences among children in reading skills are                 impact of environmental differences on print expo-
largely due to genetic factors (Olson, Keenan, Byrne,            sure than on reading ability, and the use of latent
& Samuelsson, 2014), with heritability across stud-              variables to account for measurement error, direc-
ies reported to be .73 (de Zeeuw, de Geus, &                     tion of causality modelling should work well.
Boomsma, 2015), few studies have investigated the
aetiology of individual differences in print exposure.
Those that have report heritability estimates ranging
                                                                 Methods
from 0.10 (Harlaar, Dale, & Plomin, 2007) through
                                                                 Participants
0.39 (Harlaar, Trzaskowski, Dale, & Plomin, 2014) to
0.65–0.67 (Harlaar et al., 2011; Martin et al., 2009),           The present project was approved by the medical ethical
all with large E-components, suggestive of substan-              committee of the Vrije Universiteit Amsterdam (NTR/25-05-
                                                                 2007). Analyses were based on 11,559 twins, born between
tive measurement error.                                          1994 and 2004, and 262 siblings. The sample was obtained
   Arguably, the typically lower heritability estimates          from the Netherlands Twin Register, a nationwide database of
for print exposure than reading are to be expected               multiple births and their family members, including data from
given that print exposure depends on the presence of             birth onwards (van Beijsterveldt et al., 2013). For present
printed material in the child’s environment. Turning             purposes, we employed data from school achievement records
                                                                 and from questionnaires, which mothers and teachers com-
to estimates of the genetic correlation between read-            pleted when the children were 7½ years old. Having obtained
ing and print exposure; these are about .60 (Harlaar             parental consent, we approached teachers to complete the
et al., 2011, 2014; Martin et al., 2009). However,               questionnaire and provide test scores from the achievement
since a genetic correlation may be due to genetic                records (national pupil monitoring system (Cito, 2014)).
effects on both traits (pleiotropy), such estimates                 In total, 368 (3.1%) twin children were excluded, and 11,559
                                                                 were retained for analyses (Appendix S1). Each of the 11,559
cannot speak to the causal relationship between two              children provided at least one data point. These 11,559 twins
traits (here reading and print exposure). Alterna-               (of whom 5,723 were boys) came from 6,072 twin pairs: 2,175
tively, in a causal model, genetic effects on the                MZ twin pairs (1,034 male; 1,141 female) and 3,897 DZ twin
causal phenotype are transmitted through a direct                pairs (1,021 male; 939 female; 1,937 opposite sex). Zygosity of
relationship with the outcome phenotype, hence                   same sex twin pairs was determined using DNA polymor-
                                                                 phisms (in 10.0%) or using a parent-report zygosity question-
giving rise to a genetic correlation between the                 naire comprising 10 items on twin similarity, with an accuracy
phenotypes (e.g. genes ? reading ? print exposure).              of 93% (Rietveld et al., 2000). Mothers and teachers completed
   A design that can speak to the direction of causality is      the questionnaire including items on reading when the chil-
the behaviour-genetic ‘direction of causality’ model             dren were on average 7.50 (SD 0.33) and 7.44 (SD 0.36) years
(Duffy & Martin, 1994; Heath et al., 1993). This design          old, respectively. For neither informant were the item scores
                                                                 systematically related to age ( .05 < rs < .05). Teachers com-
requires cross-sectional data on family members, such            pleted the questionnaires at the end of the school year: most
as twin pairs, and, therefore, does not depend on                children attended Grade 1 (69%) or 2 (26%). The proportion of
longitudinal data so that the stability of traits is not an      twins who were in the same classroom (and rated by the same
issue. Denoting the phenotypes X and Y, competing                teacher) and the proportion of twins who were in different
models are tested which explain the X-Y correlation as           classrooms (rated by different teachers) did not differ signifi-
                                                                 cantly by zygosity (see Appendix S1).
resulting from either (a) a common genetic factor, (b) a

© 2018 The Authors. Journal of Child Psychology and Psychiatry published by John Wiley & Sons Ltd on behalf of Association for
                                                                                         Child and Adolescent Mental Health.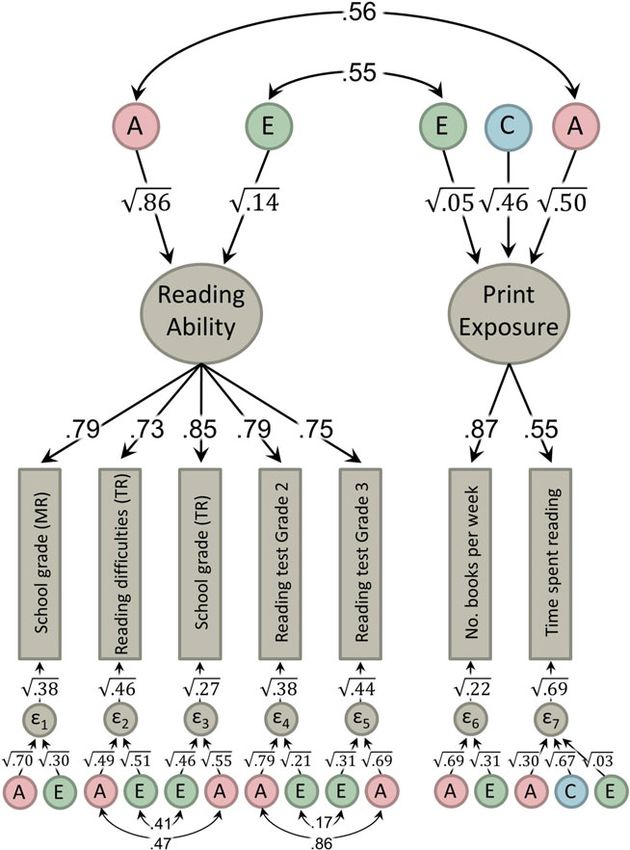
The causal influence of reading ability on print exposure    3

   Teachers also provided test scores for reading ability of 262                      sample read. First, we compared the reading test
siblings of the twins from achievement records. These additional                      scores of the twins to those of their siblings. As
data enabled us to examine how representative the twin sample
                                                                                      shown online in Table S1, the means did not differ
was of nontwin children. When there were multiple siblings, we
selected the data of the oldest sibling (n = 262; 127 boys).                          significantly (Cohen’s ds 0.02). Second, the test
                                                                                      manual reports the following mean scores (i.e. cut-
                                                                                      offs between below and above average, or C and B
Measures
                                                                                      levels) for second to fifth grades: 39.5, 59.5, 71.5 and
The current study employed school achievement records and                             81.5. Our twin sample means are ~0.18 SD above
data from questionnaires that were mailed or offered online to
                                                                                      these population means. So, good reading families
mothers and teachers. Print exposure was based on maternal
ratings and reading ability was based on maternal and teacher                         are somewhat overrepresented, but within families,
ratings and achievement records.                                                      twins are representative of singletons. Further anal-
                                                                                      yses are based on the twin data.
Reading ability. We used five indicators of reading ability:
one item from the mother questionnaire, two from the teacher
questionnaire and two test scores. Mothers were asked to report                       Descriptive statistics
the current school grade for Dutch language [scale points: 1 (fail),
                                                                                      Some items were reverse scored so higher scores
2 (poor), 3 (satisfactory), 4 (good) and 5 (excellent)]. Teachers were
asked the child’s usual grades for reading [scale points: 1 (fail), 2                 reflect better and more reading. Data from some
(poor), 3 (satisfactory), 4 (above average) and 5 (good/excellent)]                   questionnaire items relating to reading ability were
and from the Conners’ Teacher Rating Scales (Conners, Sitare-                         negatively skewed (Table 2), that is, less sensitive in
nios, Parker, & Epstein, 1998) whether the child lagged behind in                     discriminating among good readers. Nevertheless,
reading [scale points: 1 (not true at all), 2 (just a little true), 3 (pretty
                                                                                      the correlations between the questionnaire items
much true), to 4 (very much true)].
   Reading ability was tested at school with a word-reading                           and the test scores were between .54 and .74
fluency list (Verhoeven, 1995; List 3) given by the teacher to                        (Table 1). The distributions of the two test scores
children individually. The list, which is part of the Dutch pupil                     were approximately normal. Intercorrelations among
monitoring system, comprises 120 polysyllabic words varying                           reading ability indicators were between .54 and 86.
in orthographic complexity (Verhoeven & van Leeuwe, 2009).
                                                                                      The two print exposure indicators correlated .51.
Children were asked to read aloud as many words as possible
within one minute in mid-Grade 2 and mid-Grade 3. These test                          Correlations among ability and exposure items were
scores correlated .86 (Table 1).                                                      low (.15–.31). The association between reading abil-
                                                                                      ity and print exposure is visualized in Figure 1.
Print exposure. The two indicators of print exposure came
from the mothers’ questionnaire. Mothers were asked ‘How many                         Missing data. Out of seven possible data points,
books (no comics) does the child read per week?’ [scale points: 1                     children had on average 3.33 data points
(none), 2 (one or two), 3 (three or four) and 4 (more than four)], and
                                                                                      (SD = 1.43). See Appendix S1 for details. We under-
‘How much time does the twin spend on the following activities?’
for which one of the listed activities was ‘reading books’ [scale                     took missing value analyses to examine whether
points: 1 (every day), 2 (almost every day), 3 (a couple of days per                  missingness of data was related to mother’s educa-
week), 4 (once a week), 5 (less than once a week), 6 (so far once) and                tional level or children’s reading ability (Tables S2
7 (never)]. As an index of reliability we also calculated how much                    and S3). We did not run these analyses for print
time children spend on reading books compared with the other
                                                                                      exposure, because we only had data from one infor-
activities that were listed (e.g. gaming, watching TV, playing with
friends). This relative measure correlated .92 with the raw item.                     mant. These analyses found missingness to be
                                                                                      unrelated to the dependent variable reading ability;
                                                                                      coupled with the fact that the data set is very large,
                                                                                      the missing data do not, therefore, pose major issues.
Results
                                                                                      The structural equation modelling described below
Sample representativeness
                                                                                      was performed in Mplus (Muth    en & Muth en, 1998-
We assessed two indicators of how representative                                      2015). Mplus handles missing data by fitting the
our sample is based on how well the twins in the                                      model using robust raw-data maximum-likelihood

Table 1 Correlations among items

Variable                                               Source                   1.             2.         3.         4.           5.          6.

Reading ability
  1. School grade for language                    Mother report                  –
  2. Reading difficulties                         Teacher report                .60            –
  3. School grade for reading                     Teacher report                .68           .79         –
  4. Reading test Grade 2a                        School records                .62           .57        .70          –
  5. Reading test Grade 3a                        School records                .56           .54        .66         .86          –
Print exposure
  6. Number of books per week                     Mother report                 .28           .21        .26         .31         .31           –
  7. Time spent reading                           Mother report                 .21           .15        .20         .21         .20          .51
a
 The test measured word-reading fluency.
All p’s < .001.

© 2018 The Authors. Journal of Child Psychology and Psychiatry published by John Wiley & Sons Ltd on behalf of Association for
Child and Adolescent Mental Health.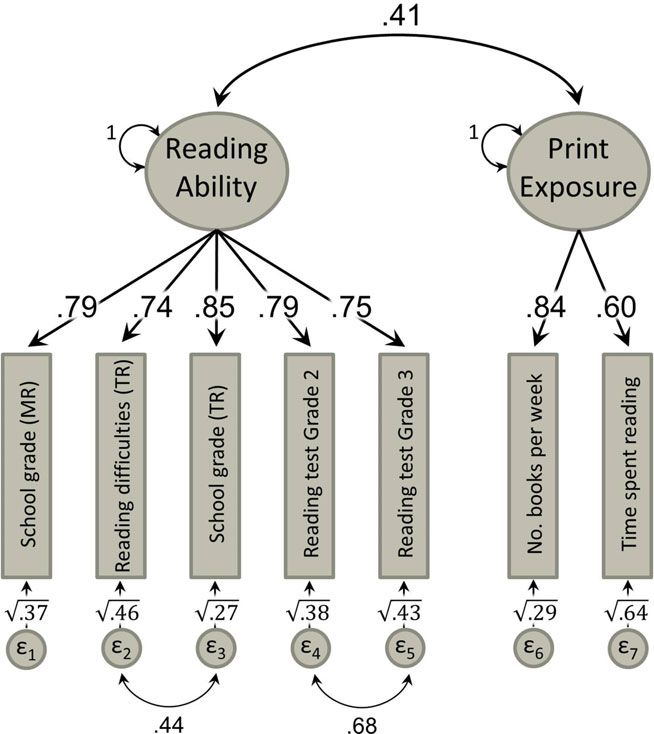
4     Elsje van Bergen et al.

Table 2 Descriptive twin data statistics

                                                                                                           Twins

Variable                                           Source               Rangea               N               M               SD

Reading ability
  1. School grade for language                 Mother report             1–5              7,496             3.69             0.93
  2. Reading difficulties                      Teacher report            1–4              6,587             3.47             0.93
  3. School grade for reading                  Teacher report            1–5              5,826             3.60             1.24
  4. Reading test Grade 2b                     School records            0–120            1,702            42.25            18.78
  5. Reading test Grade 3b                     School records            0–120            1,774            63.43            18.24
Print exposure
  6. Number of books per week                  Mother report             1–4              7,594             2.09             0.71
  7. Time spent reading                        Mother report             1–7              7,564             5.65             1.39

Items were mirrored when necessary so that higher scores reflect better and more reading.
a
 Range of possible values.
b
  The test measured word-reading fluency.

Figure 1 ‘How much time does the child spend reading books?’
per reading group. Only children with data on the word-reading
fluency test were included in this figure. If both Grades 2 and 3
scores were available, the first was taken. Some answer cate-
gories were collapsed to simplify the figure. Dyslexic is defined as
scoring 75th, according to national norms

estimation on the assumption that data are missing
at random.

Analytical approach. Three sets of models were
fitted, each set of models building on the previous                    Figure 2 Measurement model. Note. MR = mother report;
set. The first set is based on a two-factor phenotypic                 TR = teacher report. Model fit: v2(11, N = 11,559) = 38.83,
measurement model (Figure 2). The model formed                         p < .001; RMSEA = 0.015, 90% CI (0.010–0.020); CFI = 0.997
the basis for the behavioural-genetic model (Fig-
ures 3 and 4), which in turn formed the starting
point for the causal models (Figure 5).                                genetically identical, DZ twin share on average 50%
   First, we fitted phenotypic two-factor (measure-                    of their segregating genes. We decomposed the total
ment) models to the data set. To account for depen-                    trait variance into an additive-genetic variance com-
dency among the observations (twins clustered in                       ponent (A), a common environmental variance com-
pairs), we corrected standard errors and model fit                     ponent, reflecting the effect of environmental
statistics as proposed by Rebollo, de Moor, Dolan,                     influences that the twins share (shared or common
and Boomsma (2006). The final measurement model                        environment: C), and an unshared-environmental
formed the basis of subsequent behavioural-genetic                     variance component, which reflects unshared envi-
modelling.                                                             ronmental influences (nonshared environment: E).
   After establishing the measurement model, we                        The phenotypic twin correlations are diagnostic of
investigated the relative contribution of genes and                    the underlying model. Genetic influences are impli-
environment on the phenotypic variances and                            cated if the MZ twin correlation is larger than the DZ
covariance of reading ability and print exposure.                      correlation.
The twin method exploits data on MZ and DZ twin                          We specified for Twin 1 and Twin 2 members the
pairs who are raised together. MZ twins are                            previously established two-factor (measurement)

© 2018 The Authors. Journal of Child Psychology and Psychiatry published by John Wiley & Sons Ltd on behalf of Association for
                                                                                         Child and Adolescent Mental Health.
The causal influence of reading ability on print exposure   5

Figure 3 Full correlational model. The contribution of C to the   Figure 4 Final correlational model
variance of Reading Ability was estimated at only 1% and not
significant (p = .120)

                                                                  for by regressing all items on sex, coded 0 (boys) or 1
model. Next, we tested the basic twin-model                       (girls). On average, girls were rated as reading more
assumption of equal means and variances over twin                 (bs .12–.15, ps < .001) and slightly better than boys
members and over zygosities. This more restricted                 (bs .07–.09, ps < .001). However, on average, boys
model, labelled the phenotypic twin model, formed                 and girls scored similarly on the reading tests (bs
the basis of the ACE models, in which the variances               .02, ps > .33). We subsequently applied an omnibus
of the latent factors were decomposed into A, C                   test of basic assumptions of the twin model concern-
and E.                                                            ing equal means and variances. This yielded Dv2
                                                                  statistic of 171.6 (df = 46; p < .01) and an increase
                                                                  in AIC of 79.64. As inspection of the results revealed
Modelling results
                                                                  no evident misfit, we attribute the significance and
Measurement model. A model with two common                        the increase in AIC to the power afforded by the large
factors representing Reading Ability and Print Expo-              sample size (i.e. the number of twin pairs is 6,072).
sure fitted the data reasonably well: v2(df = 13,                 We note that the BIC, which compared to AIC favours
N = 11,559) = 743.91, p < .001; RMSEA = 0.070                     more parsimonious models, decreased by 229.08.
(0.066–0.074); CFI = 0.931. Based on the inspection               Twin correlations are reported in Table 3.
of modification indices (which indicate possible                     Subsequently, we carried out the decomposition of
sources of misspecification), we allowed the residu-              the phenotypic variances into the A, C and E
als of the two teacher items to covary, and the                   variance components. We did not consider sex
residuals of the two reading tests to covary. This                differences in heritability. Previous work on reading
revised model fitted significantly better than the                ability (de Zeeuw, van Beijsterveldt, Glasner, de
previous one: Dv2(df = 2) = 705.08, p < .001. It                  Geus, & Boomsma, 2016) and the current twin
showed excellent overall fit: v2(df = 11, N = 11,559) =           correlations suggest that the A, C and E variance
38.83, p < .001; RMSEA = 0.015, (0.010–0.020);                    components do not differ between boys and girls.
CFI = 0.997. We used this revised model as our                    Residual variances of the items were also decom-
measurement model (Figure 2).                                     posed. As, the C components of the residual vari-
                                                                  ances (except the one from the last indicator) were all
Behavioural-genetic models. Mean differences in                   close to zero, these were set to zero. To reflect the
item scores between boys and girls were accounted                 correlation between the residuals of the two teacher

© 2018 The Authors. Journal of Child Psychology and Psychiatry published by John Wiley & Sons Ltd on behalf of Association for
Child and Adolescent Mental Health.
6 Elsje van Bergen et al.
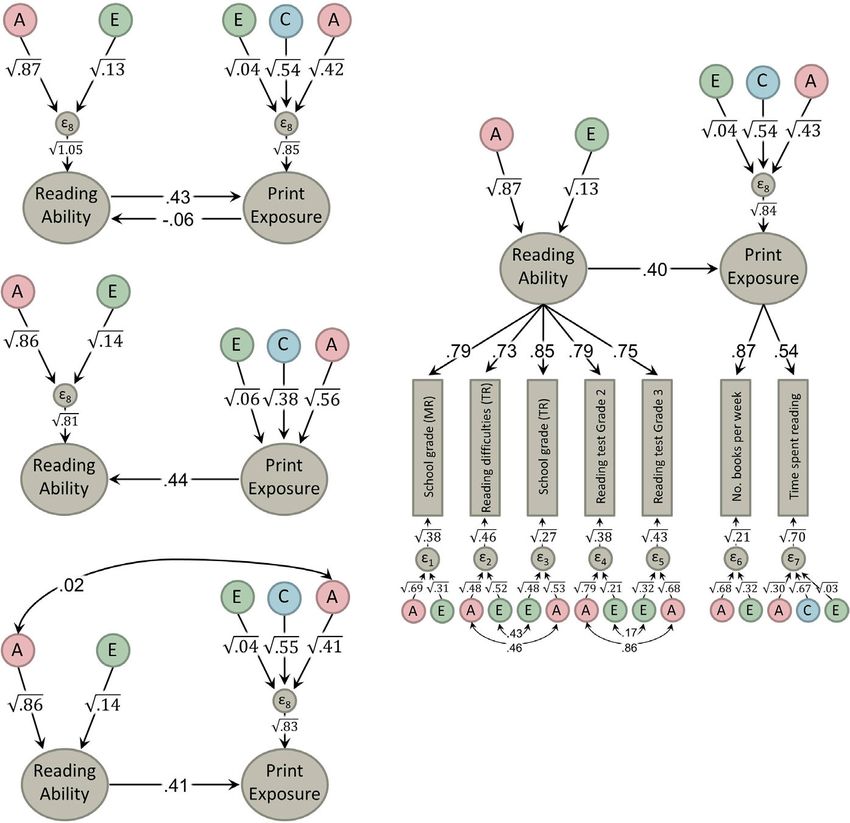
Figure 5 Direction of causality models. In the interest of space, only the top part of the three models on the left-hand side is shown. In
the bidirectional model (top left), the .06 path is not significant (p = .254). The middle left one has a very poor fit. In the bottom left
one, the rA-path of .02 has a p-value of .031. The one on the right-hand side is the one that is parsimonious and supported by the data
Table 3 Within and cross-trait twin correlations is depicted in Figure 3. The contribution of C to the
variance in Reading Ability was estimated at only 1%
MZ DZ
and was not significant (p = .120). As a consequence,
Univariate the correlation between the C factors of reading
Reading ability .86 .43 ability and print exposure could not be estimated
Print exposure .95 .70 reliably. Therefore, we dropped both paths (Dv2-test:
Multivariate
Dv2(df = 2, N = 6,072 pairs) = 9.37, p = .001), result-
Reading ability – Print exposure .33 .12
ing in the model depicted in Figure 4.
We then tested the four causal models depicted in
Figure 5. To get from the correlational model in
items and the correlation between the residuals of Figure 4 to the bidirectional model in Figure 5 (top
the two test items, correlation between their respec- left), two correlations were dropped and two causal
tive As and Es were added. This bivariate ACE model paths were added, resulting in a model with the
© 2018 The Authors. Journal of Child Psychology and Psychiatry published by John Wiley & Sons Ltd on behalf of Association for
Child and Adolescent Mental Health.The causal influence of reading ability on print exposure 7
same number of degrees of freedom. The v2, AIC and readers choose to read less. In fact, we found that
BIC went up by 3.88, indicating only slightly poorer reading ability accounted for 16% of the variance in
fit than the correlational model. The path from print exposure. In addition, other influences, both
Reading Ability to Print Exposure was substantial genetic and shared environmental, are also at play.
and dropping this path (Figure 5, centre left) According to the unexplained variance in the
resulted in a large deterioration in fit: Dv2(df = 1, model, additional genetic factors that influence the
N = 6,072 pairs) = 152.02, p < .001, DAIC = 150.02, amount children read are independent of those
DBIC = 143.31. However, the path from Print Expo- influencing reading skills. We speculate that they
sure to Reading Ability in the bidirectional model may include inherited factors associated with ADHD
was not significant (p = .254) and could be dropped symptomatology, such that more restless children
(Figure 5 right): Dv2(df = 1, N = 6,072 pairs) = 1.35, are less likely to sit down and read than those with
p = .246, DAIC = 0.65, DBIC = 7.37. Finally, we good attentional control. Likewise, we believe that
tested the model in which the association between the shared-environmental component may partly
Reading Ability and Print Exposure was modelled as reflect the values of parents, the supply of books at
both a direct effect (flowing from Reading Ability to home and the importance school places on book
Print Exposure) and common genetic influences. We reading outside of the classroom curriculum. Our
opted for adding a shared genetic effect (i.e. rA), findings also highlight that print exposure is not
rather than a shared nonshared environmental effect something imposed upon the child. Rather the fact
(i.e. rE) because rE hardly contributes to the pheno- that it depends on environmental stimulation (or the
typic association (estimated at only 4%). The fit of absence thereof) and on innate child factors suggests
this final model (Figure 5, bottom left) was exactly that gene–environment correlation is important,
the same as the correlational model in Figure 4. The both passive, evocative and active gene–environment
rA was just .02, so could be left out. To conclude, the (g-e) correlation (Plomin, DeFries, & Loehlin, 1977;
unidirectional causal model ‘reading ability ? print van Bergen, van der Leij, & de Jong, 2014).
exposure’ is both parsimonious and supported by An objection to the present conclusion is that we only
the data. measured reading at one point in time, during the early
stages of reading acquisition (1 year after the com-
mencement of reading instruction in the Netherlands).
Discussion Moreover, the data cannot speak to how the home
The present study applied direction of causation literacy environment might influence, not only chil-
modelling (Duffy & Martin, 1994; Heath et al., 1993) dren’s reading development (Hamilton, Hayiou-Tho-
to a large twin dataset to assess the relationships mas, Hulme, & Snowling, 2016; S enechal & LeFevre,
between reading ability and print exposure. We 2002), but also their motivation to read. However, we
found evidence for a causal influence of reading argue that, given the stability of reading over time, it is
ability on print exposure, consistent with previous unlikely that later levels of print exposure could
findings from behavioural studies (Aarnoutse & van account for future growth in reading, or override the
Leeuwe, 1998; Harlaar et al., 2011; Lepp€ anen et al., powerful g-e correlation that manifest itself in dyslexic
2005). Our findings refute the common belief that readers choosing literary activities less. We contend,
there is an influence of print exposure on reading nonetheless, that longitudinal data are required to
ability, or that there are reciprocal influences validate these assumptions. We also acknowledge
between them. Interestingly, according to a Twitter weaknesses in the measure of print exposure used. In
poll, only 6% of people responding thought that the light of the increased use of screen time, e-readers
reading ability ? print exposure (van Bergen, 2017). and other technologies, the use of parent’s ratings of
The finding that reading ability is the driver of how many books children read outside of school may
print exposure does not, of course, imply that be questioned as a way of measuring print exposure.
exposure to print and thus exposure to orthographic On the other hand, studies have shown that print
forms is irrelevant to learning to read. To become a exposure from digital sources (like email, Wikipedia,
skilled reader, it is undoubtedly important to develop Facebook) is unrelated or only weakly related to
detailed lexical representations of words (Nation, reading ability (McGeown, Osborne, Warhurst, Nor-
2017; Perfetti, 2007). However, while this may take gate, & Duncan, 2016; Pfost, D€ orfler, & Artelt, 2013).
as little as a single exposure in some readers In studying causality, both observational and
(Tamura, Castles, & Nation, 2017), in poor readers, intervention studies are important, but they address
it takes much longer to consolidate new learning different questions. We observed children’s reading
(Share & Shalev, 2004). Moreover, although a fair skills and reading habits and investigated their
assumption is that schools provide the necessary origins in natural settings. Observational research
practice, measures of print exposure on which good like this addresses the ‘what is’ question. In contrast,
and poor readers differ, tap reading outside of school intervention studies address the ‘what could be’
hours. We demonstrate here that whether children question (Plomin, Shakeshaft, McMillan, & Trza-
choose to read for themselves depends, in part, on skowski, 2014). By studying causality in the natural
their reading ability, underlining the fact that poor situation, we demonstrated that reading ability
© 2018 The Authors. Journal of Child Psychology and Psychiatry published by John Wiley & Sons Ltd on behalf of Association for
Child and Adolescent Mental Health.8 Elsje van Bergen et al.
drives print exposure. Ultimately, it is perhaps not Importantly, we found evidence that children’s read-
surprising that in natural settings poorer readers ing level fuels how much they choose to read – it
choose to read less in their spare time. Intervention follows, as practitioners know, that children tend to
studies cannot demonstrate causal processes in the avoid reading if they find it difficult. Interventions
natural situation, and conversely, an observational should focus not only on promoting reading skills
study like the current one cannot say what effects but also motivation to read.
could be achieved by intervention. For instance, our
study does not rule out potential benefits of getting
children to read more than they would normally Supporting information
choose to. Likewise, a successful reading interven- Additional Supporting Information may be found in the
tion may well result in poor readers wanting to read online version of this article:
more, and gains in reading skill may mediate an Appendix S1. Exclusion of participants, same versus
increase in print exposure. To our knowledge, no different classrooms and missing data.
such controlled trial has been conducted. More Table S1. Descriptive sibling data statistics and test
generally, it is known that successful reading inter- statistics for the twin-sib comparison.
Table S2. Missing value analyses: results of t-tests
ventions use evidenced-based programmes with
comparing whether the groups with and without miss-
individualized instruction and may need to be
ing data differ on mother’s educational level.
offered for up to several years to produce lasting Table S3. Missing value analyses: results of t-tests
effects (McDonald Connor et al., 2013; Regtvoort, comparing whether the groups with and without miss-
Zijlstra, & van der Leij, 2013). There is also evidence ing data differ on factor scores of reading ability.
that interventions that focus on phonological aware-
ness and alphabetic skills do not improve reading
outcomes unless emergent phonological skills are Acknowledgements
practised in the context of reading texts or books The Netherlands Twin Register (NTR) is supported by
(Hatcher, Hulme, & Ellis, 1994; Wise, Ring, & Olson, grants from the Netherlands Organization for Scientific
2000). If true, even though print exposure does not Research (NWO), including NWO VENI grant 451-15-
causally influence reading as measured in this 017 awarded to EvB (‘Decoding the gene–environment
study, moving children beyond their ‘natural’ interplay of reading ability’), and NWO grant 480-15-
amount of reading may be a sensible target of 001/674 (‘Netherlands Twin Registry Repository:
intervention, alongside improving decoding skills. researching the interplay between genome and envi-
By using direction of causality modelling, we ronment’), NWO Gravitation grant 024.001.003 (‘the
extend what is known about the context in which Consortium on Individual Development (CID)’).
Furthermore, the NTR is supported by the Avera Insti-
children’s reading skills develop. We show that it is a
tute for Human Genetics, the Royal Netherlands
useful technique for understanding individual dif- Academy of Science’s Professor Award (PAH/6635) to
ferences in reading attainment and the factors which DIB, and the European Union Seventh Framework
determine the enjoyment (or dislike) of reading. We Programme (FP7/2007-2013, 602768, project ACTION:
endorse previous findings of a genetic influence on ‘Aggression in Children: Unravelling gene–environment
word-level reading and extend this to show that the interplay to inform Treatment and InterventiON strate-
same genetic factors influence print exposure cau- gies’). The authors gratefully acknowledge the ongoing
satively and this, in turn, depends on additional contribution of the participants in the NTR, including
genetic and environmental factors. twins, their families and teachers. The authors have
declared that they have no competing or potential
conflicts of interest.
Conclusions
We dissected the association between 7½-year-old
children’s reading ability and reading frequency and Correspondence
volume (called print exposure). We confirmed that Elsje van Bergen, Vrije Universiteit Amsterdam - Biolog-
individual differences in reading ability were mostly ical Psychology, Van der Boechorststraat 1, Amsterdam,
due to genetic differences, while print exposure was 1081 BT, The Netherlands; Email: e.van.bergen@vu.nl;
equally genetic and environmental in origin. Twitter: @drElsje
Key points
• Dyslexic readers typically have low levels of print exposure.
• It cannot be said that poor reading is due to limited reading exposure.
• Individual differences in reading ability are mostly due to genetic differences, whereas individual differences
in print exposure have equal genetic and environmental origins.
• Individual differences in reading ability predict print exposure, rather than vice versa.
© 2018 The Authors. Journal of Child Psychology and Psychiatry published by John Wiley & Sons Ltd on behalf of Association for
Child and Adolescent Mental Health.The causal influence of reading ability on print exposure 9
• Practitioners should not take this to mean that interventions to promote print exposure cannot improve
reading skills.
• Encouraging children to read more is of itself a sensible target.
direction of causation using cross-sectional family data.
References Behavior Genetics, 23, 29–50.
Aarnoutse, C., & van Leeuwe, J. (1998). Relation between Lepp€anen, U., Aunola, K., & Nurmi, J.E. (2005). Beginning
reading comprehension, vocabulary, reading pleasure, and readers’ reading performance and reading habits. Journal of
reading frequency. Educational Research and Evaluation, 4, Research in Reading, 28, 383–399.
143–166. Martin, N.W., Hansell, N.K., Wainwright, M.A., Shekar, S.N.,
Anderson, R.C., Wilson, P.T., & Fielding, L.G. (1988). Growth Medland, S.E., Bates, T.C., . . . & Wright, M.J. (2009). Genetic
in reading and how children spend their time outside of covariation between the Author Recognition Test and reading
school. Reading Research Quarterly, 23, 285–303. and verbal abilities: What can we learn from the analysis of
Cito. (2014). Cito Leerling Volgsysteem. Arnhem, the Nether- high performance? Behavior Genetics, 39, 417–426.
lands: Cito. McDonald Connor, C., Morrison, F.J., Fishman, B., Crowe,
Conners, C.K., Sitarenios, G., Parker, J.D., & Epstein, J.N. E.C., Al Otaiba, S., & Schatschneider, C. (2013). A longitu-
(1998). Revision and restandardization of the Conners dinal cluster-randomized controlled study on the accumu-
Teacher Rating Scale (CTRS-R): Factor structure, reliability, lating effects of individualized literacy instruction on
and criterion validity. Journal of Abnormal Child Psychology, students’ reading from first through third grade. Psycholog-
26, 279–291. ical Science, 24, 1408–1419.
Cunningham, A.E., & Stanovich, K.E. (1997). Early reading McGeown, S.P., Osborne, C., Warhurst, A., Norgate, R., &
acquisition and its relation to reading experience and ability Duncan, L.G. (2016). Understanding children’s reading
10 years later. Developmental Psychology, 33, 934–945. activities: Reading motivation, skill and child characteristics
de Zeeuw, E.L., de Geus, E.J., & Boomsma, D.I. (2015). Meta- as predictors. Journal of Research in Reading, 39, 109–125.
analysis of twin studies highlights the importance of genetic Mol, S.E., & Bus, A.G. (2011). To read or not to read: A meta-
variation in primary school educational achievement. Trends analysis of print exposure from infancy to early adulthood.
in Neuroscience and Education, 4, 69–76. Psychological Bulletin, 137, 267.
de Zeeuw, E.L., van Beijsterveldt, C.E., Glasner, T.J., de Geus, Muth en, L.K., & Muth en, B.O. (1998-2015). Mplus User’s
E.J., & Boomsma, D.I. (2016). Arithmetic, reading and Guide (7th ed.). Los Angeles, CA: Muth en & Muth en.
writing performance has a strong genetic component: A Nation, K. (2017). Nurturing a lexical legacy: Reading experi-
study in primary school children. Learning and Individual ence is critical for the development of word reading skill. npj
Differences, 47, 156–166. Science of Learning, 2, 3.
Duffy, D.L., & Martin, N.G. (1994). Inferring the direction of Olson, R.K., Keenan, J.M., Byrne, B., & Samuelsson, S. (2014).
causation in cross-sectional twin data: Theoretical and empir- Why do children differ in their development of reading and
ical considerations. Genetic Epidemiology, 11, 483–502. related skills? Scientific Studies of Reading, 18, 38–54.
Ebejer, J.L., Coventry, W.L., Byrne, B., Willcutt, E.G., Olson, Perfetti, C. (2007). Reading ability: Lexical quality to compre-
R.K., Corley, R., & Samuelsson, S. (2010). Genetic and hension. Scientific Studies of Reading, 11, 357–383.
environmental influences on inattention, hyperactivity- Pfost, M., D€ orfler, T., & Artelt, C. (2013). Students’ extracur-
impulsivity, and reading: Kindergarten to grade 2. Scientific ricular reading behavior and the development of vocabulary
Studies of Reading, 14, 293–316. and reading comprehension. Learning and Individual Differ-
Gillespie, N.A., Zhu, G., Neale, M.C., Heath, A.C., & Martin, ences, 26, 89–102.
N.G. (2003). Direction of causation modeling between cross- Plomin, R., DeFries, J.C., & Loehlin, J.C. (1977). Genotype-
sectional measures of parenting and psychological distress environment interaction and correlation in the analysis of
in female twins. Behavior Genetics, 33, 383–396. human behavior. Psychological Bulletin, 84, 309.
Hamilton, L.G., Hayiou-Thomas, M.E., Hulme, C., & Snowling, Plomin, R., Shakeshaft, N.G., McMillan, A., & Trzaskowski, M.
M.J. (2016). The home literacy environment as a predictor of (2014). Nature, nurture, and expertise. Intelligence, 45, 46–59.
the early literacy development of children at family-risk of Rebollo, I., de Moor, M.H., Dolan, C.V., & Boomsma, D.I.
dyslexia. Scientific Studies of Reading, 20, 401–419. (2006). Phenotypic factor analysis of family data: Correction
Harlaar, N., Dale, P.S., & Plomin, R. (2007). Reading exposure: of the bias due to dependency. Twin Research and Human
A (largely) environmental risk factor with environmentally- Genetics, 9, 367–376.
mediated effects on reading performance in the primary Regtvoort, A., Zijlstra, H., & van der Leij, A. (2013). The
school years. Journal of Child Psychology and Psychiatry, effectiveness of a 2-year supplementary tutor-assisted com-
48, 1192–1199. puterized intervention on the reading development of begin-
Harlaar, N., Deater-Deckard, K., Thompson, L.A., DeThorne, ning readers at risk for reading difficulties: A randomized
L.S., & Petrill, S.A. (2011). Associations between reading controlled trial. Dyslexia, 19, 256–280.
achievement and independent reading in early elementary Rietveld, M., van Der Valk, J., Bongers, I., Stroet, T., Slag-
school: A genetically informative cross-lagged study. Child boom, P., & Boomsma, D. (2000). Zygosity diagnosis in
Development, 82, 2123–2137. young twins by parental report. Twin Research and Human
Harlaar, N., Trzaskowski, M., Dale, P.S., & Plomin, R. (2014). Genetics, 3, 134–141.
Word reading fluency: Role of genome-wide single-nucleotide S
enechal, M., & LeFevre, J.-A. (2002). Parental involvement in
polymorphisms in developmental stability and correlations the development of children’s reading skill: A five-year
with print exposure. Child Development, 85, 1190–1205. longitudinal study. Child Development, 73, 445–460.
Hatcher, P.J., Hulme, C., & Ellis, A.W. (1994). Ameliorating Share, D.L., & Shalev, C. (2004). Self-teaching in normal and
early reading failure by integrating the teaching of reading disabled readers. Reading and Writing, 17, 769–800.
and phonological skills: The phonological linkage hypothe- Tamura, N., Castles, A., & Nation, K. (2017). Orthographic
sis. Child Development, 65, 41–57. learning, fast and slow: Lexical competition effects reveal the
Heath, A.C., Kessler, R.C., Neale, M.C., Hewitt, J.K., Eaves, time course of word learning in developing readers. Cogni-
L.J., & Kendler, K.S. (1993). Testing hypotheses about tion, 163, 93–102.
© 2018 The Authors. Journal of Child Psychology and Psychiatry published by John Wiley & Sons Ltd on behalf of Association for
Child and Adolescent Mental Health.10 Elsje van Bergen et al.
Thomsen, S.F., van der Sluis, S., Stensballe, L.G., Posthuma, Retrieved from https://twitter.com/drElsje/status/87453
D., Skytthe, A., Kyvik, K.O., . . . & Bisgaard, H. (2009). 8280628486144 [Twitter poll 13th June 2017].
Exploring the association between severe respiratory syncy- van Bergen, E., van der Leij, A., & de Jong, P.F. (2014). The
tial virus infection and asthma: A registry-based twin study. intergenerational multiple deficit model and the case of
American Journal of Respiratory and Critical Care Medicine, dyslexia. Frontiers in Human Neuroscience, 8, 1–13.
179, 1091–1097. Verhoeven, L. (1995). Drie-Minuten-Toets. Handleiding
Toulopoulou, T., Van Haren, N., Zhang, X., Sham, P., Cherny, [Three-Minutes-Test. Manual]. Arnhem, the Netherlands:
S., Campbell, D., . . . & Pol, H. (2015). Reciprocal causation Cito.
models of cognitive vs volumetric cerebral intermediate Verhoeven, L., & van Leeuwe, J. (2009). Modeling the growth of
phenotypes for schizophrenia in a pan-European twin word-decoding skills: Evidence from Dutch. Scientific Stud-
cohort. Molecular Psychiatry, 20, 1386. ies of Reading, 13, 205–223.
van Beijsterveldt, C.E.M., Groen-Blokhuis, M., Hottenga, J.J., Wise, B.W., Ring, J., & Olson, R.K. (2000). Individual
Franic, S., Hudziak, J.J., Lamb, D., . . . & Schutte, N. (2013). differences in gains from computer-assisted remedial
The Young Netherlands Twin Register (YNTR): Longitudinal reading. Journal of Experimental Child Psychology, 77,
twin and family studies in over 70,000 children. Twin 197–235.
Research and Human Genetics, 16, 252.
van Bergen, E. (2017). Children who read more (i.e. have more Accepted for publication: 12 March 2018
print exposure) are better readers. Why do you think this is?.
© 2018 The Authors. Journal of Child Psychology and Psychiatry published by John Wiley & Sons Ltd on behalf of Association for
Child and Adolescent Mental Health.You can also read