Wienerberger Results H1 2019 - Wienerberger AG
←
→
Page content transcription
If your browser does not render page correctly, please read the page content below
Wienerberger Results H1 2019
Disclaimer
Cautionary note regarding forward-looking statements
The information contained in this document has not been independently verified and no
representation or warranty expressed or implied is made as to, and no reliance should be placed
on, the fairness, accuracy, completeness or correctness of this information or opinions contained
herein.
Certain statements contained in this document may be statements of future expectations and
other forward-looking statements that are based on management‘s current view and assumptions
and involve known and unknown risks and uncertainties that could cause actual results,
performance or events to differ materially from those expressed or implied in such statements.
None of Wienerberger AG or any of its affiliates, advisors or representatives shall have any liability
whatsoever (in negligence or otherwise) for any loss howsoever arising from any use of this
document or its content or otherwise arising in connection with this document.
This document does not constitute an offer or invitation to purchase or subscribe for any
securities and neither it nor any part of it shall form the basis of or be relied upon in connection
with any contract or commitment whatsoever.
2
Highlights H1 2019

          Record H1 results highlight consistent
          implementation of value-enhancing growth strategy
          Revenues       € 1,736 mn    | +8%
          EBITDA LFL     € 287 mn      | +33%
          Net profit     € 127 mn      | >100%

          Excellent progress on Fast Forward Program
          H1 earnings contribution € 25 mn

          Confident in delivering our 2019 growth ambition
          Given strong H1 performance, guidance for EBITDA LFL has been narrowed
          down to € 570 – 580 mn (previously € 560 – 580 mn)

                                                                                   3
Highlights H1 2019

          H1 trading environment broadly consistent
          with expectations at the beginning of the year
          Increasing volatility in certain regions in Q2

          Improved product mix and favorable
          pricing drive earnings improvement

          Strong earnings contribution from bolt-on M&A deals

                                                                4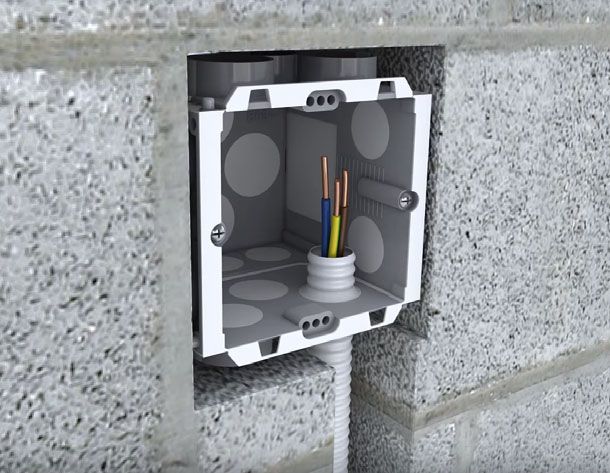
Wienerberger Building Solutions
Excellent performance in H1

› Growth in almost all our core markets   WBS
                                          (in € mn)           H1 2019   H1 2018   Chg. in %
› Early start to building season due to   External revenues   1,074.1     978.4        +10
 favorable weather conditions
                                          EBITDA LFL            219.1     160.5        +37
› Normalization of demand in Q2 as
 expected & increased volatility in       EBITDA                221.7     156.8        +41
 certain end markets
                                          EBITDA LFL margin    20.7%     16.4%            -

› Enhanced share of high added-value
 solutions supports pricing

› Strong earnings contribution from
 consistent implementation of Fast
 Forward Program

› Bolt-on acquisitions show highly
 satisfactory performance

                                                                                              5
Special topic - Brexit
Wienerberger is a leading player in the UK

› Strong performance in H1                Strong industrial base – 15 plants
› Leading market position
› Majority of products for the UK
  market are produced in the UK

› Unique portfolio complemented by
  products from Benelux

› Core market with highly attractive
  long-term outlook

› Underlying need for new housing               Leading market positions
› Structural deficit of domestic brick   #2 in facing bricks   Leading position in roof tiles
  supply

› Long-term commitment confirmed
  with acquisition of BPD Group –
  a specialist producer for roofing
  accessories and wall membranes
  for the off-site housing market
                                                                                           6
Special topic - Brexit
Proactive contingency planning for hard Brexit

Risks              Impact      Wienerberger position
Tariffs under      low         ›   Local production accounts for majority of sales and provides natural hedge
WTO agreement
                               ›   Duties on imports of building materials are negligible under WTO
                                   agreements
                               ›   Local organization is prepared to operate in new customs regime

Congestion at UK   low /       ›   Increased stocks of imported products in the UK
border             temporary
                               ›   Stocking up inventories for spare parts as buffer for expected delays to
                                   secure continuity of supply
                               ›   Enhanced usage of vessels loaded at Wienerberger wharves and
                                   discharging at smaller UK ports
                               ›   Discharging directly into our storage facilities at the port allows for single
                                   customs clearance for entire cargo

Potential          medium      ›   Base case
cooldown of UK                     ›   Sound market environment to continue
housing activity
                                   ›   Underlying need for new housing is supported by Help to Buy and
                                       availability of mortgages
                                   ›   Products from Benelux remain a core element of our unique product
                                       portfolio and help address domestic structural supply deficit
                               ›   Bear case
                                   ›   Contingency plans for adjusting our cost position to market demand           7
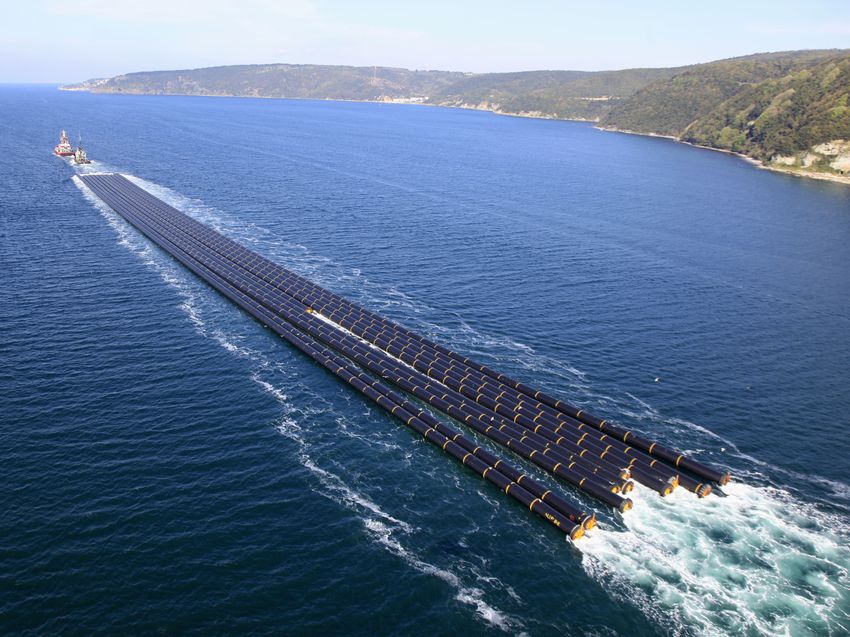
Wienerberger Piping Solutions
Significant earnings growth

› Normalization of demand in-line with         WPS
                                               (in € mn)           H1 2019   H1 2018   Chg. in %
 expectations after strong start to the year

› Strong growth in electro business            External revenues     497.0     478.5         +4

                                               EBITDA LFL             51.7      35.2        +47
› Earnings increase in water management
 activities supported by improving             EBITDA                 51.1      20.7       >100
 demand in Eastern Europe
                                               EBITDA LFL margin    10.3%      7.3%            -

› Increasing project volumes in the energy
 sector drive growth with special pipes

› Improved product mix and proactive
 price policy support earnings growth

› Successful delivery on EBITDA
 enhancement from Fast Forward projects

                                                                                                   8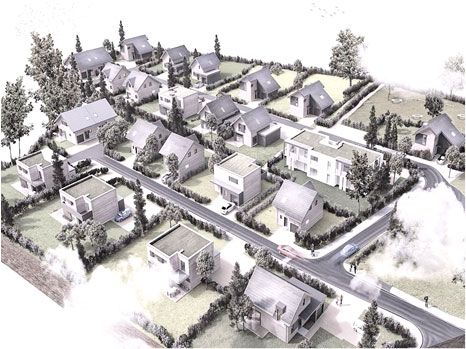
North America
Mixed developments in H1

› Sound demand for facade solutions in     North America
                                           (in € mn)           H1 2019   H1 2018   Chg. in %
 our relevant core markets

› Strong earnings contribution from        External revenues     164.9     149.3        +10

 acquired facing brick producer            EBITDA LFL             15.8      19.3         -18

› Stricter housing market regulation       EBITDA                 22.8      21.4         +7
 continued to weigh on our Canadian
                                           EBITDA LFL margin    10.6%     12.9%            -
 business

› US plastic pipe business could not
 match prior year’s record result due to
 weather related project delays

› Fast Forward optimization measures
 contributed to earnings improvement

                                                                                               9
Special topic – Labor shortage across our regions
Major challenges …

       Limiting factor for housing
       activity

       Delays of started projects

       Major cost driver

       High performance building
       materials may underperform
       due to wrong handling

                                                    10
Special topic – Labor shortage across our regions
… and interesting opportunities
OUR SOLUTIONS
Expanding our share in the value chain
PREFABRICATION AUTOMATION
Partner for entire projects
Increasing our service revenue
contribution
Cost reduction and more reliable SERVICES SMART SYSTEMS
planning for our customers
Improving quality through
easier handling
11Enhancing our sustainable business model
Sustainability Roadmap 2020
› Our Sustainability Accident frequency rate -50%
Roadmap 2020 is a self-
imposed commitment to
continuously improve our
ecological, social, societal
Recycled materials in
and economic plastic pipes
+28%
performance across the
entire value creation
process
Revenue share of
+500bp
› Strategic considerations innovative products
take into account the
interests of our
organization as well as
Incidents of corruption 0
those of our stakeholders
Specific CO2 emissions -800bp
Significant
progress 1)
1) Refers to the development between 2013 - 2018 12OUTLOOK 2019
Business development
Growth drivers for 2019

1                  2                          3                        4
                                                  Continued delivery       Disciplined M&A
    Sound market       Solutions offering         of Fast Forward          to strengthen
    environment        across the portfolio       Program                  core platforms

                                                                                             14
Market development 2019
Wienerberger Building Solutions
› Trading environment broadly
confirms expectations from
the beginning of the year
› Slight growth in European
residential construction
› Increasing volatility in
certain regions
Market growth (>2%)
Stable development
Market decline (Market development 2019
Wienerberger Piping Solutions
› Sound environment in
European piping markets
confirms expectations
› Stable development in
Western Europe
› Sound Nordic markets
› Eastern Europe remains
growth region with certain
markets showing signs of
stabilization
Market growth (>2%)
Stable development
Market decline (Market development 2019
North America
› North American end markets
show mixed trends
› Slight growth in our relevant brick
markets
› Unfavorable weather conditions
limit growth in otherwise sound US
piping markets
Pipes USA
› Government measures causing
slowdown of housing activity in
relevant Canadian markets
Market growth (>2%)
Stable development
Market decline (Outlook 2019
Confident in delivery – narrowing guidance range
600
+77 580
+67 570
550
+41 503
in € mn
500
462
450
400
EBITDA LFL 2018 IFRS 16 EBITDA LFL 2018 EBITDA EBITDA LFL 2019
incl. FX base improvement guidance
Note: Rounding differences may arise from automatic processing of data 18Outlook 2019
Strong commitment to updated goals
EBITDA LFL € 570 mn - € 580 mn
vs. previously € 560 mn - € 580 mn
Normal capex ~ € 200 mn
Growth capex € 47 mn invested in H1 2019
We continue to work on a highly attractive
deal pipeline and expect to move ahead on
a number of M&A opportunities
19KEY FINANCIALS
H1 2019
Record performance

                                    Revenues                                                                                   EBITDA LFL 2)

                    € 1,736.4 mn                                                                                          € 286.6 mn
                   (H1 2018: € 1,606.9 mn | +8%)                                                                         (H1 2018: € 214.9 mn | +33%)

                                    LFL 1): +6%

                                    Net profit                                                                              EBITDA LFL margin

                       € 126.9 mn                                                                                               16.8%
                   (H1 2018: € 53.2 mn | >100%)                                                                           (H1 2018: 13.4% | +340 bp)

1) Adjusted for effects from consolidation and FX
2) Adjusted for effects from consolidation, sale of non-strategic and non-operating assets, FX, structural adjustments
Note: H1 19 EBITDA LFL includes an effect of € 21.3 mn from the implementation of IFRS 16                                                               21
Operating performance
Strong growth of EBITDA LFL
320
300 295.7
286.6 EBITDA
-9.1 adjustment (€ mn) H1 19 H1 18
280
EBITDA reported 2) 295.7 198.9
260
FX +1.4 -
in € mn
240
Consolidation -8.0 -
220 +16.0 214.9 Sale of assets 3) -3.2 -9.3
Structural
200 198.9 adjustments +0.7 +25.3
Total adjustment -9.1 +16.0
180
EBITDA LFL 2) 286.6 214.9
160
EBITDA Adjustment EBITDA EBITDA Adjustment EBITDA
reported LFL basis reported LFL
H1 18 H1 18 1) H1 19 2) H1 19 2)
1) H1 2018 EBITDA not adjusted for IFRS 16
2) Includes an effect of € 21.3 mn from the implementation of IFRS 16
3) Sale of non-strategic and non-operating assets
Note: Rounding differences may arise from automatic processing of data 22Income statement Net result more than doubled in € mn H1 2019 H1 2018 Chg. in % Revenues 1,736.4 1,606.9 +8 EBITDA LFL 286.6 214.9 +33 EBITDA 295.7 198.9 +49 EBIT 181.5 107.7 +69 Financial result -14.8 -21.1 +30 Profit before tax 166.7 86.6 +93 Income taxes -32.9 -27.1 -21 Hybrid coupon and non-controlling interests -6.9 -6.3 -8 Net result 126.9 53.2 >100 EPS 1.11 0.46 >100 Note: Rounding differences may arise from automatic processing of data 23
Accounting change
Impact of IFRS 16 implementation

› Extension of the balance sheet                                         Impact of implementation
                                                                         in H1 19
    › Recognition of “Right of Use Asset” and “Lease Liability”
› Effects on income statement                                            Income Statement       in € mn

    › ↑ EBITDA: no rental / leasing expenses                               EBITDA                +21.3

    › ↑ EBIT: Rental / lease cost is broken down into depreciation of      Depreciation           -20.8
        “Right of Use Asset” and interest on the “Lease Liability”
                                                                           EBIT                     +0.6
    › ↓ Interest result: interest on “Lease Liability”                     Interest result          -1.7
› Change in accounting standard has no impact on                           Net income               -1.2
    underlying cash flows
                                                                         Balance sheet          in € mn

                                                                           Change of net debt   +160.6

          € 21.3 mn effect on EBITDA in H1 19

Note: Rounding differences may arise from automatic processing of data                                24
Cash flow development Gross cash flow reflects strong earnings increase in € mn H1 2019 H1 2018 Chg. in € mn Chg. in % Gross cash flow 215.4 132.6 +82.8 +62 Change in working capital 1) -210.3 -193.5 -16.7 -9 Normal capex -68.5 -60.7 -7.9 -13 Divestments and other 2) -17.3 +74.2 -91.5
Balance sheet
Sound ratios despite IFRS 16 impact

                                                                                                                                Chg. in % vs.
 in € mn                                                                                   30/6/2018   31/12/2018   30/6/2019    31/12/2018

 Equity 1)                                                                                 1,855.9      1,939.1     1,980.4              +2
 Equity ratio                                                                                  47%          52%         49%                 -
 Net debt                                                                                    778.7        631.6       982.3             +56
 Net debt / EBITDA 2)                                                                           1.8          1.4         1.8                -
 Gearing                                                                                       42%          33%         50%                 -

1) Including non-controlling interest and hybrid capital (100% equity according to IFRS)
2) Calculated based on 12-months EBITDA
Note: Rounding differences may arise from automatic processing of data                                                                      26
Development of net debt
IFRS 16 and WC seasonality cause increase
1 200
1 000 +208.9 982.3
800 +160.6
631.6 +115.8
in € mn
600
+81.0
400 -215.4
200
0
31/12/2018 Gross Dividend, Total IFRS 16 Working capital 30/6/2019
cash flow Hybrid coupon, capex & others
Share & hybrid buyback
Note: Rounding differences may arise from automatic processing of data 27Financing
Balanced financing structure
› Cash 30/6/2019: € 99 mn
› Credit lines: € 400 mn
› Thereof drawn 30/6/2019: € 70 mn
› Term structure:
600
500
400
Undrawn credit lines
in € mn
300
200
First-Call Date Hybrid
100
0
2019 2020 2021 2022 2023 after 2023
Maturities Cash balance
Note: Term structure of gross debt excluding lease liability, cash position and financial liabilities as of 30/6/2019 28wienerberger geared for growth
You can also read