Will mortgages and markets stay afloat in Florida? - Climate risk and response: Physical hazards and socioeconomic impacts Case study April 2020 ...
←
→
Page content transcription
If your browser does not render page correctly, please read the page content below

Climate risk and response: Physical hazards and socioeconomic impacts

Will mortgages
and markets stay
afloat in Florida?
Case study
April 2020
McKinsey Global Institute

Since its founding in 1990, the McKinsey     innovation, and urbanization. Recent        partners and industry and management
Global Institute (MGI) has sought to         reports have assessed the digital           experts. The MGI Council is made
develop a deeper understanding of the        economy, the impact of AI and automation    up of leaders from McKinsey offices
evolving global economy. As the business     on employment, income inequality,           around the world and the firm’s sector
and economics research arm of McKinsey       the productivity puzzle, the economic       practices and includes Michael Birshan,
& Company, MGI aims to provide leaders       benefits of tackling gender inequality,     Andrés Cadena, Sandrine Devillard,
in the commercial, public, and social        a new era of global competition,            André Dua, Kweilin Ellingrud,
sectors with the facts and insights          Chinese innovation, and digital and         Tarek Elmasry, Katy George, Rajat Gupta,
on which to base management and              financial globalization.                    Eric Hazan, Acha Leke, Gary Pinkus,
policy decisions.                                                                        Oliver Tonby, and Eckart Windhagen.
                                             MGI is led by three McKinsey & Company      The Council members help shape the
MGI research combines the disciplines of     senior partners: James Manyika,             research agenda, lead high-impact
economics and management, employing          Sven Smit, and Jonathan Woetzel.            research and share the findings with
the analytical tools of economics with       James and Sven also serve as co-chairs      decision makers around the world. In
the insights of business leaders. Our        of MGI. Michael Chui, Susan Lund,           addition, leading economists, including
“micro-to-macro” methodology examines        Anu Madgavkar, Jan Mischke,                 Nobel laureates, advise MGI research.
microeconomic industry trends to better      Sree Ramaswamy, Jaana Remes,
understand the broad macroeconomic           Jeongmin Seong, and Tilman Tacke are        The partners of McKinsey fund MGI’s
forces affecting business strategy and       MGI partners, and Mekala Krishnan is an     research; it is not commissioned by
public policy. MGI’s in-depth reports have   MGI senior fellow.                          any business, government, or other
covered more than 20 countries and                                                       institution. For further information about
30 industries. Current research focuses      Project teams are led by the MGI            MGI and to download reports for free,
on six themes: productivity and growth,      partners and a group of senior fellows      please visit
natural resources, labor markets, the        and include consultants from McKinsey       www.mckinsey.com/mgi.
evolution of global financial markets,       offices around the world. These teams
the economic impact of technology and        draw on McKinsey’s global network of

In collaboration with McKinsey & Company's Sustainability and Global Risk practicies
McKinsey & Company’s Sustainability          advances and enable lasting performance     landscape accelerated and amplified by
Practice helps businesses and                improvements for new players and            social media. We apply deep technical
governments reduce risk, manage              incumbents alike.                           expertise, extensive industry insights,
disruption, and capture opportunities        www.mckinsey.com/sustainability             and innovative analytical approaches to
in the transition to a low-carbon,                                                       help organizations build risk capabilities
sustainable-growth economy. Clients          McKinsey & Company’s Global Risk            and assets across a full range of risk
benefit from our integrated, system-         Practice partners with clients to go        areas. These include financial risk,
level perspective across industries from     beyond managing risk to enhancing           capital and balance sheet–related risk,
energy and transport to agriculture and      resilience and creating value.              nonfinancial risks (including cyber, data
consumer goods and across business           Organizations today face unprecedented      privacy, conduct risk, and financial crime),
functions from strategy and risk to          levels and types of risk produced by        compliance and controls, enterprise risk
operations and digital technology. Our       a diversity of new sources. These           management and risk culture, model risk
proprietary research and tech-enabled        include technological advances              management, and crisis response and
tools provide the rigorous fact base         bringing cybersecurity threats and          resiliency—with a center of excellence for
that business leaders and government         rapidly evolving model and data risk;       transforming risk management through
policy makers need to act boldly with        external shifts such as unpredictable       the use of advanced analytics.
confidence. The result: cutting-edge         geopolitical environments and climate       www.mckinsey.com/
solutions that drive business-model          change; and an evolving reputational risk   business-functions/risk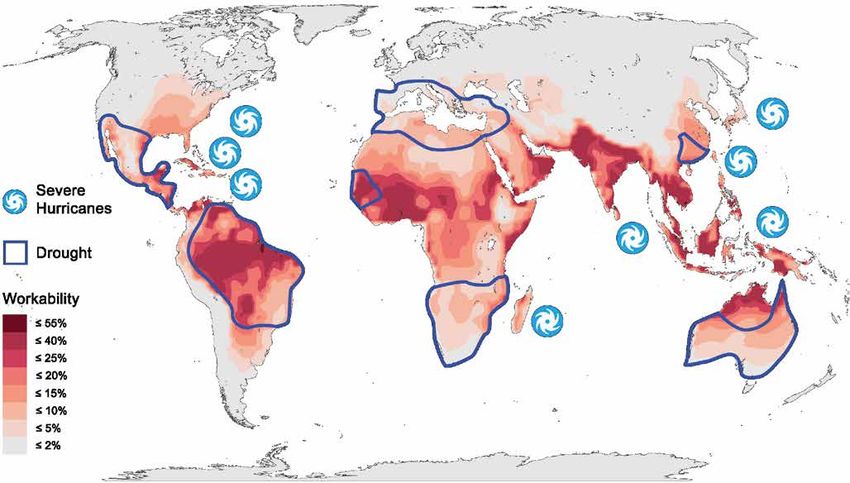
Will mortgages
                               and markets stay
                               afloat in Florida?
                               Case study
                               April 2020

Authors
Jonathan Woetzel, Shanghai

Dickon Pinner, San Francisco

Hamid Samandari, New York

Hauke Engel, Frankfurt

Mekala Krishnan, Boston

Claudia Kampel, Stuttgart

Marlies Vasmel, Amsterdam
4

Introduction to case studies

In January 2020, the McKinsey Global Institute published Climate risk and response: Physical
hazards and socioeconomic impacts. In that report, we measured the impact of climate
change by the extent to which it could affect human beings, human-made physical assets,
and the natural world. We explored risks today and over the next three decades and examined
specific cases to understand the mechanisms through which climate change leads to
increased socioeconomic risk. This is one of our case studies, focused on Florida.

We investigated cases that cover a range of sectors and geographies and provide the basis
of a “micro-to-macro” approach that is a characteristic of McKinsey Global Institute research.
To inform our selection of cases, we considered over 30 potential combinations of climate
hazards, sectors, and geographies based on a review of the literature and expert interviews
on the potential direct impacts of physical climate hazards. We found these hazards affect five
different key socioeconomic systems: livability and workability, food systems, physical assets,
infrastructure services, and natural capital.

We ultimately chose nine cases to reflect these systems and based on their exposure to the
extremes of climate change and their proximity today to key physiological, human-made, and
ecological thresholds (Exhibit 1). As such, these cases represent leading-edge examples of
climate change risk. Each case is specific to a geography and an exposed system, and thus
is not representative of an “average” environment or level of risk across the world. Our cases
show that the direct risk from climate hazards is determined by the severity of the hazard and
its likelihood, the exposure of various “stocks” of capital (people, physical capital, and natural
capital) to these hazards, and the resilience of these stocks to the hazards (for example, the
ability of physical assets to withstand flooding). We typically define the climate state today as
the average conditions between 1998 and 2017, in 2030 as the average between 2021 and
2040, and in 2050 between 2041 and 2060. Through our case studies, we also assess the
knock-on effects that could occur, for example to downstream sectors or consumers. We
primarily rely on past examples and empirical estimates for this assessment of knock-on
effects, which is likely not exhaustive given the complexities associated with socioeconomic
systems. Through this “micro” approach, we offer decision makers a methodology by which to
assess direct physical climate risk, its characteristics, and its potential knock-on impacts.

Climate science makes extensive use of scenarios ranging from lower (Representative
Concentration Pathway 2.6) to higher (RCP 8.5) CO2 concentrations. We have chosen to
focus on RCP 8.5, because the higher-emission scenario it portrays enables us to assess
physical risk in the absence of further decarbonization. (We also choose a sea level rise
scenario for one of our cases that is consistent with the RCP 8.5 trajectory). Such an
“inherent risk” assessment allows us to understand the magnitude of the challenge and
highlight the case for action. Our case studies cover each of the five systems we assess to
be directly affected by physical climate risk, across geographies and sectors. While climate
change will have an economic impact across many sectors, our cases highlight the impact on
construction, agriculture, finance, fishing, tourism, manufacturing, real estate, and a range of
infrastructure-based sectors. The cases include the following:

— For livability and workability, we look at the risk of exposure to extreme heat and humidity
  in India and what that could mean for that country’s urban population and outdoor-based
  sectors, as well as at the changing Mediterranean climate and how that could affect
  sectors such as wine and tourism.

Climate risk and response | Case study: Florida                                                    5
— For food systems, we focus on the likelihood of a multiple-breadbasket failure affecting
      wheat, corn, rice, and soy, as well as, specifically in Africa, the impact on wheat and coffee
      production in Ethiopia and cotton and corn production in Mozambique.

    — For physical assets, we look at the potential impact of storm surge and tidal flooding
      on Florida real estate and the extent to which global supply chains, including for
      semiconductors and rare earths, could be vulnerable to the changing climate.

    — For infrastructure services, we examine 17 types of infrastructure assets, including
      the potential impact on coastal cities such as Bristol in England and Ho Chi Minh City
      in Vietnam.

    — Finally, for natural capital, we examine the potential impacts of glacial melt and runoff
      in the Hindu Kush region of the Himalayas; what ocean warming and acidification could
      mean for global fishing and the people whose livelihoods depend on it; as well as potential
      disturbance to forests, which cover nearly one-third of the world’s land and are key to the
      way of life for 2.4 billion people.

6   McKinsey Global Institute
Ex
Exhhib
ibit
it 1
We have selected nine case studies of leading-edge climate change impacts across all
major geographies, sectors, and affected systems.
7
2
5
1 6
4 7
Global case studies 3 8 9
Heat stress1 Low High Highest drought risk in 20502 Increase in hurricane/cyclone severity
1 Will India get too hot to work?
Livability and workability
2 A Mediterranean basin without a Mediterranean climate?
3 Will the world’s breadbaskets become less reliable?
Food systems
4 How will African farmers adjust to changing patterns of precipitation?
5 Will mortgages and markets stay afloat in Florida?
Physical assets
6 Could climate become the weak link in your supply chain?
7 Can coastal cities turn the tide on rising flood risk?
Infrastructure services
8 Will infrastructure bend or break under climate stress?
Natural capital 9 Reduced dividends on natural capital?
1. Heat stress measured in wet-bulb temperatures.
2. Drought risk defined based on time in drought according to Palmer Drought Severity index (PDSI).
Source: Woods Hole Research Center; McKinsey Global Institute analysis
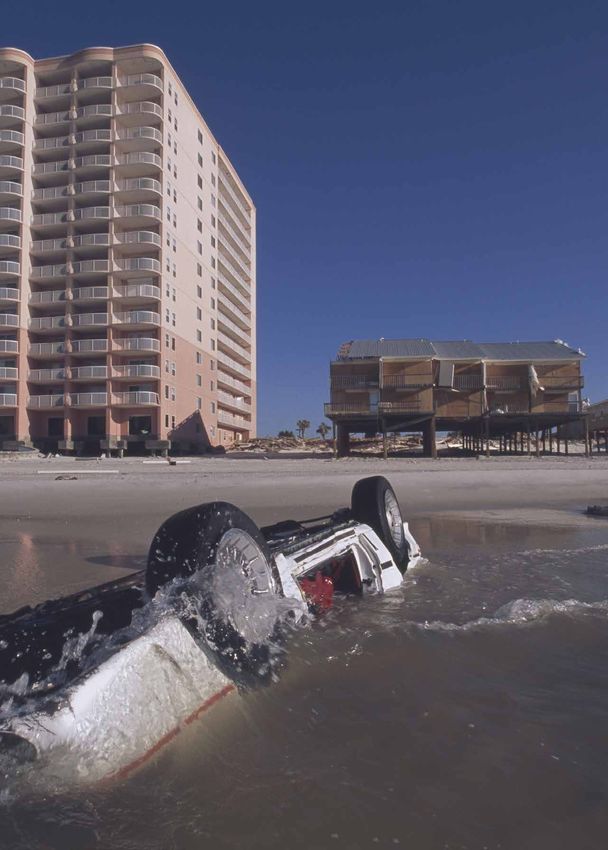
Climate risk and response | Case study: Florida 7Car in surf after Hurricane Ivan at Pensacola, Florida. © Tyrone Turner/National Geographic
Florida
Will mortgages and markets stay afloat in Florida?
Florida’s beaches and climate make it a popular location to live in the United States. But
like many coastal areas around the world today, Florida is increasingly subject to extreme
flooding. In the United States alone, approximately 30 percent of the population lives in
counties adjacent to the Atlantic Ocean, Pacific Ocean, or Gulf of Mexico, where flooding
and storm hazards are projected to grow.1 However, Florida, with its low-lying terrain, large
coastline and share of population exposed to climate change effects, as well as its economic
dependence on real estate, may be particularly at risk (see Box 1, “What makes Florida so
vulnerable to flooding risk?”). In addition, the fact that multiple climate hazards occur in the
same place can increase the overall risk profile. In this case study, we focus primarily on
residential property in Florida exposed to flooding from storm surges and to tidal flooding,
and assess the potential impact.2

Today, average annual losses for residential real estate due to storm surge damage in Florida
are $2 billion and could increase to about $2.5 billion to $3 billion by 2030 and $3 billion
to $4.5 billion by 2050, in our inherent risk assessment, absent adaptation and mitigation
action. 3 However, these represent statistically average losses; losses in each year could be
higher or lower. Damages from extreme 1-in‑100-year storm surge events could be more
substantial; damages from such extreme events are expected to be $35 billion today and
could grow by 40 to 110 percent to $50 billion to $75 billion by 2050. 4 The frequency of tidal
flooding from rising sea levels is expected to grow from a few days a year to 30 to 60 times per
year in 2030 and more than 200 times per year in 2050. 5

1
    Darryl T. Cohen, “Coastline county population continues to grow,” US Census Bureau, August 6, 2018.
2
    The analyses in this case rely on sea level rise projections going forward. We have based the analyses on sea level rise
    in line with the US Army Corps of Engineers high curve, one of the recommended curves from the Southeast Florida
    Regional Climate Change Compact. See Southeast Florida Regional Climate Change Compact Sea Level Rise Work
    Group, Unified sea level rise projection: Southeast Florida, October 2015. High curve results in 1.5m eustatic sea level rise
    by 2100 and is within the range of RCP 8.5. Recent observational evidence finds that sea level rise is accelerating and
    may occur faster than previous models predicted. See M. Oppenheimer et al., “Sea Level Rise and Implications for Low-
    Lying Islands, Coasts and Communities,” in IPCC Special Report on the Ocean and Cryosphere in a Changing Climate,
    2019; Jevrejeva et al., 2014 for details.
3
    Lower end of range based on analysis by KatRisk (referred to as KatRisk 2019); direct average annual losses to all
    residential real estate (insured and uninsured properties). This is the long-term statistical average loss expected in any
    one year, calculated by modeling the probability of a climate hazard occurring multiplied by the damage should that
    hazard occur, and summing over events of all probabilities. Upper end based on assuming an increase in exposure of real
    estate based on historical rates of increase.
4
    This analysis is based only on the impacts of storm surge, where sea level rise is expected to increase the damages from
    storm surge. More broadly, considering the hurricane hazard, while total hurricane frequency is expected to remain
    unchanged or to decrease slightly under increased global warming, cumulative hurricane rainfall rates, average intensity,
    and proportion of storms that reach Category 4–5 intensity are projected to increase, even for a 2°C or less increase
    in global average temperatures. Thomas Knutson et al., Tropical cyclones and climate change assessment: Part II.
    Projected response to anthropogenic warming, American Meteorological Society, 2019.
5
    Analysis by First Street Foundation, 2019.

Climate risk and response | Case study: Florida                                                                                9
Location matters
The potential impact of storm surge is not spread evenly across the state: three counties
(Miami-Dade, Lee, and Collier) account for roughly half of the average annual losses.6 For
extreme storm surge events, damages in Miami-Dade could amount to the equivalent of
about 10 percent of total market value in a given year, about 30 percent in Lee, and about
20 percent in Collier.
Box 1.
What makes Florida so vulnerable to flooding risk?
Florida has a number of physical, economic, and demographic characteristics that make
it vulnerable to flooding.
Physical vulnerabilities include:
— Multiple hazards drive risk: storm surge, wind speed, precipitation, and sea level rise.
— A porous limestone foundation makes it hard to protect with sea walls.
— Sea level rise pushes more saltwater inland and into the porous
limestone foundation.
— Climate change increases the abundance of toxic algae blooms and seaweed piles
on beaches, reducing the attractiveness of living near coastal waters.
Economic vulnerabilities include:
— 22 percent of GDP is from real estate (Florida’s GDP is $1 trillion, comparable to
the Netherlands’).
— 30 percent of local government tax revenue comes from property taxes.
— 42 percent of median wealth in the United States is from real estate.
Demographic vulnerabilities include:
— Two-thirds of the population lives near the coastline (defined as counties that border
coastal water or territorial seas).
— 10 percent of the population is located less than 1.5 meters above sea level.
— 27 percent of housing units are on a 100-year floodplain, an area that has a 1 percent
chance of a flood in any given year.
— From 2010 to 2018, the population of Miami-Dade, a low-lying and populous part
of the state, increased by 11 percent while building permits increased by over
200 percent.
— 6.5 percent of the US population lives in Florida, but accounted for 11 percent of all
building permits issued in 2018.
6
Analysis supported by KatRisk; McKinsey Global Institute analysis.
10 McKinsey Global InstituteFinancial markets may recognize today’s risk and future risk, resulting in knock-
on impacts
Even if Florida is spared another destructive hurricane in the next ten to 30 years, climate
change could affect the state’s economy through adjustments in asset prices, as buyers
start to recognize climate risk and as insurance premiums adjust. For example, home owners
may change their expectations as properties and the roads adjacent to them are subject to
increased tidal flooding. We estimate the potential impact of the progressive devaluation
of homes. To do this, we rely on quantitative analysis that compares the prices of exposed
properties to similar unexposed ones, as is typical in the literature.7 We do not estimate if
and how much prices of homes could rise or fall in absolute terms, but rather how much tidal
flooding could impact the prices of exposed homes, all else being equal. Based on historical
experience, we conservatively estimate a total devaluation of about $10 billion to $30 billion of
affected homes by 2030, rising to $30 billion to $80 billion by 2050, or about the equivalent
of a 5 to 15 percent impact in 2030 and 15 to 35 percent in 2050, all else being equal. The
devaluation could be larger, and potentially result in an absolute decline in the value of homes
relative to their prices today, for example, if flooding regularly affects public infrastructure or if
home owners more aggressively factor climate risk into their buying decisions.
Other knock-on impacts
Lower real estate prices could in turn have further knock-on effects, including forgone
property taxes, reduced wealth and spending by home owners, and changes in government
spending. Business activity could be negatively affected, as could mortgage financing in
high-risk areas.
While the pace and magnitude of home price adjustments and their knock-on effects are
unclear and difficult to predict, what is clear is that without action, certain communities in
Florida could eventually look vastly different than they do today. Communities in Florida have
already started to adapt and plan for climate change effects, and more will need to be done. 8
Policy makers, home owners, and investors should consider strategically what to protect, how
to protect it, and how to minimize exposure to climate risk. We explore these areas in greater
detail below. Florida has an opportunity to plan effectively for the future and identify a path
to sustainable, equitable adaptation that can help manage some of climate change’s most
severe effects and in the process, serve as a guide for other coastal communities around
the world.
7
Much of the literature on this topic finds that, at least historically, prices of exposed properties have risen slower than
prices of unexposed properties, rather than observed a decline in absolute terms of exposed property prices to date.
The impact of climate change on property prices is thus seen as a “lost appreciation.” See, for example, Jesse M. Keenan,
Thomas Hill, and Anurag Gumber, “Climate gentrification: From theory to empiricism in Miami-Dade County, Florida,”
Environmental Research Letters, May 2018, Volume 13, Number 5; Steven A. McAlpine and Jeremy R. Porter, “Estimating
recent local impacts of sea level rise on current real-estate losses: A housing market case study in Miami-Dade, Florida,”
Population Research and Policy Review, December 2018, Volume 37, Number 6; and Asaf Bernstein, Matthew T.
Gustafson, and Ryan Lewis, “Disaster on the horizon: The price effect of sea level rise,” Journal of Financial Economics,
November 2019, Volume 134, Number 2. Importantly, our analysis here is not a prediction, and home prices could devalue
much more severely and much faster, and even decline in absolute terms relative to today, depending on how market
sentiments evolve, how lending activity continues, and what adaptation measures are put in place.
8
Since 2016, Miami-Dade County has adopted nearly 20 climate change resolutions, ranging from assessments to
understand the risk of sea level rise and saltwater intrusion to developing TV programming on local stations that
educates the public about rising waters.
Climate risk and response | Case study: Florida 11An economically important and populous state, Florida is already
experiencing the impact of climate change
Florida is the fourth-largest state economy and third-most-populous US state.9 Its $1 trillion
GDP is roughly the same size as the Netherlands’, and its population has grown by 13 percent
since 2010.10 Florida’s economy depends heavily on real estate. In 2018, real estate accounted
for 22 percent of state GDP.11 Real estate also represents an important part of household
wealth for the 65 percent of Floridians who are home owners: primary residences represent
42 percent of median home owner wealth in the United States.12 In a state without individual
income tax, the public sector relies on real estate as a key source of revenue. Approximately
30 percent of local government tax revenue comes from property taxes directly tied to
property values.13
Multiple physical vulnerabilities increase climate risk
At the same time, Florida’s geography makes it vulnerable to climate change. Located in a
tropical cyclone zone with low elevation and an expansive coastline, the state faces numerous
climate hazards, including hurricane damage and tidal flooding that are worsened by sea
level rise, and heat stress due to rising temperatures and changes in humidity. Other unique
features include the state’s porous limestone foundation which can exacerbate flooding as
water seeps into properties from the ground below and also cause saltwater intrusion into
water aquifers, making adaptation challenging.
We focus on the evolution of flooding impact, a climate hazard that causes significant real
estate damage across Florida. The frequency of tidal flooding is increasing in Florida due
to sea level rise. Since 2007, southern Florida has experienced an average of more than
two weeks of so-called nuisance tidal flooding annually.14 In the prior decade, the region
experienced just four days a year on average.15 Over the past several decades, attribution
studies have shown that at least three major landfalling hurricanes in the United States were
made more likely or the impacts more severe due to climate change, including Hurricane
Katrina, Hurricane Sandy, and Hurricane Harvey.16 An increasing trend in hurricane intensity
(in terms of wind speed, rainfall, and storm surge height), and the proportion of storms that
reach Category 4 and 5, is projected to emerge given further warming.17
9
US Bureau of Economic Analysis, May 1, 2019; US Census Bureau Population Division, July 1, 2018, accessed July 2019.
10
In 2018, GDP in Florida (not seasonally adjusted) was roughly $1.04 trillion, and in the Netherlands, $912 billion, according
to the Federal Reserve Bank of St. Louis FRED database and the World Bank. Florida’s population was 18.8 million in
2010 and 21.3 million in 2018, according to US Census Bureau, December 2018.
11
National Association of Realtors, The economic impact of a typical home sale in Florida, 2018.
12
Federal Reserve Bank of St. Louis, FRED database, Homeownership rate for Florida, fred.stlouisfed.org/series/
FLHOWN; Michael Neal, “Housing remains a key component of household wealth,” Eye on Housing, National Association
of Home Builders, September 4, 2013.
13
Other income sources are value-added taxes, fees, and business revenues. For more details, see Household wealth &
real estate, UPFINA, September 2018.
14
Nuisance flooding is defined as 1.1 feet above mean higher high water (MHHW). Estimates based on tidal flooding risk;
NOAA’s Vertical Datum Transformation tool used to determine local mean sea level and local MHHW along the Florida
coast. Future predicted sea levels are taken from the US Army Corps of Engineers. See Steven A. McAlpine and Jeremy
R. Porter, “Estimating recent local impacts of sea level rise on current real-estate losses: A housing market case study in
Miami-Dade, Florida,” Population Research and Policy Review, December 2018, Volume 37, Number 6.
15
Steven A. McAlpine and Jeremy R. Porter, “Estimating recent local impacts of sea level rise on current real-estate
losses: A housing market case study in Miami-Dade, Florida,” Population Research and Policy Review, December 2018,
Volume 37, Number 6.
16
S-Y Simon Wang et al., “Quantitative attribution of climate effects on Hurricane Harvey’s extreme rainfall in Texas,”
Environmental Research Letters, May 2018, Volume 13, Number 5; Jennifer L. Irish et al., “Simulation of Hurricane Katrina
(2005) under sea level and climate conditions for 1900,” Climatic Change, February 2014, Volume 122, Number 4; Ning
Lin et al., “Hurricane Sandy’s flood frequency increasing from year 1800 to 2100,” Proceedings of the National Academy
of Sciences, October 2016, Volume 113, Number 43
17
Thomas Knutson et al., Tropical cyclones and climate change assessment: Part II. Projected response to anthropogenic
warming, American Meteorological Society, 2019.
12 McKinsey Global InstitutePhysical hazards translate into economic impact
The physical effect of storms and flooding translates into real economic impact. Much of
Florida’s physical and human capital is located along its vulnerable coast. Two-thirds of the
state’s population lives near the coastline, exposing many of them to tidal flooding, and almost
10 percent is less than 1.5 meters above sea level.18 Of Florida’s roughly 7.0 million housing
units, 1.9 million are in the current 100-year floodplain.19 Of the ten costliest US tropical
cyclones since 1900, half hit Florida, causing a total of more than $130 billion in damages.20
The last three major tropical cyclones to hit the state—hurricanes Irma (2017), Wilma (2005),
and Ivan (2004)—generated a cumulative $90 billion in damages within the state, equivalent
to the entire state budget in fiscal year 2019.21
Because capital and people have continued to flow into exposed coastal areas, increasing
exposure to climate hazards has contributed to increasing costs. Between 2010 and 2018,
the population of Miami-Dade county grew by 11 percent and the number of building permits
issued increased by more than 200 percent.22 While Florida is home to about 6.5 percent of
the US population, the state accounted for some 11 percent of US building permits issued
in 2018.
Adaptation is already occurring but needs additional effort
As communities begin to recognize the threat of physical climate change, this is spurring
adaptation efforts across southern Florida. While these measures are expected to help
reduce climate-related damages in the future, they still represent costs today and require
funding. Beach nourishment has been a regular investment along the coast for decades.
Since 1980, some $1.7 billion has been spent on beach nourishment in Florida, nearly three-
quarters of that total from federal sources.23 Zones that have invested in nourishment account
for more than half of the state coastline fronted by single-family homes and have both
higher housing density and larger housing units than other areas.24 Recent infrastructure
investments also include the installation of pump stations to manage frequent flooding and
the construction of desalination plants.25 Construction of a single plant can cost hundreds
of millions of dollars and take years.26 Initiatives to date also include measures to increase
natural flooding defenses. Urban development has reduced natural defenses such as
mangroves and vegetated communities, but such ecosystems can be restored.27 The
largest restoration investment in the United States to date, at a cost of $10.5 billion, is the
Comprehensive Everglades Restoration Plan that aims to “restore, preserve, and protect the
south Florida ecosystem while providing for other water-related needs of the region, including
water supply and flood protection.”28 In 2019, the county and the cities of Miami and Miami
Beach released a strategy for the area, “Resilient305,” that includes measures to bolster
beaches, expand nature-based infrastructure, and identify opportunities to reduce storm
surge risk.29
18
Ben Strauss, Claudia Tebaldi, and Scott Kulp, Florida and the surging sea: A vulnerability assessment with projections
for sea level rise and coastal flood risk, Climate Central, April 2014; National coastal population report: Population trends
from 1970 to 2020, NOAA and US Census Bureau, March 2013.
19
Stephanie Rosoff and Jessica Yager, Housing in the U.S. floodplains, NYU Furman Center, May 2017.
20
NOAA National Hurricane Center. Estimates include insured and uninsured losses.
21
Irma did approximately $50 billion in damage; Wilma and Ivan about $20 billion each. NOAA National Hurricane Center;
News Service of Florida, “Hurricane Michael insured losses near $5.53 billion,” Panama City News-Herald, February
7, 2019; Lawrence Mower, Emily L. Mahoney, Elizabeth Koh, and Samantha J. Gross, “$91.1 billion: Florida lawmakers
consider the budget,” Tampa Bay Times, May 1, 2019.
22
American Community Survey; US Census Bureau; Moody’s Analytics.
23
In 2016 dollars. Scott B. Armstrong et al., “Indications of a positive feedback between coastal development and beach
nourishment,” Earth’s Future, December 2016, Volume 4, Number 12.
24
Ibid.
25
Marcia Wendorf, “The fresh water crisis and desalination plants,” Interesting Engineering, April 2019.
26
Craig Pittman, “Desalination plant, reservoir helping Tampa Bay endure Florida’s fiery drought,” Tampa Bay Times, April
18, 2017. In total, Florida has nearly 40 plants that together can produce approximately 300 million gallons of water
per day, according to the South Florida Water Management District, sfwmd.gov/our-work/alternative-water-supply/
desalination
27
Kathleen Sullivan Sealey, Ray King Burch, and P.-M. Binder, Will Miami Survive? The Dynamic Interplay between Floods
and Finance, Cham, Switzerland: Springer, 2018.
28
National Park Service, Comprehensive Everglades Restoration Plan (CERP), May 8, 2019.
29
Resilient 305, https://resilient305.com/
Climate risk and response | Case study: Florida 13Many of these adaptation efforts are the work of state or federal agencies, and thus funded
by taxpayers. For example, the US Army Corps of Engineers executes resilience projects to
help states adapt to climate change, including $1.7 billion spent on flood risk management
nationally in 2017. 30 In Miami, a new property tax will finance the $400 million Forever Bond
to help repay debt incurred on the municipal bond market. 31 Nearly half of the funds will be
directed toward decreasing flooding risks and managing sea level rise. 32
The effects of a changing climate in Florida could increase over the next
decade and beyond
Climate change is projected to exacerbate flooding due to storm surges, wind speed and
precipitation intensity, and rising sea levels that increase tidal (also referred to as nuisance)
flooding. 33 The frequency of tidal flooding is expected to grow from a few days a year to
30 to 60 times per year in 2030 and more than 200 times per year in 2050 for stations
near Florida’s coast (Florida‑1). 34 The wind speed at Florida’s south coast during a 100-
year hurricane is projected to increase from about 120 knots to about 180 to 240 knots by
midcentury. Precipitation during a 100-year hurricane event is projected to see a similar 50 to
100 percent increase, from about 60 centimeters to 90 to 120. 35
Consider the impact of storm surge, which is expected to increase with sea level rise. Average
annual damages from storm surges in Florida’s residential real estate market total $2 billion
today, a figure that could increase to $3 billion to $4.5 billion, by midcentury depending on
whether the exposure is expected as constant or as seeing some buildup, absent adaptation
and mitigation. 36 However, individual counties can see more extreme increases. Examples are
Volusia, St. Johns, and Broward counties, which could see their average annual losses grow
by approximately 80 percent by 2050. The counties with the highest absolute average annual
damages are Miami-Dade, Lee, and Collier: together their losses account for roughly $1 billion
today (Miami-Dade: ~$0.4 billion, Lee: ~$0.4 billion, Collier: ~$0.3 billion) and a potential
$1.5 billion in 2050 (Miami-Dade: $0.6 billion, Lee: $0.6 billion, Collier: $0.5 billion). 37
30
US Army Corps of Engineers, Fiscal year 2017 United States Army Corps of Engineers annual financial report: A nation’s
strength, a people’s security, 2017.
31
Urban Resilience Project, “Making the ‘Miami Forever Bond’ a model for equitable climate adaptation,” Medium, October
22, 2018.
32
Southeast Florida Regional Compact on Climate Change, “Financing resilience: City of Miami invests $400 million to
build a stronger future,” May 17, 2018.
33
Nuisance flooding is flooding during high tides that leads to public inconveniences (for example, frequent road closures,
overwhelmed storm drains, and compromised infrastructure). NOAA; Thomas Knutson et al., “Tropical cyclones
and climate change assessment: Part II. Projected response to anthropogenic warming,” Bulletin of the American
Meteorological Society, 2019.
34
Based on NOAA minor nuisance flooding thresholds of: Mayport, 1.44 feet mean higher high water (MHHW); Panama City,
1.15 feet MHHW; Virginia Key (Miami), 1.33 feet MHHW. First Street Foundation, 2019.
35
Woods Hole Research Center; Kerry Emanuel, The Coupled Hurricane Intensity Prediction System (CHIPS),
Massachusetts Institute of Technology, 2019.
36
Lower end of range based on analysis by KatRisk, 2019; direct average annual losses to all residential real estate (insured
and uninsured properties). Upper end based on assuming an increase in exposure of real estate based on historical rates
of increase. Analyses based on sea level rise in line with the US Army Corps of Engineers high curve.
37
Figures may not sum to 100 percent because of rounding.
14 McKinsey Global InstituteCase study Florida-1
Tidal flooding in Florida is projected to increase nonlinearly over the next Based on USACE
high scenario
decade and beyond.
Projected frequency of tidal floods at selected stations2
Today
Floods per year
2030
2050 Panama City Mayport Virginia Key (Miami)
Projected sea level rise
in Florida1
Centimeters above 1992 level
50 279
248
184
25
12 60
31 33
15 6 4
1. Based on US Army Corps of Engineers (USACE) high curve at Key West, Florida. High curve results in 1.5 meter eustatic sea level rise by 2100
(within range of RCP 8.5 scenario; see, for example, Jevrejevaet et al., 2014).
2. Based on USACE high curve and NOAA minor nuisance flooding thresholds at Mayport, 1.44 feet mean higher high water (MHHW); Panama City,
1.15 feet MHHW; Virginia Key (Miami), 1.33 feet MHHW.
Note: We define "today" based on sea level rise in 2018. See Technical Appendix of the full report for why this climate scenario was chosen.
Source: First Street Foundation, 2019; Southeast Florida Unified Sea Level Rise Projection
“Tail” events could become even more disruptive
Rising sea levels also increase the damage caused by “tail” events in all counties. Florida’s
real estate losses during storm surge from a 100-year storm surge event are expected to be
$35 billion today and could grow to $50 billion to $75 billion by 2050 (Florida‑2). For Miami-
Dade, the expected damages from such a tail event could be about 10 percent of total market
value, about 30 percent in Lee, and about 20 percent in Collier. To put the likelihood of such
a large loss into context, in the lifetime of a 30-year mortgage, a 100-year storm (that is,
an event with a likelihood of 1 percent) has a 26 percent chance of occurring at least once.
Finally, the level of losses that are observed during today’s 100-year event (that is, an event
of a 1 percent likelihood today) are projected to become more frequent; by 2050, such losses
could happen approximately every 60 years, that is, almost doubling the likelihood of such an
event (Florida‑3).
Climate risk and response | Case study: Florida 15Case study Florida-2
Damage from a 100-year storm surge event in Florida could increase from Based on USACE
high scenario
$35 billion today to $50 billion in 2030 and $75 billion in 2050.
Losses due to damage
$ billion, 2018 dollars
Average annual damage to Damage to residential real
residential real estate from estate from storm surge during
storm surge1 100-year event
4.5 75
1.5 25
3.0 50
0.5 10
2.0 35
Today 20302 20502
3.0 50
2.5 40
Potential additional damage
due to exposure buildup3
Potential damage at
constant exposure4
1. Damage to insured and uninsured properties. Figure represents long-term average loss expected in any one year, calculated by modeling
probability of a climate hazard occurring multiplied by damage should that hazard occur, and summing over events of all probabilities.
2. Sea level rise based on USACE high curve.
3. Estimate based on buildup of residential real estate at equal rate throughout Florida, and for new homes having similar adaptation levels to existing
homes.
4. Historical exposure takes into account data from KatRisk, 2019.
Note: Not to scale. Figures rounded to nearest 0.5 for the average annual damage, and nearest 5 for the 100-year event. We define "today" based on
sea level rise in 2018. See Technical Appendix of the full report for why this climate scenario was chosen.
Source: KatRisk; Moody’s Analytics; US Census Bureau; McKinsey Global Institute analysis
16 McKinsey Global InstituteCase study Florida-3
“Tail” events are projected to cause more damage; losses from an event Based on USACE
high scenario
with 1 percent annual probability in Florida could grow from approximately
$35 billion to approximately $50 billion by 2050.
Potential damage to residential real estate in Florida from Today 2030 2050
storm surge, by event probability1
$ billion, 2018 dollars2
70
Damages that are exceeded during
60 an event with 1% annual probability
could grow from ~$35 billion to
~$50 billion by 2050 ~50
50
40
~35
30
Damages with current annual
exceedance probability of 1% are
20 projected to become more likely;
by 2050 they are expected to have
an exceedance probability of ~2%
10
0
100.0 10.0 1.0 0.1
Annual exceedance probability
% (logarithmic scale)
1. Sea level rise based on USACE high curve. High curve results in 1.5 meter eustatic sea level rise by 2100 (within range of RCP 8.5 scenario; see,
for example, Jevrejeva et al., 2014). Based on current exposure. Buildup of additional residential real estate in areas prone to storm surge could
further increase expected damage.
2. Based on damages if event occurs; damages not adjusted for likelihood of event. Damages based on constant exposure, ie, increase in potential
damages to 2030 or 2050 is due to change in expected hazards.
Note: See the Technical Appendix of the full report for why this climate scenario was chosen. We define "today" based on sea level rise in 2018.
Source: Analysis conducted by KatRisk
Climate risk and response | Case study: Florida 17The knock-on effects of climate change on the Florida economy could be
even more significant
While the Florida residential real estate market remains robust today, climate risk poses a
potential threat to asset prices. It is difficult to know the timing and magnitude of impacts;
indeed, they are influenced by myriad factors such as how quickly home owners recognize
current and future risk, the availability and price of insurance, the willingness of lenders
to lend, occupancy rates of rented accommodation or second homes, household debt
levels, employment levels, the timing of major disasters, the attractiveness of communities
and school districts, and adaptation measures taken to protect homes and communities
and the cost of those measures. All of these play a role in influencing home prices and
housing demand. A climate-related devaluation of property prices in Florida would cascade
throughout the state economy, affecting government tax revenue, GDP, commercial
development, and population growth.
Signs indicate that climate risk may already be beginning to affect home prices. Researchers
have found evidence in Florida, as well as more broadly in the United States, that prices
of properties at risk of tidal flooding and exposure to sea level rise are lower, and are
appreciating at a slower pace compared with similar unexposed properties, indicating that
buyers are beginning to recognize climate risk. 38 For example, Bernstein et al. (2018) find
that nationally, houses exposed to sea level rise are valued at a 7 percent discount compared
with similar unexposed properties. 39 And risk may still be under-recognized. For example, the
researchers find that only “sophisticated” owners (the term used by the authors to describe
non-owner-occupied properties) are factoring climate risk into their prices, and even for
those owners, price discounts that they apply to exposed properties have been increasing
over time. 40
As buyers experience flooding, prices of affected homes may also adjust
Single severe acute events such as a Category 4 or 5 hurricane may alter home buyers’
expectations. Homes damaged by Hurricane Sandy in 2012 in New York experienced an
initial 17 to 22 percent drop in value, and while they recovered somewhat, as of 2017 they
remained at about an 8 percent discount relative to similar properties elsewhere in the
city— and surprisingly, this was close to the impact on prices of homes that were not directly
damaged by the storm, but in flood zones. 41 The First Street Foundation estimates that, to
date, properties that are exposed to flooding have on average seen a 3 percent price discount
compared with similar unexposed properties. Properties exposed to disruptive flooding—
where more than 25 percent of a property lot or nearby roads are flooded—on average have
lost 11 percent of their value compared with similar unexposed properties. 42 This has already
resulted in a total devaluation today of $5 billion of affected residential properties in Florida. 43
Tidal flooding with frequency more than 50 times a year is projected to affect properties
worth $50 billion by 2050
Going forward, more homes will be exposed to tidal flooding, and those exposed to disruptive
flooding are also expected to increase. About 25,000 homes in Florida already experience
flooding at frequencies of more than 50 times per year (almost once a week on average). With
38
See, for example, Jesse M. Keenan, Thomas Hill, and Anurag Gumber, “Climate gentrification: From theory to empiricism
in Miami-Dade County, Florida,” Environmental Research Letters, May 2018, Volume 13, Number 5; Steven A. McAlpine
and Jeremy R. Porter, “Estimating recent local impacts of sea level rise on current real-estate losses: A housing market
case study in Miami-Dade, Florida,” Population Research and Policy Review, December 2018, Volume 37, Number 6;
and Asaf Bernstein, Matthew T. Gustafson, and Ryan Lewis, “Disaster on the horizon: The price effect of sea level rise,”
Journal of Financial Economics, November 2019, Volume 134, Number 2.
39
Asaf Bernstein, Matthew T. Gustafson, and Ryan Lewis, “Disaster on the horizon: The price effect of sea level rise,”
Journal of Financial Economics, November 2019, Volume 134, Number 2.
40
For example, across the United States, buyers who are climate aware have been found to discount home values an
average of six additional percentage points relative to those who are less aware. Asaf Bernstein, Matthew T. Gustafson,
and Ryan Lewis, “Disaster on the horizon: The price effect of sea level rise,” Journal of Financial Economics, November
2019, Volume 134, Number 2.
41
Francesc Ortega and Süleyman Taspinar, “Rising sea levels and sinking property values: The effects of Hurricane Sandy
on New York’s housing market,” Journal of Urban Economics, July 2018, Volume 106.
42
Analysis by First Street Foundation, 2019.
43
Analysis by First Street Foundation, 2019; McKinsey Global Institute analysis.
18 McKinsey Global Instituterising sea levels, 40,000 coastal properties representing about $15 billion of value could run
this risk by 2030, and 100,000 properties worth $50 billion in 2050. This value represents
4 percent of Florida’s $1.3 trillion residential real estate market. 44 These properties may see
resale prices drop significantly due to severe and frequent flooding, even falling to zero if
there are no prospective buyers. 45
Putting this together, we estimate that the projected increase in tidal flooding frequency
and severity could result in a $10 billion to $30 billion devaluation by 2030, and $30 billion
to $80 billion by 2050, all else being equal (Florida‑4). 46 Today, First Street estimates that
roughly 375,000 homes have seen devaluation impacts, and by 2050, that figure could be
about 550,000. By 2050, the average devaluation of affected homes is expected to increase
to 15 to 35 percent, all else being equal. These estimates are conservative for two reasons.
First, our analysis largely assumes that the relationship between the magnitude of flooding
and home price devaluation remains constant in the future. With the severity and frequency
of flooding damage increasing, that relationship could change, for example as home owners
become increasingly less tolerant to frequent flooding. 47 Second, as flooding worsens,
home owners could also expect that the future will look worse than the past. Expectations
of worsening impacts could further decrease current home prices. The magnitude of such
devaluations would depend on the pace with which climate hazards intensify and on how
home buyers factor worsening hazard into their decisions (see Box 2, “How climate hazards
impact demand for homes”).
Real estate buyers may price in expectations of future hazards and other factors
Home prices may be influenced not just by today’s level of hazard, but also by expectations
of how hazards could evolve. The resale potential, maintenance costs, and comfort and
convenience of a home in the future are all factors buyers consider. Once buyers become
aware of and price in expectations of future hazards, home prices may adjust in advance of
significant climate-induced property destruction or flooding-related inconvenience. For
example, homes adjacent to properties that are frequently affected by tidal flooding or storm
surges could see prices drop as prospective buyers grow concerned. Increased incidence of
toxic algae blooms in coastal waters and of seaweed piles on beaches may further reduce the
attractiveness of coastal properties. 48 Individual tolerances to withstand frequent flooding
and damages could also shift. If public infrastructure assets are affected, for example from
frequent flooding, that could reduce the desirability of entire communities.
44
First Street Foundation, 2019. Properties are at flooding risk if 3 percent of the lot is below daily maximum tide height;
home values are based on the value of the home used for tax purposes, not on market value.
45
The Union of Concerned Scientists finds a similar result: that in 2030, roughly 21,000 homes will be at risk of flooding
more than 26 times per year, and before midcentury, the number could rise to approximately 64,000. The difference
in magnitude is driven by different thresholds defining whether a property is flooded; “New study finds 1 million Florida
homes worth $351 billion will be at risk from tidal flooding,” Union of Concerned Scientists, June 18, 2018; under
2014 National Climate Assessment high SLR scenario (2.0 m above 1992 by 2100).
46
This analysis was conducted by the First Street Foundation specifically for this MGI report. In summary, the First Street
Foundation model is a property-level analysis of the relationship between real estate trends and the local experience
of tidal flooding events. The tidal model is a high-precision model created from observed tide gauge readings, digital
elevation models, and sea level rise adjustments, whereas the real estate transactions are all drawn from publicly
available local sources that have been compiled and standardized. The analysis identifies differential appreciation
rates for properties that experience tidal flooding in comparison to those that do not, with the former seeing a slower
rate of appreciation over the study period (2005–17). For further details on the First Street methodology, see Steven
A. McAlpine and Jeremy R. Porter, “Estimating recent local impacts of sea level rise on current real-estate losses: A
housing market case study in Miami-Dade, Florida,” Population Research and Policy Review, December 2018, Volume 37,
Number 6, and firststreet.org/research/methodology. Note that these numbers quantify a loss of appreciation among
properties affected by tidal flooding; they do not necessarily indicate an absolute decrease in value, but rather a
difference in value between affected and unaffected homes. For example, changes in supply and demand may be much
more important to explain the absolute change in price, but there will still be a deviation between the price evolution of
homes that are exposed to flooding versus those that are not.
47
Furthermore, parts of Florida could experience higher or lower degrees of impact based on their specific socioeconomic
conditions. For example, urban areas with robust local economies may find themselves more resilient to price impacts,
because those areas continue to be attractive to prospective buyers and potentially can more easily finance adaptation
spending.
48
Mengqiu Wang et al., “The great Atlantic Sargassum belt,” Science, July 2019, Volume 365, Number 6448.
Climate risk and response | Case study: Florida 19Case study Florida-4
Tidal flooding has caused an estimated $5 billion devaluation in real estate, which could
grow to $30 billion to $80 billion by 2050.
Projected devaluation of Florida real estate market due to tidal flooding1
$ billion, 2018 dollars
Projected devaluation of homes based on trend Today 2030 2050
observed today -10
-5 -30
Potential additional devaluation if homes -20
flooding >50x per year become entirely undesirable
-30
for future buyers
-50
-80
Average devaluation compared to unexposed homes ~5 5–15 15–35
%
Number of impacted homes 470 550
Thousand
Level of devaluation by county by 2050 Homes exposed to tidal flooding >50x per year
Quintile (by total value, $) by 2050
Share of total number of homes in each county, %
St. Johns
Franklin Dixie
Citrus
Pinellas
Manatee
Palm
Lee Beach
No observed impact Broward
Lowest (5th quintile) Miami-Dade 0
Low (4th quintile) Monroe 0–1 Monroe
Moderate (3rd quintile) 2–4
High (2nd quintile) 5–10
Highest (1st quintile) >10
Counties with highest Counties with highest number of
devaluation impact homes exposed to tidal flooding
1. Based on First Street Foundation’s property-level analysis of relationship between real estate trends and local experience of tidal flooding events.
Analysis identifies differential appreciation rates for properties that experience tidal flooding in comparison to those that do not, with the former
seeing a slower rate of appreciation over study period (2005–17). Analysis relies on assumption that future relationship between flooding impact
and home value devaluation equals historical relationship. Low end of rage based on historical devaluation; high end assumes homes flooded >50x
per year see 100% devaluation.
Note: See the Technical Appendix for why we chose RCP 8.5. All projections based on RCP 8.5, CMIP 5 multimodel ensemble. Following standard
practice, we define current and future (2030, 2050) states as average climatic behavior over multidecade periods. Climate state today is defined
as average conditions between 1998 and 2017, in 2030 as average between 2021 and 2040, and in 2050 as average between 2041 and 2060.
$ figures rounded to nearest 5, % figures rounded to nearest 5%.
Source: First Street Foundation 2019; McKinsey Global Institute analysis
20 McKinsey Global InstituteBox 2.
How climate hazards impact demand for homes
Notably, in some locations in the United States, acute as well as chronic climate events
have already driven managed retreat. For example, Isle de Jean Charles, Louisiana, has
lost 98 percent of its area to erosion, sinking land, rising seas, and hurricane damage,
creating the need for inland resettlement. In some communities (such as the village
of Mastic Beach in New York), this type of migration has already been observed and
encouraged through buyout programs in neighborhoods that experienced repetitive or
severe repetitive losses.1 However, most large-scale retreat to date has typically been
driven by major acute events, and this may remain a challenge, particularly as climate
change makes destructive hurricanes more likely. In New Orleans, Hurricane Katrina
in 2005 destroyed or rendered uninhabitable an estimated 300,000 homes.2 After
80 percent of the city flooded, the population halved, and even ten years later it had
not returned to its original levels. 3 After the storm, non-local mortgage lenders largely
exited the market. 4 The situation in New Orleans also illustrated that catastrophic
weather events do not affect all neighborhoods equally. For example, while ten years
later the populations of most neighborhoods had returned to their original level, that
was not the case for the most geographically and socially vulnerable neighborhoods, to
which in some cases less than half of the population had returned.5
1
Robert Freudenberg et al., Buy-in for buyouts: The case for managed retreat from flood zones, Lincoln Institute
of Land Policy, 2016.
2
US Executive Office of the President, The federal response to Hurricane Katrina: Lessons learned, February
2006.
3
Ibid.; the population in 2015 was approximately 15 percent lower than before the hurricane, according to the US
Census Bureau.
4
Justin Gallagher and Daniel Hartley, “Household finance after a natural disaster: The case of Hurricane Katrina,”
August 2017, American Economic Journal: Economic Policy, Volume 9, Number 3.
5
W. A. Lascell and P. R. Baumann, “Lower 9th Ward, New Orleans: Recovery and rebuilding,” Middle States
Geographer, 2015, Volume 48.
Impacts are not evenly distributed over Florida
The numbers above represent averages across the state of Florida, but the impact on specific
communities and counties could be much more extreme. In many communities, affected
homes could be concentrated in the same neighborhoods, where devaluation can have a large
local impact. We identify three counties, Dixie, Monroe, and Franklin, where by 2030 more
than 10 percent of homes are projected to flood 50 times or more per year, and eight others
where 5 percent or more homes see such an impact.
Insurance premiums and availability for homes in high-risk areas may change
Real estate prices reflect expectations of the future and often extend beyond a single decade;
mortgages are typically set on 15- or 30-year time horizons. Conversely, insurance premiums
are repriced annually. At the national level, the largest provider of residential flood insurance
(which is typically excluded from home owners’ insurance) is the federal government. Since
1968, the Federal Emergency Management Agency (FEMA) has provided flood insurance to
residents through the National Flood Insurance Program (NFIP). If premiums grow accordingly
with the potential average annual loss (about 50 percent by 2050), the average annual
premium could increase by about 50 percent from $800 to $1,200, with high-risk properties
seeing a much higher jump. 49 Such a hike could further affect future property values. If
home buyers factor increased premium contributions into a home’s current value, this could
cause a decline of about $3,000 in the average value of a home, or a statewide devaluation
of about $5 billion. 50 Home owners in hazard high-risk areas may see much larger impacts
49
Willis Tower Watson, 2019 for current premiums.
50
Based on the 1.7 million policies in force in Florida today; FEMA.
Climate risk and response | Case study: Florida 21You can also read