Wolfberry (Lycium barbarum) Consumption with a Healthy Dietary Pattern Lowers Oxidative Stress in Middle-Aged and Older Adults: A Randomized ...
←
→
Page content transcription
If your browser does not render page correctly, please read the page content below
antioxidants

Article
Wolfberry (Lycium barbarum) Consumption with a Healthy
Dietary Pattern Lowers Oxidative Stress in Middle-Aged and
Older Adults: A Randomized Controlled Trial
Darel Wee Kiat Toh , Wan Yee Lee, Hanzhang Zhou, Clarinda Nataria Sutanto                                     , Delia Pei Shan Lee         ,
Denise Tan and Jung Eun Kim *

                                           Department of Food Science & Technology, Faculty of Science, National University of Singapore,
                                           2 Science Drive 2, Singapore 117543, Singapore; dareltoh@u.nus.edu (D.W.K.T.); lee.wan.yee@u.nus.edu (W.Y.L.);
                                           hanzhang_zhou@u.nus.edu (H.Z.); e0254848@u.nus.edu (C.N.S.); lee.delia@u.nus.edu (D.P.S.L.);
                                           denise_tan@u.nus.edu (D.T.)
                                           * Correspondence: fstkje@nus.edu.sg; Tel.: +65-6516-1136; Fax: +65-6775-7895

                                           Abstract: Incorporating zeaxanthin-rich wolfberry (Lycium barbarum) into a healthy dietary pattern
                                           may augment its antioxidant potential. The present 16-week, parallel design randomized controlled
                                           trial aimed to investigate the impact of adhering to a healthy dietary pattern, either with or without
                                           whole dried wolfberry (15 g/d) on oxidative stress status (plasma malondialdehyde and 8-iso-
                                           prostaglandin F2α) in middle-aged and older adults. Changes to carotenoids status (plasma and
                                 skin carotenoids) and body composition were further evaluated to explore potential mechanisms

                                           which underlie the antioxidant properties of wolfberry. Plasma 8-iso-prostaglandin F2α, plasma
Citation: Toh, D.W.K.; Lee, W.Y.;          zeaxanthin and skin carotenoids status were significantly raised in the wolfberry consuming group
Zhou, H.; Sutanto, C.N.; Lee, D.P.S.;      (n = 22; p < 0.05) compared to the control group which showed no changes (n = 18). Likewise in
Tan, D.; Kim, J.E. Wolfberry (Lycium       the wolfberry group only, inverse association was observed between the change values of plasma
barbarum) Consumption with a               zeaxanthin and plasma 8-iso-prostaglandin F2α (−0.21 (−0.43, 0.00) ng/µmol, regression coefficient
Healthy Dietary Pattern Lowers
                                           (95% CI); p = 0.05). Wolfberry consumption with a healthy dietary pattern may serve as a dietary
Oxidative Stress in Middle-Aged and
                                           strategy to attenuate lipid peroxidation among middle-aged and older adults who are at a heightened
Older Adults: A Randomized
                                           risk of oxidative stress induced age-related disorders. The antioxidant properties of wolfberry may
Controlled Trial. Antioxidants 2021, 10,
                                           be attributed to its rich zeaxanthin content.
567. https://doi.org/10.3390/
antiox10040567
                                           Keywords: antioxidant; body composition; Lycium barbarum; middle-aged; oxidative stress; plasma
Academic Editor: Aki Hirayama              carotenoids; randomized controlled trial; skin carotenoids

Received: 11 March 2021
Accepted: 5 April 2021
Published: 7 April 2021                    1. Introduction
                                                Declines in the endogenous antioxidant network are regarded as one of the few antag-
Publisher’s Note: MDPI stays neutral       onistic hallmarks of aging [1]. This can be induced by mitochondrial perturbations which
with regard to jurisdictional claims in    alter its functionality and makes the middle-aged and older population more vulnerable
published maps and institutional affil-    to oxidative stress [2]. Disruptions to the dynamic redox regulation results in oxidative
iations.                                   damage and phenotypic changes which predisposes many age-related disorders such as
                                           cardiovascular disease, chronic obstructive pulmonary disease and dementia [3].
                                                Under these circumstances, dietary antioxidants are especially important to support
                                           the maintenance of redox homeostasis. This may be attained through an adherence to
Copyright: © 2021 by the authors.          healthy dietary patterns (HDPs), often characterized by a balanced consumption of fruits,
Licensee MDPI, Basel, Switzerland.         vegetables, wholegrains and meats or alternative protein sources which contributes to a
This article is an open access article     variety of exogenous antioxidants [4,5]. As supported by cross-sectional studies, inverse
distributed under the terms and            associations were reported between HDP compliance with plasma and urinary malondi-
conditions of the Creative Commons         aldehyde (MDA) concentrations [6,7]. In addition, a meta-analysis evaluating randomized
Attribution (CC BY) license (https://
                                           controlled trials (RCTs) deduced significant improvements in several oxidative stress pa-
creativecommons.org/licenses/by/
                                           rameters including blood MDA and glutathione after adherence to the Dietary Approaches
4.0/).

Antioxidants 2021, 10, 567. https://doi.org/10.3390/antiox10040567                                       https://www.mdpi.com/journal/antioxidants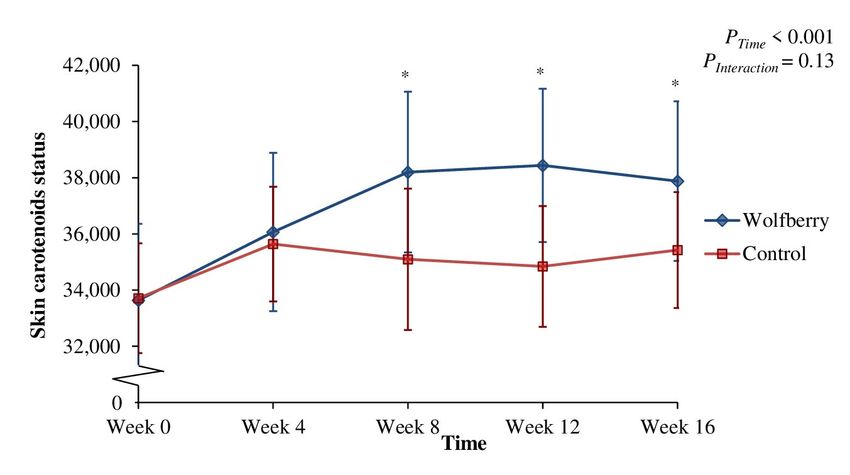
Antioxidants 2021, 10, 567                                                                                            2 of 19

                             to Stop Hypertension HDP, compared to the control [8]. On the contrary, while the intake
                             of dietary antioxidants such as vitamin E and carotenoids display inverse associations
                             with oxidative stress [9,10], inconsistent results were observed from clinical trials which
                             intervened with antioxidant-rich foods or antioxidant supplementations [1,8,11,12]. This
                             may be attributed to reasons such as functional concentration limits, poor bioavailability
                             and the lack of antioxidant synergy in single antioxidant clinical trials [8,11–13]. Therefore,
                             the incorporation of antioxidant-rich foods to a HDP may serve as a dietary strategy to
                             augment its antioxidant potential [14].
                                  Fruits of Lycium barbarum (wolfberry or goji berry), is one such example with ex-
                             emplary antioxidant potential. Traditionally consumed in Asia for its medicinal and
                             therapeutic properties [15], wolfberry has now become increasingly commercialized across
                             the globe and incorporated as an ingredient into various culinary preparations [16]. Its
                             benefits are thought to stem from bioactive compounds including carotenoids, polyphenols,
                             vitamin C precursors and its L. barbarum polysaccharide (LBP) fraction [17].
                                  In vitro and animal models which investigated the effects of wolfberry-based supple-
                             mentations or extracts demonstrated its ability to not only scavenge reactive oxygen species
                             (ROS) directly, but also, upregulate the expression and activity of endogenous antioxidant
                             enzymes [18–21]. This largely aligns with previous RCTs. According to Amagase et al. [22],
                             which intervened with wolfberry fruit juice (120 mL) for 30 days and Ma et al. [23] which
                             administered LBP capsules (0.72 mg LBP) for 6 weeks, reductions in MDA concentration,
                             coupled with a raised production of antioxidant enzymes such as superoxide dismutase
                             and glutathione peroxidase in blood were reported in healthy subjects.
                                  Despite the emerging evidence which suggests the antioxidant benefits of wolfberry,
                             limited studies explored its effects as whole dried fruits or considered possible synergism
                             with a HDP. This is especially so amongst middle-aged and older adults who are more
                             susceptible to oxidative stress. Therefore, the objective of the present RCT is to investigate
                             the impact of dietary counselling (to adhere to a HDP), either with or without the incorpo-
                             ration of whole dried wolfberry on oxidant burden (plasma MDA and 8-iso-prostaglandin
                             F2α (8-isoPGF2α)) in a middle-aged and older Singaporean population. Changes to the
                             participants’ carotenoids status (plasma carotenoids and skin carotenoids status (SCS)) and
                             body composition were further explored to define the mechanisms which underlie the
                             potential antioxidant effects of wolfberry.

                             2. Materials and Methods
                             2.1. Study Design and Participants
                                   The present study was a parallel design, 16-week RCT with 2 intervention arms and
                             5 study visits in total to the National University of Singapore and National University
                             Hospital. It was conducted between July 2018 and October 2019, in Singapore. The
                             protocol was approved by the National Healthcare Group Domain Specific Review Board
                             and was registered at clinicaltrials.gov as NCT03535844. Written informed consent was
                             obtained from prospective participants (n = 88), who were screened based on a set of
                             criteria established a priori.
                                   The screening encompassed an interview and structured questionnaires designed to
                             obtain details on the participants’ sociodemographic and lifestyle characteristics, medical
                             history as well as their habitual dietary patterns. To be eligible, participants should be
                             aged ≥50 and ≤75 years, and have sufficient venous access for blood draw. Exclusion
                             criteria included those who were smokers; prescribed long-term medications (e.g., anti-
                             hypertensives, glucose or lipid lowering drugs) five years prior; taking dietary supplements
                             or traditional Chinese medicine one month prior; experiencing ±5% body weight changes
                             three months prior; consuming >3 and >2 alcoholic beverages/week for males and females
                             respectively; exercising vigorously (defined as having >6 metabolic equivalents daily [24]);
                             pregnant or lactating; exposed to radiation
equivalents daily [24]); pregnant or lactating; exposed to radiation
Antioxidants 2021, 10, 567                                                                                         4 of 19

                             vegetables include potatoes, tapioca, yam etc.), and three servings of non-processed meats
                             and alternative proteins. Details of the dietary pattern are more extensively elaborated
                             in a fact sheet by the Singapore Health Promotion Board [25]. Specific to the wolfberry
                             group, instructions were given to cook (by steaming or steeping in hot water) and consume
                             15 g of whole dried wolfberry (Ning Xia, China; purchased from Eu Yan Sang Pte. Ltd.,
                             Singapore) with their main meals. This included the consumption of both the whole fruit
                             and residual liquid concoction daily, throughout the 16-week study duration. Double-blind
                             was challenging in the present context due to the nature of the intervention. However,
                             main study investigators involved in outcome assessment, data curation as well as formal
                             and statistical analyses were blinded to the treatments.
                                    Compliance to the dietary intervention was determined for each participant using 3-
                             day food records and single day photographic records every 4 weeks. Recording procedures
                             (i.e., attention to product detail, quantity consumed and mode of preparation etc.) were
                             carefully instructed by research nutritionists who reviewed the submitted 3-day food
                             records in detail each visit to improve dietary data accuracy and precision. Shortcomings to
                             the MHP during each visit were also identified for tailored dietary counselling to optimize
                             MHP conformity. The food records were analyzed using DietPlan 7 (Forestfield Software
                             Ltd., Horsham, West Sussex, UK) with the US Department of Agriculture (USDA) National
                             Nutrient Database for Standard Reference, Release 27, as the primary database [26]. This
                             was complemented and cross-referenced with secondary data sources which comprised of
                             the Singapore Health Promotion Board nutrient composition database for local cuisines [27]
                             and nutritional information panels for commercial food products.

                             2.3. Outcome Variable Measurements
                                  After an overnight fast (>10 h), venous blood was collected into EDTA-coated va-
                             cutainer tubes (Becton Dickinson, Franklin Lakes, NJ, USA) for centrifugation (3000× g
                             for 15 min at 4 ◦ C). The plasma supernatant was stored as aliquots (500 µL) at −80 ◦ C
                             until analysis.
                                  Plasma samples were used to evaluate the oxidant burden which served as the
                             present study’s primary outcome. Secondary outcomes included the participant’s plasma
                             carotenoids concentration and SCS, as well as their corresponding dietary carotenoids
                             intake, body composition and anthropometric measurements.

                             2.3.1. Biomarkers of Oxidative Stress
                                   Indexes of lipid peroxidation, plasma MDA and 8-isoPGF2α, were selected as biomark-
                             ers of oxidative stress. MDA was analyzed using a Parameter assay kit (R&D Systems,
                             Minneapolis, MN, USA) by reaction between acid-treated plasma with thiobarbituric acid.
                             After incubation (50 ◦ C, 3 h), optical densities were assayed spectrophotometrically with a
                             plate reader at 532 nm (BioTek Instruments, Inc., Winnoski, VT, USA).
                                   Plasma samples were prepared in accordance to the manufacturer’s instructions
                             for 8-isoPGF2α analysis using enzyme-linked immunosorbent assay (ELISA; ABCAM,
                             Cambridge, UK). In brief, acidified plasma samples (glacial acetic acid to pH 4.0) were
                             first vortexed with ethyl acetate and centrifuged (250× g for 10 min at 22 ◦ C). The organic
                             layer was pooled thrice to isolate 8-isoPGF2α before it was vacuum dried (SpeedVac® ,
                             Thermo Fisher Scientific, Waltham, MA, USA) and re-dissolved in ethanol and a sample
                             dilution buffer for ELISA. Solvents used were analytical grade and obtained from VWR
                             International (Radnor, PA, USA).

                             2.3.2. Plasma and Skin Carotenoids Status
                                  Plasma carotenoids were extracted and analyzed as previously described [28]. In brief,
                             plasma aliquots were deproteinated and extracted with methanol, acetone and petroleum
                             ether before reconstitution in methanol:methyl tert-butyl ether (MTBE) (1:1, vol:vol). Sam-
                             ples were analyzed using high performance liquid chromatography (HPLC) equipped with
                             a C30 column (YMC, Kyoto, Japan) and photodiode array detector (Waters Alliance e2695
Antioxidants 2021, 10, 567 5 of 19
Separation Module; Waters, Milford, MA, USA) to resolve and quantify β-carotene, α-
carotene, β-cryptoxanthin, lutein, zeaxanthin and lycopene. With the exception of lycopene
(470 nm), the remaining carotenoids were detected at 450 nm. Chemicals for extraction
and HPLC analysis were HPLC grade and pure carotenoids standards were analytical
grade (≥95% purity). Acetone, methanol and petroleum ether were obtained from VWR
International (Radnor, PA, USA) while MTBE and individual carotenoid standards were
obtained from Sigma-Aldrich (St. Louis, MO, USA). A representative chromatogram is
depicted in Figure A1 in the Appendix A.
SCS was measured using a Pharmanex BioPhotonic Scanner S3 (Nu Skin Enterprises,
Provo, UT, USA) by resonance Raman spectroscopy, in duplicate. Each palm scan yielded
a score from 10,000 to 89,000, which was directly correlated to the carotenoids content in
the skin.
2.3.3. Anthropometrics and Body Composition
Height and weight were measured using a stadiometer and digital scale (Seca, Ham-
burg, Germany) with the body mass index (BMI) calculated. Measurements of waist
circumference were performed using a flexible tape measure at standing position after
several consecutive natural breaths. This was in accordance to WHO standards, along
the mid axillary line, between the top of the iliac crest and last rib [6]. Anthropometric
measurements were conducted in duplicate.
Body composition analysis with whole body dual energy x-ray absorptiometry (DXA)
scans was acquired with Hologic Discovery Wi, fan beam x-ray bone densitometer (Hologic
Inc., Marlborough, MA, USA) in accordance to the protocol described by the National
Health and Nutrition Examination Survey (NHANES) [29]. The scan results were analyzed
to yield measures of the fat mass and lean mass and their distributions in the truncal and
appendicular regions.
2.4. Power Calculation and Statistical Analysis
Power calculations (G*Power 3.1, Heinrich-Heine-Universität, Düsseldorf, Germany [30])
were conducted a priori based on a previous RCT which administered 14 g wolfberry/d and
reported significant reductions in plasma thiobarbituric acid reactive substances (TBARS;
wolfberry intervention group: −3 ± 1 µmol/mg of protein; control group +3 ± 1 µmol/mg
of protein) after 45 days [12]. At a power of 90% and significance level of 0.05 (two-tailed),
16 subjects per group would be required to confirm a statistical difference, presuming the
present study yields a similar response as previously.
Statistically, between-group differences at week 0 were first evaluated with indepen-
dent t-tests and Fisher’s exact test for continuous and categorical variables respectively.
Changes in all outcome variables (i.e., biomarkers of oxidative stress, carotenoids status,
anthropometrics and body composition) across various time points were analyzed with
two-way mixed model ANOVA. A post-hoc simple effects test by multiple contrasts of Bon-
ferroni was used to further examine changes from week 0 within each group. For outcome
variables which were significantly different between groups at week 0, the aforementioned
statistical analysis was repeated with normalized values, expressed as a percentage change
from week 0. This was coupled with an analysis of covariance (ANCOVA) between week 16
outcomes values, adjusted for the corresponding week 0 values for a more robust statistical
evaluation [31]. A similar ANCOVA model was likewise used to compare dietary data
between groups at weeks 8 and 16.
To examine the relationships between the change values of plasma carotenoids, SCS
and body composition indicators with the corresponding changes in the biomarkers of
oxidative stress, simple linear regression (SLR) and multiple linear regression (MLR; con-
trolled for age, sex and BMI) were used. Variables which influenced plasma carotenoids
and SCS, independent of dietary carotenoids, were selected as covariates for the MLR
model. This was defined based on an earlier cross-sectional study by the same researchAntioxidants 2021, 10, 567 6 of 19
group [28]. The regression analyses were performed by intervention group, as well as for
combined datasets.
Statistical tests were conducted on STATA/MP 13 (StataCorp LP, College station, TX,
USA) with a statistical significance of 0.05, two-tailed. All data are presented either as
mean (SD) or β-coefficient (95% confidence intervals (CI)) unless otherwise stated.
3. Results
3.1. Participant Characteristics
The present RCT recruited both middle-aged and older (range: 50 to 64 years) males
(wolfberry: n = 4, control: n = 7) and females (wolfberry: n = 18, control: n = 11). At week
0, demographic characteristics (age and sex) as well as the biomarkers of oxidative stress,
anthropometrics and body composition indicators were similar between the wolfberry
and control groups (p > 0.05). This is with the exception of plasma total carotenoids,
specifically plasma lycopene, which was significantly higher in the control group (total
carotenoids: 2.75 (0.95) µmol/L; lycopene: 0.58 (0.45) µmol/L) than the wolfberry group
(total carotenoids: 2.02 (0.90) µmol/L; lycopene: 0.33 (0.22) µmol/L) (Table A1 in the
Appendix A).
3.2. Dietary Assessment and Compliance
At week 0, an assessment of individual food groups indicated no differences apart from
wholegrain intake which was significantly higher in the control group than the wolfberry
group (wolfberry: 0.3 (0.4) servings/d; control: 1.0 (0.8) servings/d, p = 0.001) (Table A2
in the Appendix A). Nonetheless, at weeks 8 and 16, a similar extent of compliance was
attained for wholegrains, vegetables, meats and alternatives (p > 0.05). While a marked
discrepancy in fruits intake was observed at week 16 (wolfberry: 3.4 (1.4) servings/d;
control: 2.4 (1.2) servings/d, p = 0.028), this was null following the exclusion of wolfberry
which contributed to an additional 0.5 servings/d (p = 0.24 with wolfberry exclusion).
Good compliance to the MHP was observed for fruits, vegetables, meats and alterna-
tives intake which largely met the 2, 2 and 3 servings/d recommendations respectively
across both groups (Table A2). This is with the exception of wholegrains which increased
but fell short of the 4 servings/d recommendations (wolfberry: 2.2 (2.3) servings/d; control:
1.8 (1.0) servings/d). For the dietary carotenoids, lycopene intake was markedly higher
in the wolfberry group (wolfberry: 0.27 (0.21) mg/d; control: 0.41 (0.27) mg/d, p = 0.011)
at week 16 only. The remaining dietary carotenoids, however, depicted no differences
between groups at weeks 0, 8 and 16 (p > 0.05). There were no adverse effects observed in
either group after intervention.
3.3. Oxidative Stress and Carotenoids Status
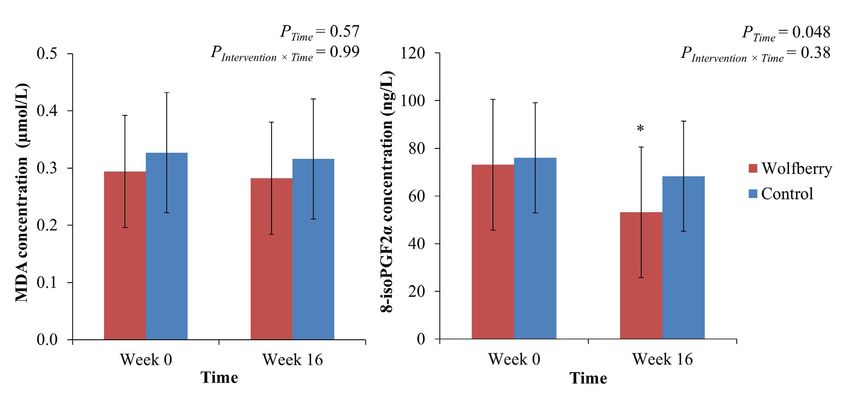
Changes to the biomarkers of oxidant burden, plasma MDA and 8-isoPGF2α are
presented in Figure 2. While, MDA depicted no changes (wolfberry: 0.29 (0.10) to 0.28
(0.10) µmol/L; control: 0.33 (0.16) to 0.32 (0.11) µmol/L), a significant time effect (p = 0.048)
was observed for 8-isoPGF2α (wolfberry: 73.1 (49.1) to 53.2 (27.4) ng/L; control: 76.0 (24.8)
to 68.3 (23.1) ng/L). This was primarily driven by the wolfberry group which depicted a
marked decline after intervention, at week 16. ‘
Significant time (p = 0.041) and interaction (intervention × time) effects (p = 0.008)
were observed for plasma total carotenoids (Table 1), largely attributed to the prominent
rise in the wolfberry group at week 8 (+51.1 (112.1) % from week 0). This corresponds to
the significant interaction effects observed for plasma β-carotene (p = 0.029), α-carotene
(p = 0.034) and zeaxanthin (p < 0.001) which were likewise raised in the wolfberry group at
week 8.Antioxidants 2021, 10, x FOR PEER REVIEW 7 of 21
Antioxidants 2021, 10, 567 7 of 19
Figure
Figure 2.2. Concentrations
Concentrations of
of plasma
plasma oxidative
oxidative stress
stress biomarkers
biomarkers MDA
MDA andand 8-isoPGF2α
8-isoPGF2α for for wolfberry
wolfberry group
group (n (n == 22)
22) and
and
control group (n = 18) of randomized controlled trial. Values are means with error bars representing the SD. Data
control group (n = 18) of randomized controlled trial. Values are means with error bars representing the SD. Data analyzed with analyzed
with two-way
two-way mixedmixed
modelmodel
ANOVA ANOVA and post-hoc
and post-hoc simpletest
simple effects effects test by Bonferroni’s
by Bonferroni’s multiple*contrasts.
multiple contrasts. * p < 0.05tocompared
p < 0.05 compared the corre-
sponding
to week 0 values.week
the corresponding At week 0, there were
0 values. no significant
At week 0, theredifferences in plasma MDA
were no significant (p = 0.42) in
differences andplasma
8-isoPGF2α
MDA (p =(p0.82). Abbrevi-
= 0.42) and
ations: MDA, malondialdehyde; 8-isoPGF2α, 8-iso-prostaglandin F2α.
8-isoPGF2α (p = 0.82). Abbreviations: MDA, malondialdehyde; 8-isoPGF2α, 8-iso-prostaglandin F2α.
Significant time (p = 0.041) and interaction (intervention × time) effects (p = 0.008)
Table 1. Changes in plasma carotenoids status at weeks 8 and 16 of randomized controlled trial 1 .
were observed for plasma total carotenoids (Table 1), largely attributed to the prominent
rise in the wolfberry group
Wolfberry at week 8Control
Group (+51.1 (112.1)
Group % from week 0). This p corresponds to
Study
the Visit
significant (n = 22)
interaction effects observed (nfor
= 18)
plasma β-carotene (p = 0.029), α-carotene (p
Mean (SD) Mean (SD) Time 2 Intervention × Time 2
= 0.034) and zeaxanthin (p < 0.001) which were likewise raised in the wolfberry group at
Plasma total carotenoids (%) Week 8
week 8. 51.1 (112.1) * −18.9 (30.7) 0.041 0.008
Week 16 10.6 (74.6) −35.2 (30.8)
Plasma β-carotene (%)
Specifically, only
Week 8
the increase in plasma
86.8 (220.7) *
zeaxanthin remained
−20.0 (32.2) 0.08
significant
0.029
until week
16Week
in the16 wolfberry group
20.6 (130.1)(+62.5 (92.4) % from week
−38.3 (35.5) 0), also an indicator of good com-
Plasma α-carotene (%) pliance
Week 8to wolfberry 59.4consumption.
(145.1) * The−remaining
14.5 (30.4) carotenoids
0.07 depicted no changes alt-
0.034
Week 16
hough it was noted9.4that(91.6)
in the control −28.4 (34.9)plasma β-cryptoxanthin (−31.6 (36.8) %
group,
Plasma β-cryptoxanthin (%) Week 8 45.7 (111.4) − 13.9 (42.7)
from week 0) and lycopene (−43.6 (36.9) % from week 0)Plasma lycopene (%) Week 8 10.1 (101.3) −24.7 (55.2) 0.32 0.12
Week 16 6.5 (83.2) −43.6 (36.9) *
1 Data presented as percentage change from week 0; 2 Data analyzed with two-way mixed model ANOVA based on the
percentage change with reference to week 0 to normalize for significant differences between plasma total carotenoids and
plasma lycopene at week 0 between groups. * indicates significant difference from week 0 with post-hoc simple effects 8 of 19
Antioxidants 2021, 10, 567
test by Bonferroni’s multiple contrasts.
Figure 3, which depicts the time course changes in SCS, indicated a significant time
effect Figure
(p < 0.001). Thisdepicts
3, which is contributed
the time by the wolfberry
course changes ingroup which reported
SCS, indicated a signifi-
a significant time
cantly
effect higher SCS This
(p < 0.001). fromisweek 8 until week
contributed by the16.
wolfberry group which reported a significantly
higher SCS from week 8 until week 16.
Figure 3. Skin carotenoids status for wolfberry group (n = 22) and control group (n = 18) at 4-week intervals of randomized
Figure 3. Skin carotenoids status for wolfberry group (n = 22) and control group (n = 18) at 4-week intervals of random-
controlled trial. Values are means with error bars representing the corresponding standard errors of mean. Data analyzed
ized controlled trial. Values are means with error bars representing the corresponding standard errors of mean. Data an-
with two-way mixed model ANOVA and post-hoc simple effects test by Bonferroni’s multiple contrasts. * p < 0.05 compared
alyzed with two-way mixed model ANOVA and post-hoc simple effects test by Bonferroni’s multiple contrasts. * p < 0.05
to the corresponding
compared week 0 values.
to the corresponding week 0Skin carotenoids
values. status was
Skin carotenoids not was
status significantly differentdifferent
not significantly betweenbetween
groups groups
at weekat0
according to independent t-tests (p = 0.98).
week 0 according to independent t-tests (p = 0.98).
3.4.Associations
3.4. Associationsbetween
betweenChanges
ChangesininOxidative
OxidativeStress
Stressand
andCarotenoids
CarotenoidsStatus
Status
Regression analyses which
Regression whichexamined
examinedthethe correlations between
correlations betweenthe biomarkers of oxida-
the biomarkers of
tive stressstress
oxidative with plasma carotenoids
with plasma and SCSand
carotenoids areSCSdescribed in Table 2.inInTable
are described the wolfberry
2. In the group,
wolf-
significant
berry group,inverse associations
significant were observed
inverse associations werebetween the between
observed change values of plasma
the change values8-iso-
of
PGF2α8-isoPGF2α
plasma with the corresponding changes in plasma
with the corresponding changesβ-cryptoxanthin (SLR coefficient
in plasma β-cryptoxanthin (SLR(SLR
co-
β): −0.319
efficient (−0.549,
(SLR −0.089)
β): −0.319 ng/µmol;
(−0.549, MLRng/µmol;
−0.089) coefficient (MLR
MLR β): −0.305(MLR
coefficient (−0.555,
β): − 0.054)
−0.305
ng/µmol) and zeaxanthin (MLR β: − 0.213 ( − 0.428, 0.002) ng/µmol).
(−0.555, −0.054) ng/µmol) and zeaxanthin (MLR β: −0.213 (−0.428, 0.002) ng/µmol). In theIn the control group,
inversegroup,
control associations exists
inverse for β-carotene
associations exists(SLR β: −0.610 (−
for β-carotene (SLR β: −
1.089, 0.132)(−1.089,
−0.610 ng/µmol; MLR
−0.132)
β: −0.807MLR
ng/µmol; (−0.136, −0.259)(−0.136,
β: −0.807 ng/µmol) and SCS
−0.259) (MLR β:and
ng/µmol) −0.004
SCS(− 0.007,β:
(MLR −0.001)
−0.004ng/µmol).
(−0.007,
Further evaluation using combined data indicated significant negative
−0.001) ng/µmol). Further evaluation using combined data indicated significant negative associations for
a majority of plasma carotenoids including the concentrations of
associations for a majority of plasma carotenoids including the concentrations of totaltotal carotenoids, β-
carotene, α-carotene, β-cryptoxanthin, lutein and zeaxanthin (p <
carotenoids, β-carotene, α-carotene, β-cryptoxanthin, lutein and zeaxanthin (p < 0.05;0.05; Table A3 in the
Appendix
Table A3 inA).
the Appendix A).
Consistently, changesin
Consistently, changes inplasma
plasmaMDAMDAshowed
showedno nocorrelation
correlationwithwithchange
changevalues
valuesforfor
both plasma carotenoids concentrations and SCS across all regression
both plasma carotenoids concentrations and SCS across all regression models (Table A3). models (Table A3).
3.5. Anthropometrics and Body Composition
The effects of intervention on anthropometry and body composition are shown in
Table 3. No clear changes were observed for BMI and waist circumference across both
groups. Broadly however, for both appendicular and truncal regions, indicators of fat mass
and fat percentage were reduced while indicators of lean mass were raised in both groups
although the change was non-significant. Notable time induced effects were observed
for total lean mass (p = 0.016) and truncal lean mass (p = 0.014) which were both higher,
especially within the control group after 16 weeks.Antioxidants 2021, 10, 567 9 of 19
Table 2. Associations between changes for plasma and skin carotenoids status with corresponding changes in the biomarkers
of oxidative stress by intervention group.
Plasma Malondialdehyde (µmol/L) 2 Plasma 8-Iso-Prostaglandin F2α (ng/L)
Wolfberry
Group Simple Linear Multiple Linear Simple Linear Multiple Linear
(n = 22) 1 Regression p Regression p Regression p Regression p
Coefficient (95% CI) Coefficient (95% CI) 3 Coefficient (95% CI) Coefficient (95% CI) 3
Plasma total
−0.333 (−0.885, −0.204 (−0.460,
carotenoids 0.22 −0.379 (−0.964, 0.206) 0.19 0.11 −0.207 (−0.478, 0.063) 0.12
0.219) 0.051)
(µmol/L)
Plasma
−0.243 (−0.552, −0.058 (−0.212,
β-carotene 0.12 −0.289 (−0.604, 0.027) 0.07 0.44 −0.061 (−0.222, 0.100) 0.44
0.065) 0.096)
(µmol/L)
Plasma
−0.342 (−0.781, −0.112 (−0.328,
α-carotene 0.12 −0.422 (−0.866, 0.022) 0.06 0.29 −0.109 (−0.335, 0.116) 0.32
0.097) 0.104)
(µmol/L)
Plasma β-
−0.190 (−0.760, −0.319 (−0.549, −0.305 (−0.555,
cryptoxanthin 0.49 −0.210 (−0.827, 0.408) 0.48 0.009 0.020
0.379) −0.089) −0.054)
(µmol/L)
Plasma
−0.214 (−0.816, −0.199 (−0.474,
lutein 0.47 −0.206 (−0.897, 0.486) 0.54 0.15 −0.285 (−0.580, 0.010) 0.06
0.388) 0.077)
(µmol/L)
Plasma
−0.167 (−0.376, −0.213 (−0.428,
zeaxanthin 0.015 (−0.453, 0.483 0.95 0.126 (−0.382, 0.634) 0.61 0.11 0.052
0.041) 0.002)
(µmol/L)
Plasma
−0.173 (−0.681, −0.138 (−0.374,
lycopene 0.48 −0.273 (−0.912, 0.365) 0.38 0.24 −0.087 (−0.391, 0.218) 0.56
0.334) 0.097)
(µmol/L)
Skin
carotenoids 0.005 (−0.003, 0.014) 0.19 0.005 (−0.004, 0.013) 0.24 0.000 (−0.004, 0.004) 0.93 0.000 (−0.004, 0.004) 0.92
status
Plasma Malondialdehyde (µmol/L) 2 Plasma 8-Iso-Prostaglandin F2α (ng/L)
Control
Group Simple Linear Multiple Linear Simple Linear Multiple Linear
(n = 18) 1 Regression p Regression p Regression p Regression p
Coefficient (95% CI) Coefficient (95% CI) 3 Coefficient (95% CI) Coefficient (95% CI) 3
Plasma total
−0.526 (−1.131,
carotenoids 1.887 (−0.504, 4.277) 0.11 2.757 (−1.015, 6.528) 0.14 0.08 −0.725 (−1.589, 0.139) 0.09
0.078)
(µmol/L)
Plasma
−0.610 (−1.089, −0.807 (−1.36,
β-carotene 1.420 (−0.698, 3.538) 0.17 1.506 (−1.471, 4.484) 0.29 0.016 0.007
−0.132) −0.259)
(µmol/L)
Plasma
−0.358 (−0.914,
α-carotene 1.931 (−0.112, 3.974) 0.06 2.773 (−0.202, 5.747) 0.07 0.19 −0.351 (−1.12, 0.422) 0.35
0.198)
(µmol/L)
Plasma β-
−0.422 (−0.931,
cryptoxanthin 1.026 (−1.070, 3.123) 0.32 1.547 (−1.853, 4.946) 0.34 0.10 −0.446 (−1.23, 0.337) 0.24
0.088)
(µmol/L)
Plasma
−0.183 (−0.776,
lutein 2.141 (0.096, 4.186) 0.041 2.245 (−0.715, 5.204) 0.13 0.52 −0.388 (−1.116, 0.339) 0.27
0.410)
(µmol/L)
Plasma
−0.525 (−1.153,
zeaxanthin 1.535 (−1.012, 4.082) 0.22 1.196 (−2.037, 4.428) 0.44 0.10 −0.652 (−1.325, 0.021) 0.06
0.103)
(µmol/L)
Plasma
−0.226 (−0.769,
lycopene 1.489 (−0.526, 3.504) 0.14 1.945 (−0.806, 4.697) 0.151 0.39 −0.055 (−0.757, 0.646) 0.87
0.316)
(µmol/L)
Skin
−0.002 (−0.005, −0.004 (−0.007,
carotenoids 0.006 (−0.008, 0.019) 0.38 0.005 (−0.011, 0.021) 0.52 0.27 0.011
0.002) −0.001)
status
1 Plasma carotenoids were evaluated as percentage change from week 0 to normalize for significant differences between groups at week 0;
2 Regression coefficient for plasma carotenoids (×103 ); 3 Model adjusted for covariates age, sex and body mass index.
Between the change values for body composition and the corresponding changes
to lipid peroxidation biomarkers, associations were present in neither the wolfberry nor
control groups. (Table A4 in the Appendix A).Antioxidants 2021, 10, 567 10 of 19
Table 3. Population anthropometric indicators and body compositions at different time points of randomized controlled
trial.
Wolfberry Group Control Group p
Study Visit (n = 22) (n = 18)
Mean (SD) Mean (SD) Time 2 Intervention × Time 2
Body mass index (kg/m2 ) Week 0 1 22.7 (3.7) 22.8 (2.5) 0.51 0.67
Week 4 22.8 (3.6) 22.8 (2.3)
Week 8 22.8 (3.7) 22.9 (2.3)
Week 12 22.8 (3.7) 22.8 (2.4)
Week 16 22.7 (3.7) 22.9 (2.3)
Waist circumference (cm) Week 0 80.5 (9.6) 80.8 (7.5) 0.55 0.96
Week 4 80.7 (10.2) 80.9 (6.6)
Week 8 80.4 (10.2) 80.1 (6.7)
Week 12 80.2 (9.9) 80.7 (7.4)
Week 16 80.4 (9.6) 80.2 (6.4)
Total fat (%) Week 0 36.5 (6.9) 35.1 (6.1) 0.08 0.44
Week 16 36.2 (7.4) 34.4 (7.4)
Truncal fat (%) Week 0 37.0 (7.6) 35.7 (5.7) 0.15 0.56
Week 16 36.7 (7.9) 35.0 (6.9)
Appendicular fat (%) Week 0 38.9 (8.7) 36.5 (8.9) 0.31 0.56
Week 16 38.7 (9.7) 35.9 (10.6)
Total fat mass (kg) Week 0 21.3 (6.3) 20.9 (4.0) 0.12 0.62
Week 16 21.1 (6.3) 20.5 (4.3)
Truncal fat mass (kg) Week 0 10.8 (3.6) 10.2 (1.9) 0.25 0.90
Week 16 10.6 (3.5) 10.1 (2.0)
Appendicular fat mass (kg) Week 0 9.6 (3.0) 9.7 (2.7) 0.10 0.37
Week 16 9.5 (3.0) 9.4 (2.9)
Total lean mass (kg) Week 0 34.8 (6.9) 37.0 (7.5) 0.016 0.26
Week 16 35.1 (7.3) 37.8 (8.1) *
Truncal lean mass (kg) Week 0 17.3 (3.1) 18.0 (3.4) 0.014 0.25
Week 16 17.5 (3.4) 18.5 (3.7) *
Appendicular lean mass (kg) Week 0 14.6 (3.6) 16.0 (3.9) 0.08 0.32
Week 16 14.7 (3.8) 16.3 (4.2)
1 Independent t-test which compared between the wolfberry and control groups indicated no significant differences in anthropometric
indicators and body composition at week 0; 2 Data analyzed with two-way mixed model ANOVA. * indicates significant difference from
week 0 with post-hoc simple effects test by Bonferroni’s multiple contrasts.
4. Discussion
Oxidative stress susceptibility increases with age due to a reduced efficacy of the
endogenous antioxidant system [2]. While this may be strengthened by exogenous factors
such as the adherence toward a HDP, the consumption of wolfberry, which is rich in dietary
antioxidants, may further strengthen defense against oxidative stress [32]. The findings
from our current RCT indicated that the incorporation of whole dried wolfberry to the MHP
lowers oxidant burden in middle-aged and older adults over a 16-week intervention period.
The inverse association between the change values for plasma 8-isoPGF2α and plasma
zeaxanthin further suggests that the rich zeaxanthin content in wolfberry may be partly
responsible for the alleviation of oxidative stress. Although there were improvements in
lean mass following adherence to the MHP, wolfberry intake did not confer any further
benefits to body composition.
Oxidative stress in the present study was determined by examining the products of free
radical catalyzed polyunsaturated fatty acid peroxidation, MDA and 8-isoPGF2α. Specific
to plasma 8-isoPGF2α, a marked reduction in oxidant production was detected following
wolfberry intake only. This aligns with the results from earlier an RCT [33], which reported
an increase in plasma antioxidant capacity after a 3-month intervention with 13.7 g/d
of a milk-based wolfberry formulation in older adults [33]. Similarly, in another 8 week-
RCT, consuming an aqueous concoction prepared with 13.5 g wolfberry daily significantly
lowered oxidative stress induced lymphocyte DNA damage [34]. Epidemiological evidence,
including a systematic review, consistently demonstrated direct associations betweenAntioxidants 2021, 10, 567 11 of 19
8-isoPGF2α concentrations and chronic diseases incidence. Retrospective inspection of
case-control models indicated that cases, which included individuals with hypertension,
coronary artery disease and type 2 diabetes diagnosis, have approximately 10%, 28% and
30% higher plasma 8-isoPGF2α than controls respectively [35,36]. Furthermore, in the
Coronary Artery Risk Development in Young Adults (CARDIA) study, it was deduced
that a 1 SD increment in 8-isoPGF2α increases the odds of coronary artery calcification
by 24% [37]. Although caution in interpretation is required, the present 37% decrease
in 8-isoPGF2α among wolfberry group participants suggests a physiologically relevant
attenuation in oxidant burden and potential in lowering the risk of chronic diseases.
On the contrary, MDA as determined by TBARS assay, which similarly reflects lipid
peroxidation, exhibited no changes in either group. Although markedly more abundant
than 8-isoPGF2α, circulating MDA is more reactive and can form adducts with DNA and
amino acids/proteins [38]. Moreover, it is also speculated to undergo rapid metabolic
clearance [39]. Although previous shorter duration RCTs reported marked reductions in
MDA following wolfberry-based interventions [12,40], its sensitivity makes it prone to
fluctuations during longer intervention durations such as at present. Hence, this may yield
a poorer depiction of oxidative stress status contrast to 8-isoPGF2α which exhibits greater
chemical stability.
As wolfberry is one of the richest natural sources of the carotenoid zeaxanthin [41], we
attempted to further elucidate its antioxidant properties, by examining the relationships
between change values of the lipid peroxidation biomarkers and corresponding changes in
carotenoids status. In the wolfberry group, the higher plasma zeaxanthin from weeks 8 to
16, coupled with the inverse associations with 8-isoPGF2α suggests that the zeaxanthin
fraction in wolfberry may have contributed to its antioxidant properties. While the MLR
also depicted inverse associations between 8-isoPGF2α with plasma β-cryptoxanthin
(wolfberry group) as well as β-carotene and SCS (control group), only plasma zeaxanthin
in the wolfberry group was simultaneously raised at week 16, supporting its role as a
mediator for the observed change in oxidant burden. This aligns with a previous animal
study which reported an attenuation of high fat diet induced oxidative stress in rats
which was dosed a lutein and zeaxanthin rich marigold flower extract [42]. In addition, a
4-week clinical trial with one soft-boiled egg/d likewise reported raised plasma zeaxanthin
and lutein concentrations which were negatively correlated with low-density lipoprotein
oxidation [43].
Whilst able to scavenge free radicals directly, blood zeaxanthin, which is inherently
lower in concentration than a majority of circulating antioxidants, may elicit its antioxi-
dant action via alternative mechanisms of action beyond direct quenching. For instance,
in an in vitro model, binding between zeaxanthin to glutathione S-transferase (GSTP1)
was demonstrated to be effective in inhibiting phospholipid membrane oxidation [44].
Furthermore, zeaxanthin was also observed to destabilize kelch-like ECH-associated pro-
tein 1–nuclear factor erythroid 2-related factor 2 (Keap1-Nrf2) systems which upregulates
glutathione production via the modulation of enzymes such as glutathione reductase
and glutamate cysteine ligase [20,45,46]. Zeaxanthin in wolfberry was also observed to
exhibit good bioavailability, as evidenced by the marked rise in plasma zeaxanthin in
the wolfberry group. Present most abundantly as zeaxanthin dipalmitate in wolfberry
(~90% of zeaxanthin compounds), the diester yields a structurally looser configuration over
helical arrangements in its free form [47]. This enhances dissolution and thus, promotes
gastrointestinal uptake. As evidenced by an earlier postprandial assessment, zeaxanthin
bioavailability was demonstrated to be 23% higher following an acute administration of
zeaxanthin dipalmitate over free zeaxanthin [48].
Nevertheless, besides zeaxanthin, wolfberry contains other antioxidants including
LBP, polyphenols and vitamin C precursor 2-O-(β-d-glucopyranosyl) ascorbic acid [40].
The concerted action of these bioactive compounds is expected to not only further aid in the
alleviation of oxidative stress, but also, support the maintenance of carotenoids status. Ac-
cording to the sparing hypothesis, synergism between antioxidant components may protectAntioxidants 2021, 10, 567 12 of 19
circulating carotenoids from oxidation, preventing stress induced depletion [49]. This is
reflected in the present study which saw both marked increments in plasma carotenoids at
different time points, as well as an increase in skin carotenoids deposition in the wolfberry
group which reported a reduction in oxidant burden. Contrast to carotenoids in circula-
tion, the skin is a more effective reservoir for carotenoids which makes it less sensitive
to fluctuations [50]. Thus, it may yield a longer-term indication of carotenoids status for
the present 16-week RCT which may explain the potential discrepancies between SCS
and plasma carotenoids at different time points. Moreover in a previous cross-sectional
study conducted by the same research group, it was also observed that SCS and plasma
carotenoids may be independently confounded by different factors. For instance, only SCS
but not plasma carotenoids were influenced by sex [51]. This was speculated to be linked
to factors such as differences in body size and fat distribution [50].
Lastly, body composition was also measured as excess adiposity, particular in the
truncal region is known to induce lipid peroxidation and lower antioxidant activity [52].
This is attributed a dysregulated adipokine secretion pattern and an increase in circulating
free fatty acids [53,54]. Previous RCTs which investigated the impact of wolfberry fruit
juice (14 days; 120 mL/d) and wolfberry fruit (45 days; 14 g/d) both deduced significant
reductions in waist circumference but a lack of change in body weight [12,55]. While the
present study is the first to conduct a detailed assessment of truncal adiposity using DXA,
it was noted that although fat mass and lean mass were lowered and raised respectively at
week 16, the changes were non-significant. This may be due to a discrepancy in adiposity
contrast to the previous RCTs at baseline. Namely, the earlier studies recruited overweight
and obese individuals while the present participants were within the healthy weight range.
Moreover, the trial involving wolfberry fruit juice also advocated diet restrictions and
exercise programs among overweight and obese subjects [55]. Nevertheless, significant
time effects for total lean mass and truncal lean mass indicate considerable benefits with the
adherence to the MHP. This is supported by cross-sectional evidence which found direct
associations between HDP adherence and lean body mass [56]. Additionally, HDPs such as
the Mediterranean diet was also reported to slow down the onset of frailty, a consequence of
lean mass reduction in older adults [57,58]. Deficits in certain nutrients had been implicated
to decrease lean mass [59]. For instance, in older adults, this had been linked to a lack
of folate, vitamin B12 , vitamin D, calcium as well as dietary antioxidants in general [60].
Holistically, a HDP provides diversity of nutrients to alleviate nutritional deficiencies which
potentially contributes to the favorable changes in lean mass. Furthermore, according to
the present changes in dietary protein (important precursors for the maintenance of lean
mass) as reported previously (wolfberry: −11 (53) g/d; control: +5 (21) g/d) [61]; lower
and higher intakes in the wolfberry and control groups respectively post-intervention,
albeit non-significant, may explain the more prominent lean mass increase in the control
group [62].
At present, limited evidence examined the impact of whole dried wolfberry consump-
tion on oxidative stress. This is especially so amongst the middle-aged and older adults
who are at a heightened vulnerability to oxidative stress. By incorporating wolfberry into a
HDP, the present RCT establishes a feasible dietary strategy by taking into consideration
the background dietary pattern. Moreover, this was coupled with a comprehensive assay
of carotenoids status which comprised of the dietary intake as well as the concentrations
in both the plasma and skin. For a carotenoid-rich food such as wolfberry, this allows
for an examination of compliance as well as an assessment of carotenoid bioavailability.
Finally, interpreting the correlations between changes in oxidative stress status with both
the carotenoids status and body composition permits a concurrent exploration of the un-
derlying antioxidant properties. However, caution ought to be exercised for this does
not serve as a mechanistic assessment. In this aspect as well, it should be noted that the
present population may also be inadequately powered to study correlations, especially
among individual groups. Nevertheless, the results from the present RCT may be useful
preliminary data for power calculations in the future.Antioxidants 2021, 10, 567 13 of 19
Another study limitation lies in the baseline discrepancies for carotenoids status
(plasma total carotenoids and lycopene) and dietary data (wholegrain intake) between
groups. Although appropriate statistical techniques may be practiced for a more robust
examination of the results, potential biases can still be present. Therefore, the authors
recommend the use of stratified randomization for primary outcome variables to minimize
heterogeneity at baseline. Additionally, while unsaturated lipids, lipoproteins and cell
phospholipid membranes are key targets to oxidative stress, there are other predictor
variables to assess oxidative stress which were not evaluated at present. For a more in
depth evaluation of oxidative stress, the activity of enzymes which catalyze ROS reactions
(e.g., superoxide dismutase and glutathione peroxidase) may be analyzed to yield a more
comprehensive evaluation of antioxidant capacity. While the present study provided
commercially available dried whole wolfberry, processing conditions performed prior
to distribution remains unclear. As procedures such as drying had been implicated to
alter the antioxidant potential of fruits and vegetables, this may be a limitation which was
overlooked [63]. Nonetheless, the effects of drying technique on the antioxidant potential
of wolfberry may serve as a promising direction for future research. Moreover, beyond the
rich carotenoids content in wolfberry, the antioxidant properties of wolfberry, as discussed
earlier, may also be synergistically enhanced by other bioactive constituents including the
LBP and various polyphenols. As both constituents are metabolized by the gut microflora,
the effects of wolfberry intake on the gastrointestinal microbiome and its downstream
metabolic products (e.g., short chain fatty acids) can also be further investigated in future
research for a more thorough elucidation of the antioxidant effects from wolfberry. Future
works may also focus individuals with elevated oxidative stress such as older adults
or individuals with metabolic syndrome who may benefit more substantially for the
antioxidant properties of wolfberry.
5. Conclusions
Whole dried wolfberry intake was observed to lower of oxidant burden after a 16-week
intervention and these promising changes may be driven by the rich zeaxanthin content in
wolfberry. Especially among middle-aged and older adults, the incorporation of 15 g/d
whole dried wolfberry to a healthy dietary pattern may serve as an effective dietary strategy
to attenuate oxidative stress, a predisposing risk factor of many age-related disorders.
Author Contributions: Conceptualization, D.W.K.T. and J.E.K.; project administration, D.W.K.T.,
C.N.S., D.P.S.L. and D.T.; methodology, D.W.K.T. and W.Y.L.; investigation and validation, D.W.K.T.,
W.Y.L. and H.Z.; formal analysis and data curation, D.W.K.T.; writing—original draft, review and
editing, D.W.K.T. under the supervision of J.E.K.; resources and funding acquisition, J.E.K. All authors
have read and agreed to the published version of the manuscript.
Funding: This research was funded by the National University of Singapore (R160-000-A03-133),
the Ministry of Education Academic Research Fund Tier 1, Singapore [R160-000-A26-114] and the
Agency for Science, Technology and Research [R-160-000-B12-305].
Institutional Review Board Statement: The study was registered at clinicaltrials.gov (NCT03535844),
was conducted according to the guidelines of the Declaration of Helsinki and was approved by the
National Healthcare Group Domain Specific Review Board (reference number: 2018/00311; date of
approval 20 June 2018).
Informed Consent Statement: Informed consent was obtained from all subjects involved in the study.
Data Availability Statement: The data presented in this study will be made available on request
from the corresponding author. The data are not publicly available due to restrictions of informed
consent and institutional guidelines.
Acknowledgments: We thank Jasmine Hui Min Low, Xuejuan Xia and Yuanhang Yao for their kind
assistance during the clinical study. We are also grateful to Huey Lee Lew for her support and advice
during method development.
Conflicts of Interest: The authors declare no conflict of interest.Data Availability Statement: The data presented in this study will be made available on request
from the corresponding author. The data are not publicly available due to restrictions of informed
consent and institutional guidelines.
Acknowledgments: We thank Jasmine Hui Min Low, Xuejuan Xia and Yuanhang Yao for their
Antioxidants 2021, 10, 567 kind assistance during the clinical study. We are also grateful to Huey Lee Lew for her support and
14 of 19
advice during method development.
Conflicts of Interest: The authors declare no conflict of interest.
Appendix
Appendix A
A
Figure A1. Representative chromatogram for
for plasma
plasma carotenoids
carotenoids analysis.
analysis.
Table A1. Plasma carotenoids status at different time points in randomized controlled trial.
Wolfberry Group Control Group p
Study Visit (n = 22) (n = 18)
Mean (SD) Mean (SD) Week 0 1 Time 2 Intervention × Time 2
Plasma total
carotenoids Week 0 2.02 (0.90) 2.75 (0.95) 0.018 0.002 0.005
(µmol/L)
Week 8 2.45 (0.99) * 2.14 (0.85)
Week 16 1.92 (1.03) 1.68 (0.89)
Plasma β-carotene
Week 0 0.43 (0.30) 0.65 (0.40) 0.06 0.008 0.049
(µmol/L)
Week 8 0.54 (0.39) * 0.50 (0.34)
Week 16 0.39 (0.29) 0.37 (0.27)
Plasma α-carotene
Week 0 0.26 (0.12) 0.33 (0.12) 0.05 0.005 0.030
(µmol/L)
Week 8 0.32 (0.16) * 0.28 (0.13)
Week 16 0.24 (0.14) 0.23 (0.11)
Plasma
β-cryptoxanthin Week 0 0.45 (0.05) 0.67 (0.41) 0.05Antioxidants 2021, 10, 567 15 of 19
Table A1. Cont.
Wolfberry Group Control Group p
Study Visit (n = 22) (n = 18) 2
Mean (SD) Mean (SD) Week 0 1 Time Intervention × Time 2
Week 8 0.24 (0.10) 0.33 (0.19)
Week 16 0.27 (0.21) 0.26 (0.33) *
1 Data analyzed with independent t-test between groups at week 0; 2 Data analyzed with two-way mixed model ANOVA. Plasma
carotenoids were evaluated using absolute concentrations * indicates significant difference from week 0 with post-hoc simple effects test by
Bonferroni’s multiple contrasts. A comparison between week 16 absolute plasma carotenoid concentrations were additionally evaluated
with analysis of covariance (ANCOVA) controlled for corresponding week 0 concentrations. # indicates statistically significant difference.
Table A2. Population dietary and carotenoids intake at different time points of randomized controlled trial 1 .
Wolfberry Group (n = 21) Control Group (n = 17)
Dietary Factors Study Visit p
Mean (SD) Mean (SD)
Fruits (servings/d) Week 0 1.7 (1.3) 2.7 (1.7) 0.06
Week 8 3.2 (1.5) 2.5 (1.3) 0.13
Week 16 3.4 (1.4) 2.4 (1.2) 0.028 2
Vegetables (servings/d) Week 0 2.2 (1.8) 2.0 (1.2) 0.66
Week 8 2.3 (0.9) 2.2 (1.4) 0.77
Week 16 2.9 (1.4) 2.8 (1.5) 0.96
Wholegrains (servings/d) Week 0 0.3 (0.4) 1.0 (0.8) 0.001
Week 8 1.6 (1.1) 1.6 (1.0) 0.89
Week 16 2.2 (2.3) 1.8 (1.0) 0.64
Meats and alternatives (servings/d) Week 0 2.6 (0.8) 2.5 (1.0) 0.67
Week 8 2.4 (0.7) 3.0 (1.0) 0.016
Week 16 2.7 (1.3) 2.7 (1.2) 0.74
Total carotenoids (mg/d) Week 0 8.63 (7.50) 11.09 (7.04) 0.31
Week 8 9.35 (6.53) 8.94 (6.46) 0.71
Week 16 10.51 (5.06) 12.83 (7.38) 0.34
β-carotene (mg/d) Week 0 3.46 (3.09) 4.34 (3.12) 0.39
Week 8 3.51 (2.65) 3.96 (3.00) 0.84
Week 16 3.89 (2.38) 6.30 (4.75) 0.08
α-carotene (mg/d) Week 0 0.42 (0.82) 0.59 (1.04) 0.59
Week 8 0.47 (0.65) 0.62 (0.79) 0.69
Week 16 0.54 (0.63) 0.80 (1.17) 0.49
β-cryptoxanthin (mg/d) Week 0 0.11 (0.16) 0.18 (0.30) 0.43
Week 8 0.20 (0.28) 0.20 (0.22) 0.87
Week 16 0.23 (0.26) 0.17 (0.19) 0.45
Lutein and zeaxanthin (mg/d) Week 0 3.10 (2.85) 3.58 (2.35) 0.58
Week 8 3.27 (3.35) 3.43 (2.80) 0.89
Week 16 3.49 (2.56) 4.35 (3.62) 0.45
Lycopene (mg/d) Week 0 1.52 (2.27) 2.40 (3.46) 0.35
Week 8 1.90 (3.30) 0.73 (0.79) 0.10
Week 16 2.37 (2.09) 1.21 (1.49) 0.011
1 Week 0 dietary data compared with independent t-test between wolfberry and control groups. Week 8 and 16 dietary data compared
with analysis of covariance (ANCOVA) controlled for corresponding week 0 intake. 2 p = 0.24 with the omission of wolfberry intake (0.5
servings/d).
Table A3. Associations between absolute change values of plasma carotenoids concentration and skin carotenoids status
with corresponding changes in the biomarkers of oxidative stress for combined study population.
Plasma Malondialdehyde (µmol/L) 1 Plasma 8-Iso-Prostaglandin F2α (ng/L)
Simple Linear Multiple Linear Simple Linear Multiple Linear
Regression p Regression p Regression p Regression p
Coefficient (95% CI) Coefficient (95% CI) 2 Coefficient (95% CI) Coefficient (95% CI) 2
Plasma total
−0.015 (−0.025, −0.017 (−0.028,
carotenoids 0.005 (−0.027, 0.036) 0.76 0.007 (−0.030, 0.044) 0.70 0.004 0.002
−0.005) −0.007)
(µmol/L)Antioxidants 2021, 10, 567 16 of 19
Table A3. Cont.
Plasma Malondialdehyde (µmol/L) 1 Plasma 8-Iso-Prostaglandin F2α (ng/L)
Simple Linear Multiple Linear Simple Linear Multiple Linear
Regression p Regression p Regression p Regression p
Coefficient (95% CI) Coefficient (95% CI) 2 Coefficient (95% CI) Coefficient (95% CI) 2
Plasma
−0.044 (−0.075, −0.048 (−0.081,
β-carotene 0.000 (−0.099, 0.100) 1.00 −0.005 (−0.117, 0.108) 0.94 0.007 0.006
−0.013) −0.015)
(µmol/L)
Plasma
−0.089 (−0.175, −0.100 (−0.195,
α-carotene 0.024 (−0.241, 0.288) 0.86 0.022 (−0.286, 0.330) 0.89 0.044 0.039
−0.013) −0.005)
(µmol/L)
Plasma β-
−0.055 (−0.090, −0.055 (−0.091,
cryptoxanthin 0.014 (−0.100, 0.129) 0.80 0.024 (−0.101, 0.150) 0.70 0.003 0.005
−0.020) −0.018)
(µmol/L)
Plasma
−0.066 (−0.125, −0.076 (−0.138,
lutein 0.071 (−0.113, 0.254) 0.44 0.066 (−0.139, 0.271) 0.52 0.032 0.019
−0.006) −0.013)
(µmol/L)
Plasma
−0.104 (−0.215, −0.125 (−0.239,
zeaxanthin 0.126 (−0.208, 0.461) 0.45 0.173 (−0.194, 0.541) 0.34 0.07 0.034
0.007) −0.010)
(µmol/L)
Plasma
−0.033 (−0.073,
lycopene 0.002 (−0.118, 0.122) 0.98 0.019 (−0.118, 0.156) 0.79 0.10 −0.034 (−0.077, 0.010) 0.13
0.007)
(µmol/L)
Skin
−0.001 (−0.004,
carotenoids 0.005 (−0.002, 0.012) 0.14 0.005 (−0.002, 0.012) 0.19 0.31 −0.002 (−0.004, 0.001) 0.12
0.001)
status
1 Regression coefficient for plasma carotenoids (×103 ); 2 Model adjusted for covariates age, sex and body mass index.
Table A4. Association between change values of body compossition with corresponding changes in the biomarkers of
oxidative stress by intervention group.
Plasma Malondialdehyde (µmol/L) 1 Plasma 8-Iso-Prostaglandin F2α (ng/L) 1
Wolfberry Group
(n = 22) Simple Linear Regression Simple Linear Regression
p p
Coefficient (95% CI) Coefficient (95% CI)
Total fat (%) −0.01 (−1.47, 2.70) 0.55 231 (−776, 1238) 0.63
Truncal fat (%) 0.57 (−2.77, 3.91) 0.72 −6 (−867, 855) 0.99
Appendicular fat (%) −0.80 (−3.93, 2.32) 0.59 509 (−255, 1274) 0.18
Total fat mass (kg) 5.7 (−53.6, 65.0) 0.84 0.39 (−14.86, 15.65) 0.96
Truncal fat mass (kg) 6.9 (−101.4, 115.2) 0.89 4.12 (−31.88, 23.64) 0.76
Appendicular fat mass (kg) 21.4 (−108.6, 151.4) 0.73 8.73 (−24.46, 41.93) 0.59
Total lean mass (kg) 8.6 (−55.8, 73.0) 0.78 8.99 (−24.88, 6.90) 0.25
Truncal lean mass (kg) −42.9 (−153.7, 68.0) 0.42 −4.73 (−33.69, 24.23) 0.73
Appendicular lean mass (kg) 69.3 (−36.1, 174.7) 0.18 −23.76 (−49.51, 1.98) 0.07
Plasma Malondialdehyde (µmol/L) Plasma 8-Iso-Prostaglandin F2α (ng/L)
Control Group
(n = 18) Simple Linear Regression Simple Linear Regression
p p
Coefficient (95% CI) Coefficient (95% CI)
Total fat (%) 1.29 (−1.04, 3.61) 0.26 396 (−732, 1523) 0.47
Truncal fat (%) 0.72 (−1.32, 2.75) 0.47 242 (−732, 1216) 0.61
Appendicular fat (%) 1.46 (−0.35, 3.27) 0.11 422 (−477, 1321) 0.34
Total fat mass (kg) 14.7 (−23.6, 53.0) 0.43 8.03 (−10.09, 26.15) 0.37
Truncal fat mass (kg) 2.47 (−62.6, 67.5) 0.94 7.12 (−23.64, 37.88) 0.64
Appendicular fat mass (kg) 47.0 (−25.7, 119.6) 0.19 17.63 (−17.51, 52.77) 0.31
Total lean mass (kg) −16.6 (−47.6, 14.5) 0.28 −0.00 (−15.22, 15.19) 1.00
Truncal lean mass (kg) −33.1 (−92.0, 25.7) 0.25 −2.48 (−31.38, 26.43) 0.86
Appendicular lean mass (kg) −30.0 (−94.0, 34.1) 0.34 1.90 (−29.26, 33.07) 0.90
1 Regression coefficient for absolute fat and lean masses ×106 for plasma malondialdehyde; ×103 for plasma 8-iso-prostaglandin F2α.You can also read