Workforce Solutions Deep East Texas Board Plan Program Years 2021-2024
←
→
Page content transcription
If your browser does not render page correctly, please read the page content below
Workforce Solutions Deep East Texas
                                   Board Plan
                            Program Years 2021-2024

Introduction

Under the Workforce Innovation and Opportunity Act (WIOA) §108 (20 Code of Federal Regulations
§679.500–580), each Local Workforce Development Board (Board) is required to develop and submit to
the state a comprehensive four-year plan (Board Plan) that identifies and describes policies and
procedures as well as local activities that are in line with the State Plan. This Board Plan must be
developed openly and be available to the public for comment for at least 15 days, but no more than 30
days, particularly to members of the business and educational communities as well as various other
labor organizations. Along with submission of the Board Plan to the Texas Workforce Commission
(TWC), the Board must submit all public comments of disagreement with the plan to TWC.

At the end of the first two-year period, the appropriate chief elected officials (CEOs) and the Board will
review the local plan and prepare and submit modifications to reflect changes in the labor market and
economic conditions, factors affecting the implementation of the plan, changes in financing, changes
to the structure of the Board, and/or the need to revise strategies to meet local performance goals.

Board Response:

The Deep East Texas Workforce Development Board, dba Workforce Solutions Deep East Texas, is one
(1) of twenty-eight (28) Workforce Boards in the state of Texas that is responsible for leading and
governing the region's public workforce system. As an administrative body, it provides oversight for
employment, training and child care services in our area. Additionally, the Board is responsible for
strategic planning to address workforce issues for a twelve (12) county region. The Workforce Solutions
Deep East Texas region consists of the counties of: Angelina, Houston, Jasper, Nacogdoches, Newton,
Polk, Sabine, San Augustine, San Jacinto, Shelby, Trinity and Tyler.

The Workforce Development Board consists of twenty-five (25) to thirty-one (31) members. Of these
volunteer members, fifty-one percent (51%) of the members shall be made up of members from the
private sector business who have substantial management responsibility within their organization. The
other members will be comprised of representatives from other entities, such as education, economic
development, child care and other community-based organizations which ensure that other workforce
needs are addressed regarding jobseekers and other targeted populations. Members are appointed by
the Chief Elected Officials of the region with final approval by the Texas Workforce Commissioners.
The region's chief elected officials are the County Judges of Angelina, Houston, Jasper, Nacogdoches,
Newton, Polk, Sabine, San Augustine, San Jacinto, Shelby, Trinity and Tyler and the Mayor of Lufkin.

The Board generally meets on the 2nd Tuesday of each month. Meeting notices and agendas are posted
on the Texas Registry and on the Board's website at www.detwork.org. All meetings are open to the
public to allow the general public an opportunity to make comments at each meeting.

Part 1: Board Vision and Strategies

The strategic elements of the Local Workforce Development Board Planning Guidelines (Guidelines) are
as follows:
A. Vision and Goals
(WIOA §108(b)(1)(E); 20 CFR §679.560(a)(5))
Boards must include a description of the Board’s strategic vision to support regional economic growth
and economic self-sufficiency. The description must include:
· goals for preparing an educated and skilled workforce, including early education services, and
services for youth and individuals with barriers to employment; and
· goals relating to the performance accountability measures based on performance indicators
described in WIOA §116(b)(2)(A).
Board Response:
Workforce Solutions Deep East Texas is a responsive and effective Workforce Development Board
overseeing a quality, competitive workforce system for a changing economy. The Deep East Texas
Workforce Board envisions a regional workforce that is educated, innovative and highly skilled in areas
that match the skill requirements of the Region's employers. The Board's mission is to: Provide
solutions for quality workforce development. The Board's strategic plan for 2021-2024 sets forth the
goals and strategies that will guide us toward achievement of our mission.
Meeting the needs of local businesses for qualified staff and helping parents obtain affordable child
care is essential to the local and state economy. Workforce Solutions Deep East Texas accomplishes
this through partnerships with economic development, other business groups, Independent School
Districts (ISDs) and local colleges to identify and find solutions to employer needs; by ensuring good
fiscal stewardship in hiring qualified staff who are thoroughly trained; through continual monitoring
of performance, fiscal needs and expenditures at all levels; by responding with assistance to negative
events such as layoffs or disasters; through Board and contractor staff involvement in the community
organizations, child care facilities and schools, both formally and informally, to ensure sufficient
services are provided to fully equip workers; and by providing information, individualized services,
tools, support in qualifying for child care and workshops to increase job seekers’ knowledge of employer
expectations and increase the chances of their success in the workplace and by providing barrier-free
access to workforce information, programs and services. Also, through information by supplying
parents with educational materials pertaining to their child's growth and development in a Board-
produced educational pamphlet that will be distributed to each family enrolled into childcare services.
Vision
A regional workforce that is educated, innovative and highly skilled in areas that
match the skill requirements of the Region's employers
Goals
1. Employer Relationships
2. Education Integration
3. Child Care Early Learning (Quality Education)
4. Strengthening Community Partnerships
5. Performance Accountability
2Goals Strategies Results
Number/percent of the region's
Engage in meaningful outreach i.e. employers who use Workforce
meetings, visits, tours, ongoing Solutions Deep East Texas:
conversations, and timely follow-up. 2021: 16.05% quarterly Goal
Continually assess and understand 2022: 17% quarterly
the needs of the businesses. 2023: 18% quarterly
2024: 19% quarterly
1. Employer Relationships Number of new employers in
WorkInTexas.com:
Foster relationships with employers Deliver quality and timely services. Baseline FY’20: 290
to build loyalty and increase their Increase responsiveness to employer 2021: 360
utilization of workforce services. needs. 2022: 375 (4% increase)
2023: 400 (4% increase)
2024: 416 (4% increase)
Number of Job Fairs/Recruiting
Develop and maintain a database of Events:
the region's employers and 2021: 84
track/report interactions, manage 2022: 88
leads and follow-up activity. 2023: 92
2024: 96
Collaborate with school districts,
colleges and businesses to offer
frequent career exploration Participation in all counties:
experiences for youth.
2020-2024: Minimum of 30 Teacher
Externships annually
2021: 30
Increase the number of youth 2022: 30
2. Education Integration prepared to enter the workforce after 2023: 30
high school by earning certifications 2024: 30
Enhance alignment among career or credentials; facilitate this by
and technical education in 8th - 12th promoting Career and Technical
Host at least 4 Career Industries
grades, post-secondary education Education (CTE) opportunities in events with a minimum of 6 school
and industry to provide the workforce High Schools through funding such
districts represented annually
area with a pipeline of quality future as a Jobs and Education for Texans
2021: 4 events, 6 ISDs
workers skilled in areas that match (JET) grant. 2022: 4 events, 6 ISDs
the requirements of the region's
2023: 4 events, 6 ISDs
employers. Communicate the benefits of local
2024: 4 events, 6 ISDs
career opportunities in target
industries for youth. Encourage
Collaboration of 2 JET Grants with
youth investment in occupations that
ISD's within the Workforce
are in demand.
Development Area (WDA) by the end
of 2024.
Prepare and maintain a database of
current CTE courses in the region
and facilitate direct links to the
region's target/demand occupations.
3Goals Strategies Results
Prepare children for public education
by providing a high quality, detailed,
age appropriate curriculum at Texas
3. Child Care Early Learning (Quality Rising Star (TRS) certified centers.
Education) Assigning children a Texas Education Meet or exceed target performance
Agency (TEA) identification number number of children in care each
Create and strengthen the that will follow them from early program year.
foundation of early childhood education through post-secondary
education that will support a child's education to identify early
continuation into post-secondary intervention success in quality
education and then into the childcare.
workforce. Include parents in all
aspects of learning and development Assessing and mentoring TRS TRS Certified Centers
in order to allow the education to Centers to meet higher quality Baseline: 42%
continue in the home. standards of childcare. Adding 2020-2021: 45%
additional TRS centers and 2021-2022: 50%
increasing current TRS centers Star 2022-2023: 52%
levels. 2023-2024: 55%
Provide partners with labor market
information, hiring trends and wage
occupation data.
Engage in meaningful participation in
regional economic development
4. Strengthening Community activities.
Partnerships
Disseminate information regarding
funding opportunities for workforce
Strengthen partnerships with
training. 2020-2021: 1 TIP Grant
economic development corporations,
2021-2022: 1 Apprenticeship
chambers of commerce and other Leverage resources among all 2022-2023: 1 TIP Grant or HDJTG
business and community partners (i.e. Economic Development 2023-2024: 1 Apprenticeship
organizations to promote the region's Corporations (EDCs), private
economic prosperity by increasing businesses, TWC, education
the skills levels and earning power of institutions, foundations, and non-
the region's workforce. profit organizations) to achieve more
training opportunities through grants
such as skills development funds,
apprenticeships, Texas Industry
Partnership (TIP) program and High
Demand Job Training Program
(HDJTG).
Review Monthly Performance Report
(MPR) to evaluate each performance Address areas not meeting or at risk.
report on its own merit.
5. Performance Accountability Provide technical assistance to
Identify measures not meeting or are
contractors and assist in
at risk and correcting those negative
Meet or exceed all the measures set development of corrective action
trends before they impact
forth by the Texas Workforce plans.
performance.
Commission.
Review performance measures at Share Board feedback with
each Board meeting to discuss contractors.
ratings and actions.
4B. Board Strategies
(WIOA §108(b)(1)(F); 20 CFR §679.560(a)(6))
Boards must include a description of the Board’s strategy to work with the entities carrying out the
core programs and with the required partners to align resources available to the local workforce
development area (workforce area) to achieve the vision and goals.
Board Response:
The mission of Workforce Solutions Deep East Texas is to provide solutions for quality workforce
development. To accomplish this mission and early education services, Workforce Solutions Deep East
Texas is guided by the following principles:
The system will:
• be efficient and cost effective by integrating programs to eliminate duplication;
• offer services to meet the diverse needs of job seekers and employers;
• treat people with concern, dignity, respect, and courtesy; and
• require people to share responsibility for their outcomes.
The Board’s strategy to work with core partners to achieve its vision and goals is to ensure personal
contact with other key stakeholders involved in workforce development to form effective partnerships.
This is done through community involvement, joint projects, memorandums of understanding and
other avenues. In this way, Workforce Solutions Deep East Texas can better understand the offerings
of other organizations to avoid duplication of services and, more importantly, to expand the depth of
services that can be offered to job seekers and employers by working together.
C. High-Performing Board
(WIOA §108(b)(18); 20 CFR §679.560(b)(17))
Boards must include a description of the actions the Board will take toward becoming or remaining a
high-performing Board, consistent with the factors developed by the Texas Workforce Investment
Council (TWIC).
Board Response:
Staff monitor performance monthly. If a measure is at risk of not meeting it is reviewed and corrective
actions are discussed with the contractor. The consistent communication and working relationship
with the contractor are essential in developing best practices that lead to success in maintaining status
as a high performing Board.
The Texas Workforce Investment Council identifies these imperatives as the foundational elements of
its strategic plan: customer service and satisfaction, data driven program improvement, and
continuous improvement and innovation. The Board embraces these core elements in its strategy to
grow and sustain a competitive workforce that aligns with employer needs through integration and
partnerships.
• Performance monitored and reported monthly. Additional key metrics are tracked and
measured as outlined in this plan.
o Customer satisfaction (employers and job seekers)
o Key goals and objectives as outlined in this strategic plan
5o Workforce Performance Measures
• Corrective action and/or replication of best practices are implemented as appropriate.
• Annual professional development by Board members is encouraged, either through
participation in conferences or other training opportunities.
6Part 2. Economic and Workforce Analysis
A. Regional Economic and Employment Needs Analysis
(WIOA §108(b)(1)(A); 20 CFR §679.560(a)(1))
Boards must include a regional analysis of the following:
· The economic conditions, including existing and emerging in-demand industry sectors, in-
demand occupations, and target occupations
· The employment needs of employers in existing and emerging in-demand industry sectors, in-
demand occupations, and target occupations
Board Response:
Economic Conditions including existing and emerging in-demand industry sectors, in-demand
occupations, and target occupations
Through the work of the Board’s committees, engagement with education, industry and economic
development organizations, and local intelligence resources, the Board monitors regional economic
conditions and industry demand. The purpose of this regional analysis is to help focus workforce
development efforts that will effectively facilitate economic development in the region. It is also used to
determine jobs in demand, and occupations for which Workforce Innovation and Opportunity Act
(WIOA) funds may be used to assist eligible WIOA customers with training identified on the Targeted
Occupation List.
Indicators show that Deep East Texas has experienced flat to slight growth as of the year 2019. Annual
gross sales increased for the region by 3.2% during the period from 2013 to 2019, according to the
Texas Comptroller of Public Accounts. Additionally, the Real Gross Domestic Product for the region
was $13,418,080 in 2018, a growth of 4.5% from 2017. (Source: Bureau of Economic Analysis)
Based on the most current annual labor market data available, 2019, compared to the previous year:
• The labor force has increased by 0.4%
• The number employed has grown by 0.8%
• The number of unemployed fell by 7.4%
• The unemployment rate was down to 4.5%
In 2020, the coronavirus (COVID-19) pandemic greatly impacted the region’s economy. The region
experienced a significant number of business closings and employee furloughs or layoffs, including
double-digit unemployment rates. The long-term economic impact of the current coronavirus (COVID-
19) pandemic is uncertain, but there is no doubt it will challenge businesses to adapt to rapid
technology changes and safe working environments.
The workforce development area consists of twelve (12) rural counties with a labor force of 153,079,
encompassing 7,487 employers.
Over a ten (10) year period, the total number of private industry establishments increased overall by
11.6%, going from 6,303 in 2010 to 7,032 in 2020 for Deep East Texas. In the last two (2) years, this
change was a 3.7% increase. Employment in private industry grew by 5.4% overall in the past ten (10)
years in Deep East Texas.
7The four (4) industry sectors with over 10,000 employees are Trade, Transportation and Utilities;
Education and Health Services; Manufacturing; and Leisure and Hospitality. The largest ten (10) year
percent growth in employment was in the Financial Activities sector, followed by Natural Resources
and Mining. While Manufacturing showed a decrease in the number employed since 2010, the
industry’s employment number has grown over the last two (2) years.
Industries that are projecting growth or have large employment base with sustainable average wages
follows:
• Health Care and Social Assistance
During the first quarter of 2020, this sector’s average weekly wage overall was $714, which is
below the region’s average of $807. However, Ambulatory Health Care Services ($824) and
Hospitals ($1,138) average wages exceed the region’s average. An in-depth analysis of the
Hospital category reveals that General Medical and Surgical Hospitals is the highest wage at
$1,176, following by Outpatient Centers ($1,061) and Medical and Diagnostic Laboratories
($1,041).
• Manufacturing
This sector comprises private establishments producing products using machinery and skilled
labor. Manufacturing has shown a decline since 2006, but in the most recent two (2) years
there has been a 2.1% increase in establishments and 1.5% increase in employment since
2018. Wood and wood products manufacturing remains the largest category in both number of
establishments and employment. Fabricated Metal Product Manufacturing has the second most
establishments, and Food Manufacturing employers the second most workers. Average weekly
wage in this industry of $1,104 is well above the average of $807 for the region, and has
increased 2.89% in two (2) years. The East Texas Manufacturing Alliance, which has
membership of over sixty (60) manufacturing businesses, has described a gap between
experienced older workers who are nearing the end of their careers and younger, less prepared
and less skilled workforce. In the largest county in the region, Angelina, the economic
development corporation has attracted new and helped with the expansion of several
manufacturing businesses. The on-going meetings with the economic development partners
have provided insight that manufacturing companies are looking to move or expand their
current operations within the Deep East Texas region.
• Wholesale Trade
This sector comprises establishments engaged in wholesaling merchandise, generally without
transformation, and rendering services incidental to the sale of merchandise. The merchandise
described in this sector includes the outputs of agriculture, mining, manufacturing, and certain
information industries, such as publishing. More specific industries under these show a wide
variety of products - electronic markets and agents and brokers, merchant wholesalers for
motor vehicle and parts, lumber and construction supply, commercial equipment, metal and
mineral, electric goods, hardware and plumbing, miscellaneous durable goods, druggists'
goods, grocery and related products, farm product raw material, chemicals, petroleum, and
miscellaneous nondurable goods. The number of establishments and employed workers
increased over ten (10) years. The growth rate for all occupations in Wholesale Trade shows an
increase with Sales and Installation, Maintenance, and Repair Occupations projecting the
largest growth numbers. Wages are very good in this industry, with $1,176 as the average
weekly wage, well above the $807 area average, although they did drop from $1,198 in 2018.
• Transportation and Warehousing
This sector includes industries providing transportation of passengers and cargo, warehousing
and storage for goods, scenic and sightseeing transportation, and support activities related to
modes of transportation. Truck transportation is by far the largest employer in this sector with
8average weekly wages at $1,026, slightly below the sector average of $1,061 and well above the
region’s average wage of $807. Pipeline transportation wages are extremely high.
• Mining, Quarrying, and Oil and Gas Extraction
This sector comprises establishments that extract naturally occurring mineral solids, such as
coal and ores; liquid minerals, such as crude petroleum; and gases, such as natural gas. The
term mining is used in the broad sense to include quarrying, well operations, beneficiating (i.e.
crushing, screening, washing, and flotation), and other preparation customarily performed at
the mine site or as a part of mining activity. The number of establishments grew while
employment declined over the last two (2) years by over 5%. Wages overall increased by 2.86%
over the past two (2) years; however, wages in the largest employment sector, Support Activities,
fell 11.25%.
• Finance and Insurance
This sector comprises establishments primarily engaged in financial transactions (transactions
involving the creation, liquidation, or change in ownership of financial assets) and/or in
facilitating financial transactions. The average weekly wage is significantly above the region’s
average. Information obtained through job postings and employer surveys in this sector of
employers indicates the skills gap in the regional workforce, especially in the area of accounting.
• Utilities
This sector comprises establishments engaged in the provision of the following utility services:
electric power, natural gas, steam supply, water supply, and sewage removal. The number of
establishments remained constant. Employment grew by over 12% over ten (10) years, but fell
in the last two (2) years. Average weekly wages have grown significantly, 7.49% in the last two
(2) years. All occupations within the industry are projected to grow. Furthermore, during an
employer needs assessment conducted by the Board, utilities employers expressed they are
seeing growing demand for Electrical Power-Line Installers and Repairers.
• Construction
This sector comprises establishments primarily engaged in the construction of buildings or
engineering projects (i.e. highways and utility systems). Establishments primarily engaged in
the preparation of sites for new construction and establishments primarily engaged in
subdividing land for sale as building sites also are included in this sector. Construction work
done may include new work, additions, alterations, or maintenance and repairs. The number
of establishments has decreased while the overall number employed has increased over the
past two (2) years. Average construction wages are also well above average at $938, verses $807
average wage in the region.
9The following tables provides the list of in-demand industry sectors and occupations, as well as
targeted occupations.
Demand Industries
621 Ambulatory health care services
623 Nursing and residential care facilities
6221 General medical and surgical hospitals
311 Food manufacturing
321 Wood product manufacturing
332 Fabricated metal product manufacturing
423 Merchant wholesalers, durable goods
484 Truck transportation
213 Support activities for mining
522 Credit intermediation and related activities
221 Utilities
236 Construction of buildings
238 Specialty trade contractors
561 Administrative and support services
541 Professional and technical services
Demand Occupations
11-1021 General and Operations Managers
13-2011 Accountants and Auditors
15-1211 Computer Systems Analysts
15-1232 Computer User Support Specialists
15-1244 Network and Computer Systems Administrators
17-2112 Industrial Engineers
17-3000 Drafters, Engineering Technicians, and Mapping Technicians
17-3022 Civil Engineering Technicians
23-2011 Paralegals and Legal Assistants
25-2011 Preschool Teachers, Except Special Education
25-2031 Secondary School Teachers, Except Special and Career/Technical Education
29-1141 Registered Nurses
29-2000 Health Technologists and Technicians
29-2040 Emergency Medical Technicians and Paramedics
29-2052 Pharmacy Technicians
29-2055 Surgical Technologists
29-2061 Licensed Practical and Licensed Vocational Nurses
29-2098 Medical Dosimetrists, Medical Records Specialists, and Health Technologists and Technicians, All Other
31-1120 Home Health and Personal Care Aides
31-1131 Nursing Assistants
31-2021 Physical Therapist Assistants
31-9091 Dental Assistants
31-9092 Medical Assistants
33-2011 Firefighters
33-3012 Correctional Officers and Jailers
33-3051 Police and Sheriff's Patrol Officers
39-9011 Childcare Workers
43-3031 Bookkeeping, Accounting, and Auditing Clerks
43-4051 Customer Service Representatives
43-5061 Production, Planning, and Expediting Clerks
43-6000 Secretaries and Administrative Assistants
43-6013 Medical Secretaries
47-2073 Operating Engineers and Other Construction Equipment Operators
47-2111 Electricians
47-2152 Plumbers, Pipefitters, and Steamfitters
49-2000 Electrical and Electronic Equipment Mechanics, Installers, and Repairers
49-3023 Automotive Service Technicians and Mechanics
49-3031 Bus & Truck Mechanics & Diesel Engine Specialists
49-3042 Mobile Heavy Equipment Mechanics, Except Engines
49-9021 Heating, Air Conditioning, and Refrigeration Mechanics and Installers
49-9041 Industrial Machinery Mechanics
49-9043 Maintenance Workers, Machinery
49-9051 Electrical Power-Line Installers and Repairers
49-9071 Maintenance and Repair Workers, General
51-2028 Electrical, etc., assemblers, except coil winders, tapers, and finishers
51-2090 Miscellaneous Assemblers and Fabricators
51-4041 Machinists
51-4121 Welders, Cutters, Solderers, and Brazers
53-3032 Heavy and Tractor-Trailer Truck Drivers
53-7051 Excavating and Loading Machine and Dragline Operators
10Regional Employment Needs The needs of employers in the Demand Occupations are provided in the table below. The Demand Occupations were selected based on data analyzed from texas.lmi.com, Help Wanted Online, WorkInTexas, as well as local knowledge of industry employment trends and economic development activities. Technically, any occupation for which positive growth is projected is an occupation in demand. Demand occupation is defined by WIOA as one that is projected to have a number of positions great enough to have a significant impact on the state, regional, or local economy. Additionally, the Board considered local knowledge about the importance of an in-demand occupation in the workforce area and gained information from employer surveys and industry and economic development partners. To develop a list of occupations for general information for a wide variety of workers, certain categories were removed to keep the list manageable. The entire list of two hundred and twenty-one (221) occupations can be viewed at http://www.texaslmi.com. The complete list also shows annual data such as exits from workforce, transfers out of the occupation, change, and openings. 11
Deep East Texas Demand Occupations Regional Employment Needs
Named as
Estimated Projected Top 25 Need in
Change In Percentage Annual
SOC Code Occupation Title Employment Employment job Employer
Employment Change Openings
(2018) (2028) postings Needs
Assessment
31-1120 Home Health and Personal Care Aides 3,796 4,499 703 18.52 634 Y
43-6000 Secretaries and Administrative Assistants* 337,362 348,511 11,149 3.3 298 Y
29-2000 Health Technologists and Technicians 3,045 3,096 51 1.67 226
53-3032 Heavy and Tractor-Trailer Truck Drivers 2,383 2,648 265 11.12 312 Y Y
33-3012 Correctional Officers and Jailers 2,256 2,341 85 3.77 211
29-1141 Registered Nurses 2,183 2,198 15 0.69 119 Y
43-4051 Customer Service Representatives* 284,520 307,264 22,744 7.99 253 Y
31-1131 Nursing Assistants 1,784 1,864 80 4.48 212 Y Y
11-1021 General and Operations Managers 1,660 1,748 88 5.3 157 Y
25-2031 Secondary School Teachers, Except Special and Career/Technical Education* 109,180 121,135 11,955 10.95 91 Y
29-2061 Licensed Practical and Licensed Vocational Nurses 1,301 1,324 23 1.77 102 Y
49-9071 Maintenance and Repair Workers, General 1,291 1,319 28 2.17 130 Y
43-3031 Bookkeeping, Accounting, and Auditing Clerks* 143,878 152,300 8,422 5.85 132 Y
43-6013 Medical Secretaries 733 784 51 6.96 90
33-3051 Police and Sheriff's Patrol Officers 692 735 43 6.21 54
39-9011 Childcare Workers 639 653 14 2.19 98 Y
49-3023 Automotive Service Technicians and Mechanics* 60,441 65,328 4,887 8.09 61 Y
13-2011 Accountants and Auditors 553 628 75 13.56 63
31-9092 Medical Assistants 527 558 31 5.88 63 Y
51-4121 Welders, Cutters, Solderers, and Brazers 462 510 48 10.39 58
29-2040 Emergency Medical Technicians and Paramedics 357 395 38 10.64 29
47-2073 Operating Engineers and Other Construction Equipment Operators 367 394 27 7.36 47
17-3022 Civil Engineering Technicians 297 339 42 14.14 34
47-2111 Electricians 290 322 32 11.03 38 Y
33-2011 Firefighters 300 312 12 4 22
49-9021 Heating, Air Conditioning, and Refrigeration Mechanics and Installers 279 307 28 10.04 32 Y
31-9091 Dental Assistants 234 289 55 23.5 35
49-3042 Mobile Heavy Equipment Mechanics, Except Engines 247 285 38 15.38 30
49-9041 Industrial Machinery Mechanics 253 281 28 11.07 27
25-2011 Preschool Teachers, Except Special Education 270 279 9 3.33 29
47-2152 Plumbers, Pipefitters, and Steamfitters 229 275 46 20.09 33
49-3031 Bus & Truck Mechanics & Diesel Engine Specialists* 30,108 34,328 4,220 14.02 24 Y
29-2052 Pharmacy Technicians* 37,240 44,252 7,012 18.83 17 Y Y
15-1232 Computer User Support Specialists 218 230 12 5.5 19 Y
43-5061 Production, Planning, and Expediting Clerks 191 227 36 18.85 26 Y
49-9051 Electrical Power-Line Installers and Repairers 209 210 1 0.48 17 Y
53-7051 Excavating and Loading Machine and Dragline Operators 174 194 20 11.49 24
17-2112 Industrial Engineers 103 191 88 85.44 19
29-2098 Medical Dosimetrists, Medical Records Specialists, and Health Technologists and Technicians,
121 All Other 122 1 0.83 8
51-2090 Miscellaneous Assemblers and Fabricators 114 119 5 4.39 N/A
29-2055 Surgical Technologists * 10,520 12,005 1,485 14.12 7
17-3000 Drafters, Engineering Technicians, and Mapping Technicians 58 9 1 21 N/A
23-2011 Paralegals and Legal Assistants 5 5 0 4 N/A
49-9043 Maintenance Workers, Machinery 4 4 0 4 N/A
51-2028 Electrical, etc., assemblers, except coil winders, tapers, and finishers 1 1 0 6 N/A
49-2000 Electrical and Electronic Equipment Mechanics, Installers, and Repairers 0 0 0 10 N/A
51-4041 Machinists* 26,757 29,613 2,856 10.67 N/A
31-2021 Physical Therapist Assistants* 7,812 10,091 2,279 29.17 1,338
15-1211 Computer Systems Analysts* 54,102 62,744 8,642 15.97 5,083 Y
15-1244 Network and Computer Systems Administrators* 34,970 39,689 4,719 13.49 3,078 Y
* using state projections data
Source: Texaslmi.com Projections Report 2018-2028, https://lmci.state.tx.us/apps/hwol/index.asp Help Wanted Online, Workforce Solutions Deep East Texas Employer
Needs Assessment 2020
12Shown below are occupations in this area requiring a Masters or Doctoral Degree.
Demand Masters/PhD
SOC Code Occupation Title Estimated Projected Change In Percentage
Employment Employment Employment Change
(2018) (2028)
29-1127 Speech-Language Pathologists 102 115 13 12.75
29-1021 Dentists, General 72 84 12 16.67
29-1171 Nurse Practitioners 84 94 10 11.9
29-1071 Physician Assistants 66 75 9 13.64
29-1123 Physical Therapists 131 138 7 5.34
23-1011 Lawyers 98 105 7 7.14
21-1022 Healthcare Social Workers 101 105 4 3.96
21-1012 Educational, Guidance, School, and Vocational Counselors 252 255 3 1.19
25-4021 Librarians 118 121 3 2.54
19-3031 Clinical, Counseling, and School Psychologists 57 59 2 3.51
29-1122 Occupational Therapists 67 68 1 1.49
29-1069 Physicians and Surgeons, All Other 117 116 -1 -0.85
25-9031 Instructional Coordinators 84 83 -1 -1.19
29-1062 Family and General Practitioners 56 53 -3 -5.36
11-9032 Education Admin., Elementary & Secondary 434 427 -7 -1.61
29-1051 Pharmacists 130 113 -17 -13.08
Source: Texaslmi.com Projections Report 2018-2028,
The occupations that require no formal training but are growing are below. Demand is generally high
for these workers, but most of the demand is generally due to high turnover rates.
Require No Formal Educational Credential
SOC Code Occupation Title Estimated Projected Change In Percentage
Employment Employment Employment Change
(2018) (2028)
35-3021 Combined Food Preparation and Serving Workers, Including Fast Food 4,582 5,242 660 14.4
35-2014 Cooks, Restaurant 710 863 153 21.55
45-2092 Farmworkers and Laborers, Crop, Nursery, and Greenhouse 2,588 2,693 105 4.06
45-2093 Farmworkers, Farm, Ranch, and Aquacultural Animals 3,053 3,153 100 3.28
35-3031 Waiters and Waitresses 1,510 1,592 82 5.43
37-2011 Janitors and Cleaners, Except Maids and Housekeeping Cleaners 1,709 1,782 73 4.27
37-3011 Landscaping and Groundskeeping Workers 796 866 70 8.79
53-3041 Taxi Drivers and Chauffeurs 315 374 59 18.73
53-7062 Laborers and Freight, Stock, and Material Movers, Hand 998 1,032 34 3.41
35-9011 Dining Room and Cafeteria Attendants and Bartender Helpers 262 290 28 10.69
47-2061 Construction Laborers 721 749 28 3.88
53-7081 Refuse and Recyclable Material Collectors 147 165 18 12.24
37-2012 Maids and Housekeeping Cleaners 905 917 12 1.33
39-3091 Amusement and Recreation Attendants 183 193 10 5.46
35-3011 Bartenders 197 206 9 4.57
47-3019 Helpers, Construction Trades, All Other 57 65 8 14.04
51-6011 Laundry and Dry-Cleaning Workers 158 166 8 5.06
35-9021 Dishwashers 276 283 7 2.54
35-2021 Food Preparation Workers 356 357 1 0.28
53-7051 Industrial Truck and Tractor Operators 585 585 0 0
47-2051 Cement Masons and Concrete Finishers 91 88 -3 -3.3
41-2031 Retail Salespersons 3,248 3,244 -4 -0.12
53-7061 Cleaners of Vehicles and Equipment 195 190 -5 -2.56
47-2141 Painters, Construction and Maintenance 209 202 -7 -3.35
35-2012 Cooks, Institution and Cafeteria 522 514 -8 -1.53
53-7064 Packers and Packagers, Hand 491 470 -21 -4.28
53-6031 Automotive and Watercraft Service Attendants 241 213 -28 -11.62
41-2021 Counter and Rental Clerks 446 409 -37 -8.3
45-2041 Graders and Sorters, Agricultural Products 332 290 -42 -12.65
35-2011 Cooks, Fast Food 547 499 -48 -8.78
41-2011 Cashiers 3,489 3,238 -251 -7.19
Source: Texaslmi.com Projections Report 2018-2028
13Another way to determine what jobs are in demand is to review job postings on WorkInTexas, Jobs
Now, Indeed and other employment sites. The following is a list produced by an application called Help
Wanted Online, showing positions that were advertised, either in newspapers or on-line, for jobs in
this area for a twelve (12) month period. Over the past two (2) years, top occupations posted have
included the following:
Top 25 Occupations by Help Wanted Postings
Between January 2019 and October 2020
for the Deep East Texas WDA
Rank SOC SOC Title Postings
1 29-1141 Registered Nurses 3,572
2 41-1011 First-Line Supervis./Managers of Retail Sales Work 2,882
3 43-4051 Customer Service Representatives 2,002
4 53-3032 Truck Drivers, Heavy and Tractor-Trailer 1,743
5 41-2031 Retail Salespersons 1,614
6 31-1014 Nursing Assistants 890
7 35-3021 Combined Food Preparation and Serving Workers, Including Fast Food 862
8 39-9021 Personal Care Aides 821
9 29-2061 Licensed Practical and Licensed Vocational Nurses 759
10 49-9071 Maintenance and Repair Workers, General 745
11 35-1012 First-Line Supervisors/Managers of Food Preparatio 709
12 51-1011 First-Line Supervisors/Managers of Production and 705
13 43-5081 Stock Clerks and Order Fillers 627
14 37-2011 Janitors and Cleaners, Except Maids and Housekeeping Cleaners 626
15 41-2011 Cashiers 599
16 27-1026 Merchandise Displayers and Window Trimmers 548
17 11-9051 Food Service Managers 525
18 11-9111 Medical and Health Services Managers 495
19 29-2052 Pharmacy Technicians 487
20 29-2041 Emergency Medical Technicians and Paramedics 487
21 41-4012 Sales Rep., Wholesale & Manufacturing, Except Tech. & Scientific Products 464
22 35-2014 Cooks, Restaurant 459
23 53-3033 Light Truck or Delivery Services Drivers 443
24 31-9092 Medical Assistants 414
25 29-1123 Physical Therapists 402
Total 23,880
(Source: Texas Labor Market Information (TXLMI), 2019-2020)
B. Knowledge and Skills Analysis
(WIOA §108(b)(1)(B); 20 CFR §679.560(a)(2))
Boards must include an analysis of the knowledge and skills needed to meet the employment needs of
the employers in the region, including employment needs for in-demand industry sectors, in-demand
occupations, and target occupations.
Board Response:
The table below describes the knowledge and skills needed for some of the Demand Occupations, as
obtained from TexasCareerCheck.com, O*NET, BLS (Bureau of Labor Statistics), OOH (Occupational
Outlook Handbook), and Career One Stop.
14SOC Code/Occupation Title Knowledge Needed Skills Needed
-Equipment Selection and Maintenance
-Computers and Electronics
49-3023, Automotive Service Technicians -Quality Control Analysis
-Engineering and Technology
and Mechanics -Repairing
-Mechanical
-Troubleshooting
-Troubleshooting
-Mechanical -Repairing
49-3031, Bus and Truck Mechanics and
-Transportation -Operation Monitoring
Diesel Engine Specialists
-Customer and Personal Service -Operation and Control
-Equipment Maintenance
-Public Safety and Security -Active Listening
-Law and Government -Speaking
33-3012, Correctional Officers and
-Psychology -Social Perceptiveness
Jailers
-English Language -Critical Thinking
-Computers and Electronics -Monitoring
-Mechanical -Active Listening
-Customer and Personal Service -Monitoring
49-9051, Electrical Power-Line Installers
-Physics -Critical Thinking
and Repairers
-English Language -Troubleshooting
-Mathematics -Operation Monitoring
-Equipment Maintenance
-Engineering and Technology -Installation
49-9021, Heating, Air Conditioning, and
-Mathematics and Science -Operation Monitoring
Refrigeration Mechanics and Installers
-Repairing
-Troubleshooting
-Operation and Control
-Transportation
53-3032, Heavy and Tractor-Trailer Truck -Operation Monitoring
-Public Safety and Security
Drivers -Time Management
-Customer and Personal Service
-Troubleshooting
-Customer and Personal Service -Active Listening
-English Language -Service Orientation
31-1011, Home Health Aides -Psychology -Social Perceptiveness
-Public Safety and Security -Critical Thinking
-Administration and Management -Reading Comprehension
-Mechanical -Equipment Maintenance
-Engineering and Technology -Repairing
49-9041, Industrial Machinery Mechanics
-Production and Processing -Operation Monitoring
-Mathematics -Troubleshooting
-Medical and Dentistry -Service Orientation
-Customer and Personal Service -Reading Comprehension
29-2061, Licensed Practical and Licensed
-Psychology -Active Listening
Vocational Nurses
-English Language -Speaking
-Therapy and Counseling -Monitoring
-Mechanical -Equipment Maintenance
-Building and Construction -Repairing
49-9071, Maintenance and Repair
-Customer and Personal Service -Troubleshooting
Workers, General
-Public Safety and Security -Operation Monitoring
-English Language -Operation and Control
-Customer and Personal Service -Speaking
-Medical and Dentistry -Reading Comphrensive
31-9092, Medical Assistants -English Language -Active Listening
-Clerical -Social Listening
-Computer and Electronics -Monitoring
-Medical and Dentistry -Active Listening
-Customer and Personal Service -Social Perceptiveness
29-1141, Registered Nurses -Psychology -Service Orientation
-English Language -Speaking
-Therapy and Counseling -Critical Thinking
-Education and Training -Learning Strategies
25-2031, Secondary School Teachers, -English Language -Instructing
Except Special and Career/Technical -Psychology -Speaking
Education -Computers and Electronics -Active Listening
-Mathematics -Critical Thinking
-Writing
43-6014, Secretaries and Administrative -Clerical -Speaking
Assistants, Except Legal, Medical, and -English Language -Reading Comprehension
Executive -Customer and Personal Service -Active Listening
-Time Management
-Engineering and Technology -Operation Monitoring
51-4121, Welders, Cutters, Solderers,
-Manufacturing and Production -Operation and Control
and Brazers
-Mathematics and Science -Quality Control Analysis
15C. Labor Force Analysis and Trends
(WIOA §108(b)(1)(C); 20 CFR §679.560(a)(3))
Boards must include an analysis of the regional workforce, including current labor force employment
and unemployment data, information on labor market trends, and educational and skill levels of the
workforce, including individuals with barriers to employment.
Board Response:
Labor Force Employment
In 2018, persons ages sixteen (16) years and older were 79.7% of the area population, compared to
76.7% statewide. This is the population generally considered to participate in the labor market. The
labor force participation rate for the area is 51.9%, compared to the state rate of 64.6% The labor force
participation rate for the group of twenty-five (25) to forty-four (44)-year olds is a smaller percentage
of the population than the state (22.6% /28.2%), which may indicate that this age group moves out of
the area for job opportunities. As job opportunities increase, it can be anticipated that group would
have a higher workforce participation rate. (Source: Census, 2018)
A comparison of the Class of Worker between 2015 and 2018 indicates an increase of private wage and
salary workers for both the region and state, a decrease in government workers both locally and for
the state, a slight increase in self-employed and no change for the unpaid family workers. (Census
2015 and 2018)
Deep East Deep East
Class of Worker Difference Texas 2015 Texas 2018 Difference
Texas 2015 Texas 2018
Civilian employed population 16 years and over 142,448 145,540 3,092 12,094,262 12,985,624 891,362
Private wage and salary workers 73.5% 75.0% 1.5% 79.4% 80.1% 0.7%
Government workers 19.0% 17.3% -1.7% 13.8% 13.0% -0.8%
Self-employed in own not incorporated business workers 7.3% 7.6% 0.2% 6.6% 6.7% 0.1%
Unpaid family workers 0.2% 0.2% 0.0% 0.2% 0.2% 0.0%
Class of Worker (Source: Census, 2015 and 2018)
In 2018, of those commuting to work of the civilian labor force sixteen (16) years and older (local/state),
most drove a personal vehicle alone (81.3% / 80.6%) or carpooled (11.4% / 10.2%), very few used
limited public transportation (0.2% / 1.4%) or walked/used other means (3.8% / 3.1%). The mean
commuting time was twenty-seven (27) minutes for the area, twenty-six (26) for the state. There was a
large variation in time for the counties within the area: nineteen (19) minutes for Angelina County and
forty (40) minutes for both Newton and San Jacinto Counties. (Source: Census, 2018)
According to the chart below, for the five (5) year period between 2015 and 2019, growth continued in
the Deep East Texas region in average weekly wages and the number of establishments. Average
employment fell slightly in the area but showed growth for Texas. (Source: QCEW, Qtr.1, All Industries)
Deep East Texas Texas
2015 2019 Difference 2015 2019 Difference
Establishment 7,130 7,595 6.5% 632,090 708,796 12.1%
Average Employment 108,491 107,943 -0.5% 11,514,604 12,422,282 7.9%
Average Weekly Wage $679 $770 13.3% $1,089 $1,203 10.5%
16On The Map data for 2017 shows the following worker demographics:
Work Area Profile Report Deep East Texas 2017 Texas 2017
Count Share Count Share
Total Primary Jobs 95,409 100.0% 11,060,278 100.0%
Jobs by Worker Age Count Share Count Share
Age 29 or younger 22,245 23.3% 2,643,271 23.9%
Age 30 to 54 49,849 52.2% 6,073,623 54.9%
Age 55 or older 23,315 24.4% 2,343,384 21.2%
Jobs by Worker Sex Count Share Count Share
Male 44,559 46.7% 5,698,718 51.5%
Female 50,850 53.3% 5,361,560 48.5%
Jobs by Worker Race Count Share Count Share
White Alone 74,447 78.0% 8,737,237 79.0%
Black or African American Alone 17,461 18.3% 1,471,711 13.3%
American Indian or Alaska Native Alone 869 0.9% 92,658 0.8%
Asian Alone 1,584 1.7% 588,629 5.3%
Native Hawaiian or Other Pacific Islander Alone 78 0.1% 16,298 0.1%
Two or More Race Groups 970 1.0% 153,745 1.4%
Jobs by Worker Ethnicity Count Share Count Share
Not Hispanic or Latino 80,335 84.2% 7,422,442 67.1%
Hispanic or Latino 15,074 15.8% 3,637,836 32.9%
Jobs by Worker Educational Attainment Count Share Count Share
Less than high school 12,591 13.2% 1,533,533 13.9%
High school or equivalent, no college 22,429 23.5% 2,168,054 19.6%
Some college or Associate degree 24,015 25.2% 2,641,431 23.9%
Bachelor's degree or advanced degree 14,129 14.8% 2,073,989 18.8%
Educational attainment not available (workers aged 29 or
22,245 23.3% 2,643,271 23.9%
younger)
Unemployment Data
The most significant external event during the five (5) year planning period covered in this strategic
plan will be the recovery from the impact of the COVID-19 pandemic. The impact of this disease and
the scale of the resultant shutdown created dramatic disruptions to the economy, resulting in a
massive increase in demand for unemployment insurance benefits, seriously straining systems
designed for more historic emergencies like natural disasters.
An unprecedented challenge that arose in 2020 was the COVID-19 pandemic and the impact that it
had on the state’s and the region’s job markets. As COVID-19 spread in March 2020, businesses across
Texas and the nation reduced or eliminated jobs. What resulted was massive increase in the number
of unemployment claims.
While the full impact of COVID-19 is not yet known, it is evident that some workers will not return to
their last position. TWC and the Workforce Board are devoting resources to upskilling as many Texans
as possible in occupations anticipated to be in highest demand during and after COVID-19. We will
continue to pursue disaster funds in addition to using available WIOA, Temporary Assistance for Needy
Families (TANF) and other funding sources to provide funds for training the unemployed for demand
jobs. Close ties to the local labor market enable the Board and Vocational Rehabilitation (VR) to
17conduct outreach by working with businesses to provide opportunities for work experience and on-
the-job training (OJT) and also allow low-skilled workers to build skill sets relevant to the current
market. The Skills Development Fund and other state-directed programs provide resources for
upskilling current workers in new
technologies. Additionally, the
Workforce Board is well positioned
to work with other community
partners, such as economic
development organizations, to
expand opportunities to all
customers.
In 2019, the Unemployment Rate
has continued to decline from
recession highs in 2009 and 2010
of almost 10% for the U.S. and
Deep East Texas area. Deep East
Texas rates continue to be higher
than both Texas and the U.S.
(Source: Local Area Unemployment Statistics (LAUS), 2010-2019)
Per capita personal income in 2018 was $37,134 (Deep East Texas) compared to $50,355 (Texas), a
growth rate from 2017 of 4.8% and 5.1% respectively. (Source: BEA)
The percentage of all families living below the poverty level in 2018 averaged 14.7% in the region, 11.9%
in Texas. (Source: Census, 2018)
Below Poverty
Level
Geographic Area
Percentage of
All People
Houston County, Texas 24.7%
Nacogdoches County, Texas 24.4%
San Augustine County, Texas 24.0%
Shelby County, Texas 23.3%
Sabine County, Texas 21.4%
Newton County, Texas 20.6%
Angelina County, Texas 18.3%
Polk County, Texas 17.3%
Jasper County, Texas 16.7%
Trinity County, Texas 16.1%
State of Texas 15.5%
San Jacinto County, Texas 14.9%
Tyler County, Texas 14.9%
(Source: Census, 2018)
18All Government transfer payments (Food Stamps/SNAP, Cash Public Assistance Income and
Supplemental Security Income) for the region and the state have decreased in the three (3) year period
from 2015 to 2018. The table below shows the percentage of households receiving such benefits:
(Source: Census, 2015 and 2018)
Labor Market Trends
Deep East Tex as 2017 Tex as 2017
Jobs by Earnings Count Share Count Share
$1,250 per month or less 22,571 23.7% 2,038,498 18.4%
$1,251 to $3,333 per month 39,090 41.0% 3,699,818 33.5%
More than $3,333 per month 33,748 35.4% 5,321,962 48.1%
Jobs by NAICS Industry Sector Count Share Count Share
Agriculture, Forestry, Fishing and Hunting 1,747 1.8% 56,555 0.5%
Mining, Quarrying, and Oil and Gas Extraction 584 0.6% 213,199 1.9%
Utilities 961 1.0% 79,289 0.7%
Construction 4,770 5.0% 713,534 6.5%
Manufacturing 12,744 13.4% 838,932 7.6%
Wholesale Trade 2,889 3.0% 570,929 5.2%
Retail Trade 12,140 12.7% 1,229,307 11.1%
Transportation and Warehousing 2,396 2.5% 464,546 4.2%
Information 729 0.8% 201,056 1.8%
Finance and Insurance 2,760 2.9% 518,153 4.7%
Real Estate and Rental and Leasing 1,002 1.1% 207,514 1.9%
Professional, Scientific, and Technical Services 2,086 2.2% 729,454 6.6%
Management of Companies and Enterprises 865 0.9% 129,373 1.2%
Administration & Support, Waste Management and
3,835 4.0% 722,537 6.5%
Remediation
Educational Services 12,810 13.4% 1,173,214 10.6%
Health Care and Social Assistance 16,646 17.4% 1,430,324 12.9%
Arts, Entertainment, and Recreation 719 0.8% 138,276 1.3%
Accommodation and Food Services 8,089 8.5% 1,008,261 9.1%
Other Services (excluding Public Administration) 2,033 2.1% 301,929 2.7%
Public Administration 5,604 5.9% 333,896 3.0%
(Source: On The Map 2017)
19Inflow and Outflow characteristics are shown in the chart below:
Labor Market (Primary Jobs) Deep East Texas Texas
2012 2017 2012 2017
Within Area Characteristics (Primary Jobs) Count Share Count Share Count Share Count Share
Employed in the Selection Area 97,432 100.0% 95,409 100.0% 9,952,892 100.0% 11,060,278 100.0%
Living in the Selection Area 125,350 128.7% 121,153 127.0% 9,931,990 99.8% 11,050,995 99.9%
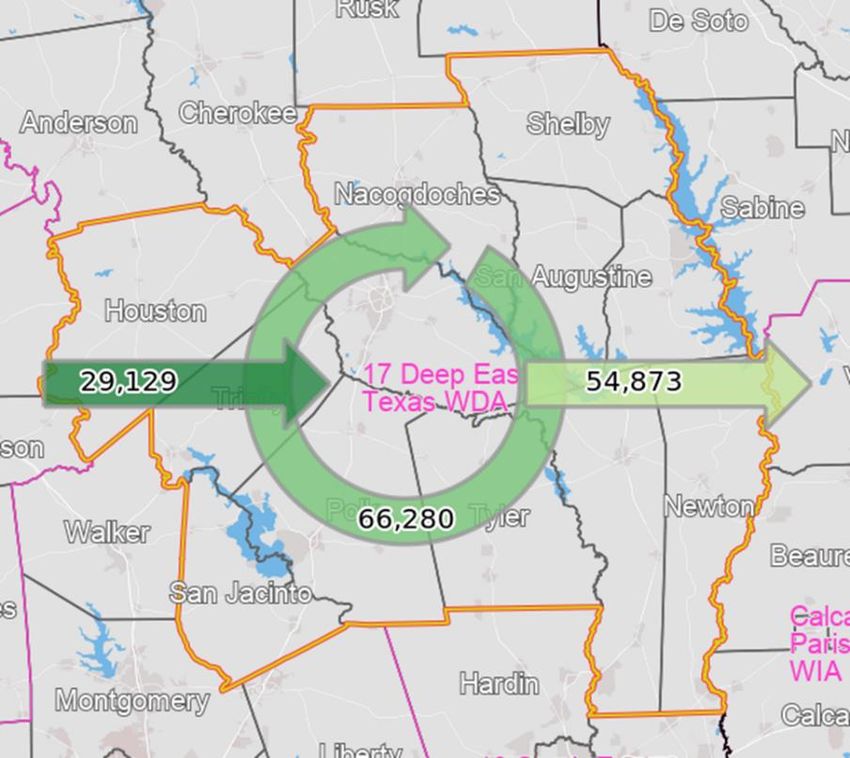
Living and Employed in the Selection Area 69,170 55.2% 66,280 54.7% 9,813,135 98.8% 10,895,661 98.6%
Living in the Selection Area but Employed Outside 56,180 44.8% 54,873 45.3% 118,855 1.2% 155,334 1.4%
Employed in the Selection Area but Living Outside 28,262 29.0% 29,129 30.5% 139,757 1.4% 164,617 1.5%
Net Job Inflow (+) or Outflow (-) -27,918 - -25,744 - 20,902 - 9,283 -
Interior Flow Job Characteristics (Primary Jobs) Count Share Count Share Count Share Count Share
Internal Jobs Filled by Residents 69,170 100.0% 66,280 100.0% 9,813,135 100.0% 10,895,661 100.0%
Workers Aged 29 or younger 14,491 20.9% 14,311 21.6% 2,288,000 23.3% 2,599,595 23.9%
Workers Aged 30 to 54 38,770 56.1% 35,120 53.0% 5,620,350 57.3% 5,989,235 55.0%
Workers Aged 55 or older 15,909 23.0% 16,849 25.4% 1,904,785 19.4% 2,306,831 21.2%
Workers Earning $1,250 per month or less 16,486 23.8% 15,138 22.8% 1,978,154 20.2% 2,004,788 18.4%
Workers Earning $1,251 to $3,333 per month 30,893 44.7% 27,991 42.2% 3,591,474 36.6% 3,641,198 33.4%
Workers Earning More than $3,333 per month 21,791 31.5% 23,151 34.9% 4,243,507 43.2% 5,249,675 48.2%
Workers in the "Goods Producing" Industry Class 16,798 24.3% 14,392 21.7% 1,699,992 17.3% 1,777,729 16.3%
Workers in the "Trade, Transportation, and Utilities" Industry
10,490 15.2% 10,486 15.8% 2,064,778 21.0% 2,307,502 21.2%
Class
Workers in the "All Other Services" Industry Class 41,882 60.5% 41,402 62.5% 6,048,365 61.6% 6,810,430 62.5%
Outflow Job Characteristics (Primary Jobs) Count Share Count Share Count Share Count Share
External Jobs Filled by Residents 56,180 100.0% 54,873 100.0% 118,855 100.0% 155,334 100.0%
Workers Aged 29 or younger 13,264 23.6% 14,257 26.0% 32,537 27.4% 40,808 26.3%
Workers Aged 30 to 54 30,552 54.4% 28,101 51.2% 62,072 52.2% 80,626 51.9%
Workers Aged 55 or older 12,364 22.0% 12,515 22.8% 24,246 20.4% 33,900 21.8%
Workers Earning $1,250 per month or less 12,253 21.8% 11,032 20.1% 28,928 24.3% 31,912 20.5%
Workers Earning $1,251 to $3,333 per month 21,301 37.9% 19,367 35.3% 49,874 42.0% 59,240 38.1%
Workers Earning More than $3,333 per month 22,626 40.3% 24,474 44.6% 40,053 33.7% 64,182 41.3%
Workers in the "Goods Producing" Industry Class 14,276 25.4% 13,644 24.9% 34,813 29.3% 50,055 32.2%
Workers in the "Trade, Transportation, and Utilities" Industry
13,537 24.1% 13,794 25.1% 25,302 21.3% 30,471 19.6%
Class
Workers in the "All Other Services" Industry Class 28,367 50.5% 27,435 50.0% 58,740 49.4% 74,808 48.2%
Inflow Job Characteristics (Primary Jobs) Count Share Count Share Count Share Count Share
Internal Jobs Filled by Outside Workers 28,262 100.0% 29,129 100.0% 139,757 100.0% 164,617 100.0%
Workers Aged 29 or younger 7,887 27.9% 7,934 27.2% 38,653 27.7% 43,676 26.5%
Workers Aged 30 to 54 14,752 52.2% 14,729 50.6% 71,851 51.4% 84,388 51.3%
Workers Aged 55 or older 5,623 19.9% 6,466 22.2% 29,253 20.9% 36,553 22.2%
Workers Earning $1,250 per month or less 7,921 28.0% 7,433 25.5% 31,910 22.8% 33,710 20.5%
Workers Earning $1,251 to $3,333 per month 11,610 41.1% 11,099 38.1% 53,202 38.1% 58,620 35.6%
Workers Earning More than $3,333 per month 8,731 30.9% 10,597 36.4% 54,645 39.1% 72,287 43.9%
Workers in the "Goods Producing" Industry Class 6,185 21.9% 5,453 18.7% 41,465 29.7% 44,491 27.0%
Workers in the "Trade, Transportation, and Utilities" Industry
7,554 26.7% 7,900 27.1% 30,097 21.5% 36,569 22.2%
Class
Workers in the "All Other Services" Industry Class 14,523 51.4% 15,776 54.2% 68,195 48.8% 83,557 50.8%
(Source: On The Map, 2012 and 2017)
20Commuting Patterns In and Out of Workforce Development Area
(Source: On The Map, 2017)
Commuting patterns indicate where people live and travel to work. Within the area, the largest percent
of persons live and work in Angelina and Nacogdoches counties.
Deep East Texas Total Primary Jobs Deep East Texas Total Primary Jobs
2017 2017
Count Share Count Share
Total Primary Jobs 121,153 100.0% Total Primary Jobs 95,409 100.0%
Jobs Counts by Counties Where Workers are Jobs Counts by Counties Where Workers Live -
Employed - Primary Jobs Primary Jobs
2017 2017
Count Share Count Share
Angelina County, TX 24,144 19.9% Angelina County, TX 21,941 23.0%
Nacogdoches County, TX 14,665 12.1% Nacogdoches County, TX 14,459 15.2%
Harris County, TX 13,288 11.0% Polk County, TX 6,375 6.7%
Polk County, TX 6,850 5.7% Jasper County, TX 5,157 5.4%
Jasper County, TX 5,576 4.6% Shelby County, TX 5,148 5.4%
Shelby County, TX 5,139 4.2% Harris County, TX 3,636 3.8%
Jefferson County, TX 4,514 3.7% Houston County, TX 3,006 3.2%
Montgomery County, TX 3,363 2.8% Tyler County, TX 2,309 2.4%
Dallas County, TX 3,152 2.6% Trinity County, TX 1,703 1.8%
Walker County, TX 3,020 2.5% San Augustine County, TX 1,656 1.7%
All Other Locations 37,442 30.9% All Other Locations 30,019 31.5%
(Source: On The Map, 2017)
21Industry
Understanding the industry make-up of the region is vital to understanding the needs of local
businesses and how workforce development efforts can best be provided.
General Business Information
Businesses are classified in several ways. One way is to look at the size by number of employees. The
vast majority of the employment in the region is in establishments with less than ten (10) employees.
Establishments with less than one hundred (100) employees in rural areas is and will be the drivers
of the regional economy. Establishments with over one hundred (100) employees are decreasing in the
region, while all other businesses with fifty (50) – ninety-nine (99) employees are growing. Companies
with a larger number of employees have either closed or reduced staff due to technology or decreased
demand for their products since 2011.
Deep East Texas Texas
Number of Number of Number of Number of
Employment size of establishments establishments establishments Difference establishments establishments Difference
2015 2018 2015 2018
Establishments with 1 to 4 employees 3,303 3,356 1.6% 292,005 310,446 6.3%
Establishments with 5 to 9 employees 1,368 1,372 0.3% 107,959 111,465 3.2%
Establishments with 10 to 19 employees 892 874 -2.0% 76,284 80,678 5.8%
Establishments with 20 to 49 employees 574 559 -2.6% 57,228 60,696 6.1%
Establishments with 50 to 99 employees 169 174 3.0% 19,491 20,774 6.6%
Establishments with 100+ employees 100 77 -23.0% 16,124 16,688 3.5%
All establishments 6,406 6,412 0.1% 569,091 600,747 5.6%
(Source: Census, 2015 and 2018)
Education and Skill Levels
The percent of those enrolled in college or graduate school in 2018 in the area is lower than the state
percentage (22.3% / 24.3%). (Source: Census, 2018)
Compared to the state, a higher percentage of the population in the region achieved no more than a
high school graduation; see chart below:
(Source data: Census, 2015 and 2018)
Workforce Barriers
The 2018 disabled population is larger in Deep East Texas (20.0% / 11.5%), with the percentage of
those working (8.5% / 5.2%). This is a slight change from 2013 data (8.5% / 5.3%). (Source: Census,
2018 and 2013)
Workforce activities in the area are designed to address the barriers to employment that include limited
rural transportation, lack of post-secondary education entities, disabilities, limited child care or
22You can also read


