Working Capital Management at TVS Motors, Bidar - IRE Journal
←
→
Page content transcription
If your browser does not render page correctly, please read the page content below

© JUN 2021 | IRE Journals | Volume 4 Issue 12 | ISSN: 2456-8880

     Working Capital Management at TVS Motors, Bidar
                                  BHADRAPPA HARALAYYA
     HOD and Associate Professor, Department of MBA, Lingaraj Appa Engineering College, Bidar

Abstract- The working capital management is                more exclusively under private movement inside the
concerned with the problems that arise in attempting       guidelines and targets lay out by the Five-Year Plans.
to manage the current assets, the current liabilities
and the interrelationship between them. The current        1.1 WORKING CAPITAL MANAGEMENT
assets are those assets which are in the ordinary
course of the business can be converted in to cash         MEANING OF WORKING CAPITAL:
within a year without undergoing a diminution in           Funds which are needed for short term purposes are
value. The current assets are cash in hand, cash at        known as working capital. In simple words, working
bank, sundry debtors, bills receivable, stock, prepaid     capital refers to that part of firm’s capital, which is
expenses etc. The current liabilities are those            required for financing short term or current assets such
liabilities which are paid in the ordinary course of the   as cash, marketable securities, debtors and inventories.
business within a year out of the current assets or        Funds thus vested in current assets keep revolving fast
earning of the firm. The current liabilities are sundry    and are being constantly converted into cash and this
creditors, bills payable, and bank overdraft.              cash flow out again in exchange for other current
Outstanding expenses etc. The goal of the working          assets. Hence, it is also known as revolving,
capital management is to manage the firm’s current         circulating capital or short-term capital.
assets and current liabilities in such a way of working
capital is maintained. The basic ingredient of the         DEFINITION OF WORKING CAPITAL:
theory of working capital management includes the          According to Shubin, working capital is the amount of
optimum level of the current assets, the trade-off         funds necessary to cover the cost of operating the
between profitability and risk which is associated         enterprise.”
with the level of the current assets and current           According to Genestenberg. Circulating capital means
liabilities, financing-mix strategies                      current assets of a company that are changed in the
                                                           ordinary course of business from one form to another.
              I.     INTRODUCTION                          As for example. From cash to investors, investors to
                                                           receivables, receivable into cash.”
The extension in offers of this industry is proof of its
high improvement. In 1971 arrangements were around         DIFFERENT TYPES OF WORKING CAPITAL
0.1 million units for every year. In any case, in 1998     1. Gross working capital:
this figure had climb to 3 million units for every year.   Gross working capital refers to the total investments in
So additionally points of confinement of age in like       the current assets such as cash in hand, inventories,
manner extended from around 0.2 million units of           accounts receivable, etc. it is also known as total
yearly breaking point in the seventies to more than 4      current assets.
million units in the late nineties. The Two wheeler
industry was start in India tasks inside the system of     2. Net working capital:
the national mechanical approach as embrace by the         Net working capital means net current assets i.e., the
Industrial Policy Resolution of 1956. This decision        excess of current assets over liabilities. It is for this
divided the entire mechanical section into three social    reason that networking capital is also known as net
events of which one contained by wanders whose             current assets. Also working capital is generally, used
change was the more specific commitment of the State       for net working capital
another joined those organizations in both the State
and the private division could take an intrigue and the
last game plan of endeavors that could be made by

 IRE 1702800               ICONIC RESEARCH AND ENGINEERING JOURNALS                                           255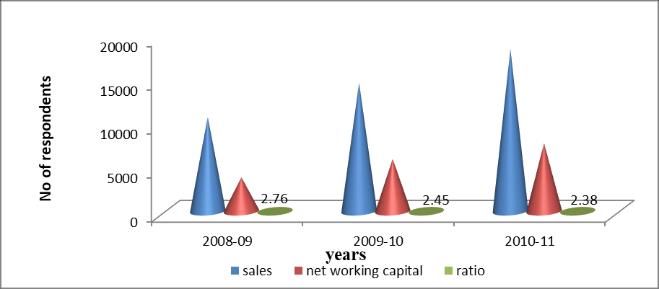
© JUN 2021 | IRE Journals | Volume 4 Issue 12 | ISSN: 2456-8880

3. Negative working capital                                 Current Liabilities
Negative working capital or working capital deficit         Current liabilities include all the obligations of the
means the excess of current liabilities over the current    concern that are maturing within an accounting year.
assets. Negative working capital is an indication of        Components of current liabilities are-
some crisis to the firm.                                    • Sundry creditors
                                                            • Loans from bank and others
4. Permanent or fixed working capital                       • Provisions for taxation, divided
Permanent or fixed working capital refers to the            • Liabilities towards gratuity,
amount of investments in current assets required            • Outstanding expenses
throughout the year for carrying out the business           • Incomes received in advance
operation. It is the amount of working capital which
remains in the business permanently. This is also                      II.     LITERETURE REVIEW
known as core current assets.
                                                            1. Nufazil Altaf And Farooq Ahmed Shah (2018):
5. Temporary working capital                                found that how does working capital management
Temporary, variable or fluctuating working capital          affect the profitability of india companies, the purpose
refers to the amount of working capital which goes on       of this paper is to examine the relationship between
fluctuating or changing from time to time with the          working capital management (WCM) and firm
change in the change in the volume of business              profitability for a sample of 437 nonfinancial Indian
activities. It is the additional working capital which is   companies. the study based on secondary financial
required for financing he increase in additional            data obtained from capital database pertaining to a
working capital which is required for financing the         period of ten years this study employer’s two-step
increase in the volume of business operations at            generalized methods of moments (GMM) technique to
different times during the operating year. Some returns     arrives at results. the result of the study confirms the
can be expected on the temporary working capital            inverted U-shape relationship between WCM and firm
during the off season when it is not required by the        profitability.in addition complete its CCC on an
firm.                                                       average by 63 days.

In other words any amount over and above the                2. Mr Shivakumar And Dr N Babitha Thimmaiah
permanent level of working capital is called as                 (2016):
temporary working capital.                                  in their paper titled working capital management its
                                                            impact on liquidity and profitability a study of coal
COMPONENTS OF WORKING CAPITA:                               india ltd makes an attempt to give a conceptual insight
Current Assets                                              on working capital management and assess its impact
Current assets are those assets, which in the normal        on liquidity and profitability of coal india ltd the
course of business convertible into cash within a short     liquidity and profitability trade of has becomes an
period of time i.e., an accounting year (or operating       important aspect for all the organization the attempt
cycle). Components of Current Assets:                       also has been made to test the liquidity and
• Stock of materials in trade and in transit                profitability position by using correlation and
• Stores and spare parts                                    spearman’s rank method the correlation speart man
• Sundry debtors                                            ranking method indicates weak correlation and
• Bills of exchange                                         negative relationship between liquidity and
• Loans and advances                                        profitability the total’s test has also been applied to test
• Deposits                                                  the liquidity performance.
• Cash and bank balance
• Prepaid expenses                                          3. Mukti R Barot (2016):
• Outstanding incomes.                                      In this study the researcher tried to carry out a
                                                            comparative analysis on working capital management

 IRE 1702800                ICONIC RESEARCH AND ENGINEERING JOURNALS                                              256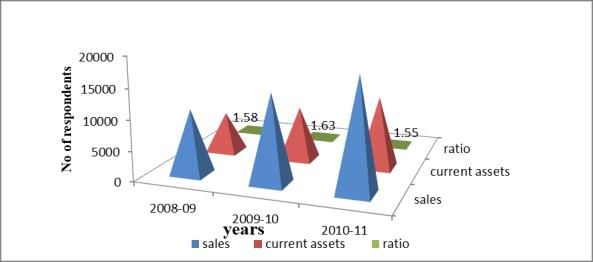
© JUN 2021 | IRE Journals | Volume 4 Issue 12 | ISSN: 2456-8880

of reymond and vardhman textile limited the aim of           and have come to the conclusion that the existing
this study is to analyse which companies performance         system of working capital management was not up to
is better than other company for this analysis               the mark needed to be improved.
researcher have use only of secondary data of ten years
2006-2015 for data analysis researcher have selected         8. Joseph Jisha (2014):
the technique of ratio analysis.                             closely examines the study of working capital
                                                             management in also Leyland and point out that the
4. Apurba Kumar Sharma (2015):                               liquidity and profitability position of the company is
examined the efficiency of working capital                   not satisfactory and needed to be strengthened in order
management of some select proprietary tea estates            to be able to meet its obligation In time.
registered under tea board on india, operation in
Jordan district of assume during 200809 to 2012-             9. Rahman Mohammad M,(2011):
13.instead of calculating common method of analysing         focuses on the co-relation between working capital
different working capital management ratio three             and profitability.an effective working capital
index value performance index, utilization index and         management has a positive impact on profitability of
efficiency index have been to working capital                firms.from the study it is seen that In the texile
requirement of a firm where as operating cash flows          industry profitability and working capital management
and sales growth are positively related to working           position are found to be up to the mark.
capital to recruitment.
                                                             10. Uyar Ali (2009):
5. Hina Agha (2014):                                         examines the relationship of cash conversion cycle
reviewed the impact of working capital management            with firm size and profitability of the corporations
of profitability the main purpose of the study is to         listed in the Istanbul stock exchange (ISE) for the year
empirically test the impact of working capital               2007.
management on profitability, keeping in mind this
objective he studied the glaxo-smith –line                   To set industry benchmark for cash conversion cycle
pharmaceutical company registered in Karachi stock           (CCC) of merchandising and manufacturing
exchange for the period of 1996-2011.the                     companies.
interpretation of the result is that by increasing the
debtor’s turnover, inventory turnover by decreasing                      III.    RESEARCH DESIGN
creditor’s turnover ratio’s the company can increase its
profitability but there is no significant effect of          3.1 STATEMENT OF THE PROBLEM
increasing or decreasing the current ratio on                Management of the working capital is an important
profitability therefor the result of the research indicate   function of finance department of corporate
that through proper working capital management, the          organization. While managing current assets two
company can increase its profitability.                      important factors that are considered is liquidity and
                                                             profitability. The excess working capital results in
6. Madhavi K. (2014):                                        deterioration in profits and inadequate working capital
makes an empirical study of the co-relation between          results in liquidity risk. So, this study is undertaken to
liquidity position and profitability of the paper mills in   know “The management of working capital in TVS
Andhra Pradesh.it has been observed that inefficient         MOTORS, BIDAR.
working capital management makes a negative impact
on profitability and liquidity position of the paper         3.2 NEED OF THE STUDY
mills.                                                       To fulfil its endeavour to maximize the shareholders
                                                             wealth, firm has to earn sufficiently return from its
7. Gurumurthy N.And Reddy Jayachandra K.(2014):              operation, which needs a successful sales activity. The
have conducted a study on the working capital                firm has to invest sufficient funds in current assets to
management of four pharmaceutical companies                  succeed in sales, as the sales do not convert into cash
APSPDCL,APEPDCL,APNPDCL and APCPDCL                          instantaneously because of time gap between the sales

 IRE 1702800                ICONIC RESEARCH AND ENGINEERING JOURNALS                                             257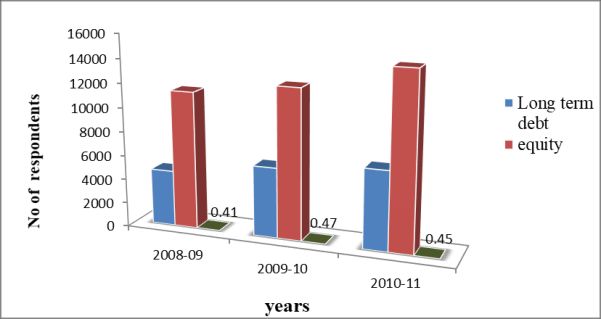
© JUN 2021 | IRE Journals | Volume 4 Issue 12 | ISSN: 2456-8880

of goods and actual receipt in cash. The working          B. Theoretical base regarding working capital
capital need arises for the following purposes;              management’s in various books available in
• For purchasing of raw material, components and             library.
   spare parts.
• For paying wages and salaries.                           IV.    ANALYSIS AND INTERPRETATION OF
• To incur day-to-day expanses and overhead costs                             DATA
   like fuel, power and office expenses, etc.
• 3.3 OBJECTIVES OF THE STUDY                             1. GROSS WORKING CAPITAL POSITION OF 3
• To understand how investment in current assets             YEARS
   effect the organisation profitability.
• To determine the proportion of long-term funds                                                (Rs. in Lacs)
   and short-term funds to finance current assets.                 YEAR               GROSS WORKING
• The different components of current assets and                                         CAPITAL
   liabilities and the extent of funds tied up in each.            2008-09                6773.26
• To identify the financial strengths & weakness of                2009-10                   8946.47
   the company.                                                    2010-11                11863.79
• Evaluating company`s performance relating to            (Source: Annual Report of the Company)
   financial statement analysis.
• To know the liquidity position of the company with
   the help of current ratio.

3.4 SCOPE OF THE STUDY
For the sake of convenience of the study, the scope of
the project is restricted as followed-
• All the aspect of working capital.
• Cash management.
• Debtors management.                                     Analysis:
• Creditors management                                    As we can see in the table, which is earns highest the
• Inventory management.                                   gross working Capital is 11863.79 in the year 2010-11
• Ratio analysis.
                                                          Interpretation:
3.5 RESEARCH METHODOLOGY                                  The above the graph shows that the gross working
Primary Data:                                             capital position is last three years. The gross working
The information is collected through the primary          capital position is high during the year 2010-11
sources like:                                             (11863.79) And low during the year 2008-09
• Talking with the employees of the department.           (6773.26)
• Getting information by observations e.g. in
    manufacturing processes.                              2. NET WORKING CAPITAL POSITION OF 3
                                                             YEARS
• Discussion with the head of the department.

Secondary Data:
This study is based on facts and figures for which
secondary sources are also used for collecting the data                                             (Rs. in Lacs)
and information for this project. The secondary                  Year     Current     Current       Net
sources of data consists of-                                      A        assets    liabilities   working
A. Published Annual Reports of Sai advantium                                 B           C         capital
   Limited.                                                                                        D=B-C

 IRE 1702800               ICONIC RESEARCH AND ENGINEERING JOURNALS                                         258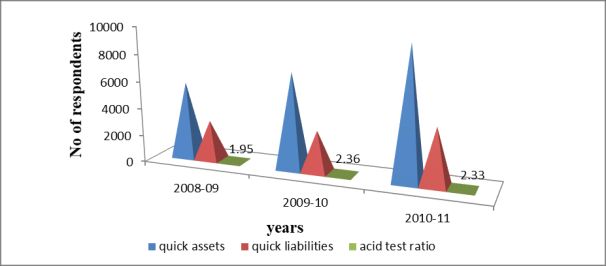
© JUN 2021 | IRE Journals | Volume 4 Issue 12 | ISSN: 2456-8880

      2008-     6773.26     2893.31      3879.95              Net         3879.95      5950.42      7738.13
       09                                                   Working
                                                            capital
      2009-     8946.47     2996.05      5950.42
                                                             Ratio          2.76         2.45           2.38
       10

      010- 11863.79 4125.65 7738.13                       (Source: Annual Report of the Company)
        11
(Source: Annual Report of the Company)

                                                          Analysis:
                                                          The above the table shows that the working capital
Analysis:                                                 turnover ratio is high during the year 2008-09 (2.76)
The above the table shows that net working capital is     and low during the year 2010-11 (2.38).
high during the year 2010-11 (7738.13) and low net
working capital during the year 2008-09 (3879.95).        Interpretation:
                                                          From the graph Higher working capital turnover
Interpretation:                                           indicates the efficiency of the management & Lower
Here the graph explains Any company should have a         working capital turnover ratio indicates the
sufficient net working capital in order to meet the       inefficiency of the management.
claims of the creditors and the day to day needs of       High working capital turnover ratio means over
business. The greater is the amount of net working        trading. And low working capital turnover ratio means
capital the greater must be liquidity of the firm.        under trading. Both are not good for organisation. So
Therefore, Net Working Capital is a measurement of        it should be not high or very low. It should be just
liquidity; inadequate working capital is the first sign   normal.
of financial problem of a firm.
                                                          4. INVENTORY        TURNOVER          RATIO    OF    3
3. WORKING CAPITAL TURNOVER RATIO IN 3                       YEARS
   YEARS
                                                                                               Sales
                                                            Inventory turnover ratio =
      Working capital turnover ratio                                                     Average inventory
                                Sales
                       =                                                                          (Rs. in Lacs)
                         Net working capital
                                                                                         Years
                                          (Rs. in Lacs)     Particulars     2008-09     2009-10     2010-11
                               Years                           Sales       10728.36 14606.68 18444.05
                                                              Average       804.19      1505.14  2065.54
  Particulars    2008-09      2009-10       2010-11
                                                             inventory
    Sales       10728.36      14606.68     18444.05            Ratio        13.34        9.70     8.93
                                                          (Source: Annual Report of the Company)

 IRE 1702800               ICONIC RESEARCH AND ENGINEERING JOURNALS                                        259
© JUN 2021 | IRE Journals | Volume 4 Issue 12 | ISSN: 2456-8880
Interpretation:
from the above graph represents that the current assets
turnover ratio indicates utilization of current assets
increase in ratio speaks of proper investment in current
assets. But decrease in ratio speaks that unwise or
improper investment in current assets.
6. CURRENT RATIO OF 3 YEARS
Analysis:
The table shows that inventory turnover ratio is high Current assets
Current ratio =
during the year 2008-09 (13.34) and low during the Current liabilities
year 2010-11 (8.93).
(Rs. in Lacs)
Interpretation: Years
From the graph represents that, if the actual ratio is Particulars 2008-09 2009-10 2010-11
more than 8 times it indicates that more sales are Current 6773.26 8946.47 11863.79
effected and effective inventory management. assets
Current 2893.31 2996.05 4125.65
5. CURRENT ASSETS TURNOVER RATIO OF 3 liabilities
YEARS Ratio 2.34 2.99 2.88
(Source: Annual Report of the Company)
Sales
Current assets turnover ratio =
Current assets
(Rs. in Lacs)
Years
Particulars 2008-09 2009-10 2010-11
Sales 10728.36 14606.68 18444.05
Current 6773.26 8946.47 11863.79
assets
Ratio 1.58 1.63 1.55 Analysis:
(Source: Annual report of the company) Compare the ideal ratio i.e., 2:1 and actual current
ratio. The above the table shows that high ratio during
the year 2009-10 (2.99) and low during the year 2008-
09 (2.34).
Interpretation:
If current ratio is less than the standard ratio of 2:1, it
indicates that the concern does not enjoy the sufficient
liquidity and shortage of working capital. If current
ratio is more than the ideal ratio it indicates the
Analysis: sufficient liquidity.
The above table shows that current assets turnover
ratio high during the year 2009-10 (1.63) and low 7. ACID TEST RATIO OR QUICK RATIO OF 3
during the year 2010-11 (1.55). YEARS
Quick assets
Acid test ratio =
Quick liabilities
IRE 1702800 ICONIC RESEARCH AND ENGINEERING JOURNALS 260© JUN 2021 | IRE Journals | Volume 4 Issue 12 | ISSN: 2456-8880
(Rs. in Lacs)
Years
Particulars 2008-09 2009-10 2010-11
Quick 5650.98 7058.47 9620.70
assets
Quick 2893.31 2996.05 4125.65
liabilities
Acid test 1.95 2.36 2.33
Analysis:
ratio
The above the table shows that highest during the year
(Source: Annual Report of the Company)
2008-09 (0.71) and above the graph shows the lowest
during the year 2010-11 (0.45).
Interpretation:
From the graph it shows that the Cash position ratio is
expresses relationship between cash and current
liabilities. The standard ratio 1:2. it is exhibits to be
satisfactory with means cash is to be not equal to
current liabilities.
Analysis: 9. DEBT TO EQUITY RATIO OF 3 YEARS
The above table shows that acid test ratio is high
during the year 2009-10 (2.36) and low during the year Debt equity ratio
2008-09 (1.95). Long term debt
=
Owners’ equity (shareholders funds)
Interpretation:
In the graph The Standard ratio is 1:1. If the actual (Rs. in Lacs)
quick ratio is equal or more than standard ratio, it
indicates the sufficient liquidity. And if the actual Years
quick ratio is less than ideal quick ratio it indicates that Particulars 2008-09 2009-10 2010-11
concern is not liquid. Long term 4623.16 5794.46 6523.17
debt
8. CASH POSITION RATIO OF 3 YEARS Equity 11360.62 12362.26 14439.86
Ratio 0.41 0.47 0.45
Cash (Source: Annual Report of the Company)
Cash position ratio =
Current liabilities
(Rs. in Lacs)
Years
Particulars 2008-09 2009-10 2010-11
Cash 2063.43 2002.28 1856.21
Current 2893.31 2996.05 4125.65
liabilities
Cash 0.71 0.67 0.45
position
ratio
IRE 1702800 ICONIC RESEARCH AND ENGINEERING JOURNALS 261© JUN 2021 | IRE Journals | Volume 4 Issue 12 | ISSN: 2456-8880
Analysis: V. FINDINGS
The above the table shows that debt to equity ratio high
during the year 2009-10 (0.47) and low during the year • The company current assets are higher than the
2008-09 (0.41). current liabilities & the ratio is also above the
standard position of 2:1. It indicate sufficient
Interpretation: liquidity.
From the graph it represents If the debt ratio is less • It is found that company Quick ratio is sound for
than 2 times of equity indicates that the financial all three years as it was always above the standard
structure of the concern is sound. On other hand, if the ratio of 1:1. It indicates sufficient liquidity.
debt is more than 2 times of the equity, it indicates that • It is found that company debt equity ratio is lower
the financial structure is week. than the owners equity fund & the ratio is not
above the standard position 2:1. In indicates that
10. CURRENT ASSETS TO FIXED ASSETS the financial structure of t he concern is sound.
RATIO OF 3 YEARS • It is found that company inventory turnover ratio
is high reflects faster movement of stock for all
Current assets three years as it was always above the standard
Current assets to fixed assets =
Fixed asset ratio of 8 times.
• Even though the company tried to show a positive
(Rs. in Lacs)
recovery in working capital still it is not sustaining
years on the same trend.
• It is found from the study that cash flow of the
Particulars 2008-09 2009-10 2010-11 company has ups and downs which finally do not
Current 6773.26 8946.47 11863.79 supporting the net working capital
assets • It is observed from the study of working capital
Fixed 12319.39 12713.86 13996.55 turnover ratio high for all the years it indicates
assets efficiency of the management and it is no any
Ratio 0.55 0.70 0.85 standard ratio.
(Source: Annual Report of the Company)
VI. SUGGESTIONS
• Company is reducing its credit basis sales so they
can maintain its cash transaction more.
• Companies try to avoid more use of creditors fund
so that it will be advisable to the company can issue
more equity shares and to increase their net
working capital.
• Company has tried to maintain standard working
capital policy. So that it helps to the company in
utilizing the working capital for all the purpose.
Analysis: • Company has to maintain strict policy towards
The above the table shows that current assets to fixed debtors. This will lead to avoid bad debts and
assets ratio is high during the year 2010-11 (0.85) and maintains the expenditure.
low during the year 2008-09 (0.55). • The company should take effective steps to
increase the sales, for reducing wastages on
Interpretation: Transportation expenses.
From the graph it shows that the Current Assets to • Company tries to utilize its working capital
Fixed Assets Ratio of 3 years. The value of the assets properly. So that it will help in avoiding both under
which is increases in the year of 2010-11 trading and over trading
IRE 1702800 ICONIC RESEARCH AND ENGINEERING JOURNALS 262© JUN 2021 | IRE Journals | Volume 4 Issue 12 | ISSN: 2456-8880
CONCLUSION ,Issue 11 ,May 2021 Page 244-259. Available at
https://irejournals.com/paper-details/1702750
The present study reveals the following important [5] Haralayya and P. S. Aithal, “A Study On
outcomes: Structure and Growth of Banking Industry in
• Sai Life Insurance Ltd is playing very important India”, International Journal of Research in
role in augmenting socio-economic development Engineering, Science and Management ,Volume
of the share members. 4, Issue 5, May 2021.Page no 225–230.
• The majority of farmers are satisfied for price and Available at:
the payment of the bills. https://www.journals.resaim.com/ijresm/article/
• Much growth opportunities are kept open for view/778/749.
utilizing by-products in an effective manner. [6] Bhadrappa Haralayya, Retail Banking Trends in
• Shareholders are satisfied with the performance of India ,International Journal of All Research
the company. Education and Scientific Methods (IJARESM),
• The management provides an opportunity for their Volume: 9, Issue: 5, Year: May 2021, Page No :
growth and welfare of its employees. 3730-3732. Available At
• Central and State Government have to come http://www.ijaresm.com/uploaded_files/docume
forward to assist the industry with promising nt_file/Bhadrappa_Haralayyaqscw.pdf
policies. [7] BHADRAPPA HARALAYYA, P.S.AITHAL,
FACTORS DETERMINING THE
REFERENCES EFFICIENCY IN INDIAN BANKING
SECTOR : A TOBIT REGRESSION
[1] BHADRAPPA HARALAYYA , P.S.AITHAL , ANALYSIS", International Journal of Science &
PERFORMANCE AFFECTING FACTORS OF Engineering Development Research
INDIAN BANKING SECTOR: AN (www.ijsdr.org), Vol.6, Issue 6, June-2021, page
EMPIRICAL ANALYSIS, George Washington no.1 - 6, , Available
International Law Review, Vol.- 07 Issue -01, :http://www.ijsdr.org/papers/IJSDR2106001.pdf
April-June 2021, PAGE No : 607-621, Available
[8] BHADRAPPA HARALAYYA, P.S.AITHAL,
at: http://archive-gwilr.org/wp-
STUDY ON PRODUCTIVE EFFICIENCY OF
content/uploads/2021/06/Bhadrappa-
FINANCIAL INSTITUTIONS, International
Haralayya.pdf
Journal of Innovative Research in Technology,
[2] BHADRAPPA HARALAYYA , P.S.AITHAL , Volume 8, Issue 1, June-2021 ,Page no: 159 –
IMPLICATIONS OF BANKING SECTOR ON 164, Available:
ECONOMIC DEVELOPMENT IN INDIA, http://ijirt.org/master/publishedpaper/IJIRT1515
flusserstudies, Volume 30, June 2021,Page 14_PAPER.pdf
No:1068-1080, Available at:
[9] BHADRAPPA HARALAYYA , STUDY OF
https://flusserstudies.org/archives/801
BANKING SERVICES PROVIDED BY
[3] BHADRAPPA HARALAYYA , P.S.AITHAL BANKS IN INDIA, International Research
,STUDY ON PRODUCTIVE EFFICIENCY OF Journal of Humanities and Interdisciplinary
BANKS IN DEVELOPING COUNTRY, Studies (www.irjhis.com), Volume: 2, Issue: 6,
International Research Journal of Humanities Year: June 2021,Page No : 06-12, Available at :
and Interdisciplinary Studies (www.irjhis.com) http://irjhis.com/paper/IRJHIS2106002.pdf.
,Volume: 2, Issue: 5, May 2021, Page No : 184-
[10] BHADRAPPA HARALAYYA, P.S.AITHAL ,
194. Available at :
ANALYSIS OF BANK PERFORMANCE
http://irjhis.com/paper/IRJHIS2105025.pdf
USING CAMEL APPROACH", International
[4] Bhadrappa Haralayya ; P. S. Aithal . "Study on Journal of Emerging Technologies and
Model and Camel Analysis of Banking" Iconic Innovative Research (www.jetir.org | UGC and
Research And Engineering Journals ,Volume 4 issn Approved), Vol.8, Issue 5, May-2021, page
IRE 1702800 ICONIC RESEARCH AND ENGINEERING JOURNALS 263© JUN 2021 | IRE Journals | Volume 4 Issue 12 | ISSN: 2456-8880
no 305-314, Available at : [17] Haralayya B. How Digital Banking has Brought
http://www.jetir.org/papers/JETIR2105840.pdf Innovative Products and Services to India.
[11] BHADRAPPA HARALAYYA, P.S.AITHAL, Journal of Advanced Research in Quality Control
ANALYSIS OF BANK PRODUCTIVITY and Management 2021; 6(1): 16-18
USING PANEL CAUSALITY TEST, Journal of [18] Haralayya B. Top 5 Priorities That will Shape
Huazhong University of Science and The Future of Retail Banking Industry in India.
Technology, Volume 50, Issue 6, June-2021 , Journal of Advanced Research in HR and
Page no: 1 – 16, Available at: Organizational Management 2021; 8(1&2): 17-
https://app.box.com/s/o71lh776opeypauvzucp9e 18.
sntjwur9zf [19] Haralayya B. Millennials and Mobile-Savvy
[12] BHADRAPPA HARALAYYA, P.S.AITHAL, Consumers are Driving a Huge Shift in The
INTER BANK ANALYSIS OF COST Retail Banking Industry. Journal of Advanced
EFFICIENCY USING MEAN, International Research in Operational and Marketing
Journal of Innovative Research in Science, Management 2021; 4(1): 17-19
Engineering and Technology (IJIRSET), [20] Haralayya B. Core Banking Technology and Its
Volume 10, Issue 6, June-2021 ,Page no: 6391- Top 6 Implementation Challenges. Journal of
6397, Available at: Advanced Research in Operational and
http://www.ijirset.com/upload/2021/june/97_IN Marketing Management 2021; 4(1): 25-27
TER_NC1.pdf
[21] Nitesh S Vibhute ; Dr. Chandrakant B. Jewargi ;
[13] BHADRAPPA HARALAYYA, P.S.AITHAL , Dr. Bhadrappa Haralayya . "Study on Non-
ANALYSIS OF TOTAL FACTOR Performing Assets of Public Sector Banks"
PRODUCTIVITYAND PROFITABILITY Iconic Research And Engineering Journals
MATRIX OF BANKS BY HMTFP AND Volume 4, Issue, 12 June 2021, Page 52-61
FPTFP, Science, Technology and Development Available at
Journal, Volume 10, Issue 6, June-2021, Page https://irejournals.com/formatedpaper/1702767.
no: 190-203, Available at: pdf
http://journalstd.com/gallery/23-june2021.pdf
[22] Haralayya, Dr. Bhadrappa and Saini, Shrawan
[14] BHADRAPPA HARALAYYA, P.S.AITHAL , Kumar, An Overview on Productive Efficiency
ANALYSIS OF BANKS TOTAL FACTOR of Banks & Financial Institution (2018).
PRODUCTIVITY BY AGGREGATE LEVEL, International Journal of Research, Volume 05
Journal of Xi'an University of Architecture & Issue 12, April 2018, Available at SSRN:
Technology, Volume 13, Issue 6, June- 2021 https://ssrn.com/abstract=3837503
,Page no: 296-314, available at:
[23] Haralayya, Dr. Bhadrappa, Review on the
https://www.xajzkjdx.cn/gallery/28-
Productive Efficiency of Banks in Developing
june2021.pdf
Country (2018). Journal for Studies in
[15] Bhadrappa Haralayya, P S Aithal, "ANALYSIS Management and Planning, Volume 04 Issue 05,
OF BANKS TOTAL FACTOR April 2018, Available at SSRN:
PRODUCTIVITY BY DISAGGREGATE https://ssrn.com/abstract=3837496
LEVEL", International Journal of Creative
[24] Basha, Jeelan and Haralayya, Dr. Bhadrappa,
Research Thoughts (IJCRT), Volume.9, Issue 6,
Performance Analysis of Financial Ratios -
June 2021, pp.b488-b502, Available at
Indian Public Non-Life Insurance Sector (April
:http://www.ijcrt.org/papers/IJCRT2106187.pdf
30, 2021). Available at SSRN:
[16] Haralayya B. Importance of CRM in Banking https://ssrn.com/abstract=3837465.
and Financial Sectors Journal of Advanced
[25] Haralayya, Dr. Bhadrappa, The Productive
Research in Quality Control and Management
Efficiency of Banks in Developing Country With
2021, 6(1): 8-9
Special Reference to Banks & Financial
Institution (april 30, 2019). Available at SSRN:
IRE 1702800 ICONIC RESEARCH AND ENGINEERING JOURNALS 264© JUN 2021 | IRE Journals | Volume 4 Issue 12 | ISSN: 2456-8880
https://ssrn.com/abstract=3844432 or
http://dx.doi.org/10.2139/ssrn.3844432
[26] Haralayya, Dr. Bhadrappa, Study on
Performance of Foreign Banks in India (APRIL
2, 2016). Available at SSRN:
https://ssrn.com/abstract=3844403 or
http://dx.doi.org/10.2139/ssrn.3844403
[27] Haralayya, Dr. Bhadrappa, E-Finance and the
Financial Services Industry (MARCH 28, 2014).
Available at SSRN:
https://ssrn.com/abstract=3844405 or
http://dx.doi.org/10.2139/ssrn.3844405
[28] Haralayya, Dr. Bhadrappa, E-payment - An
Overview (MARCH 28, 2014). Available at
SSRN: https://ssrn.com/abstract=3844409 or
http://dx.doi.org/10.2139/ssrn.3844409.
IRE 1702800 ICONIC RESEARCH AND ENGINEERING JOURNALS 265You can also read